. 2023 Oct 30;14(1):6900.
doi: 10.1038/s41467-023-42521-x.

DIAPH1-MFN2 interaction regulates mitochondria-SR/ER contact and modulates ischemic/hypoxic stress

Affiliations

DIAPH1-MFN2 interaction regulates mitochondria-SR/ER contact and modulates ischemic/hypoxic stress

Gautham Yepuri et al. Nat Commun. .

Abstract

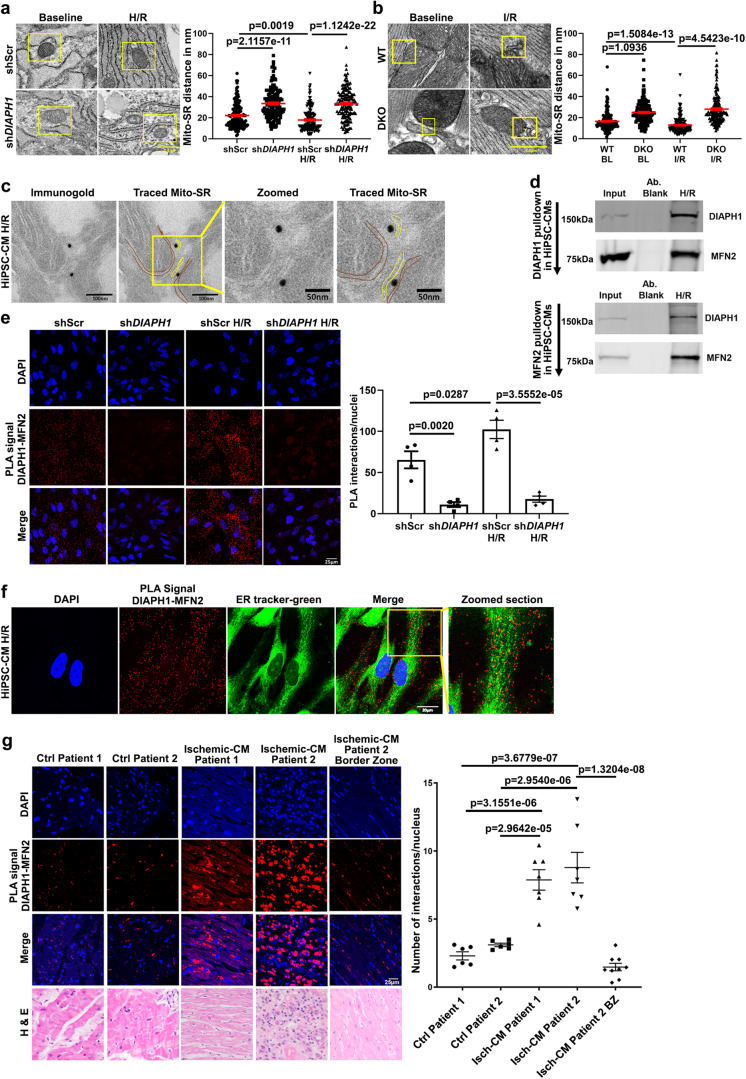
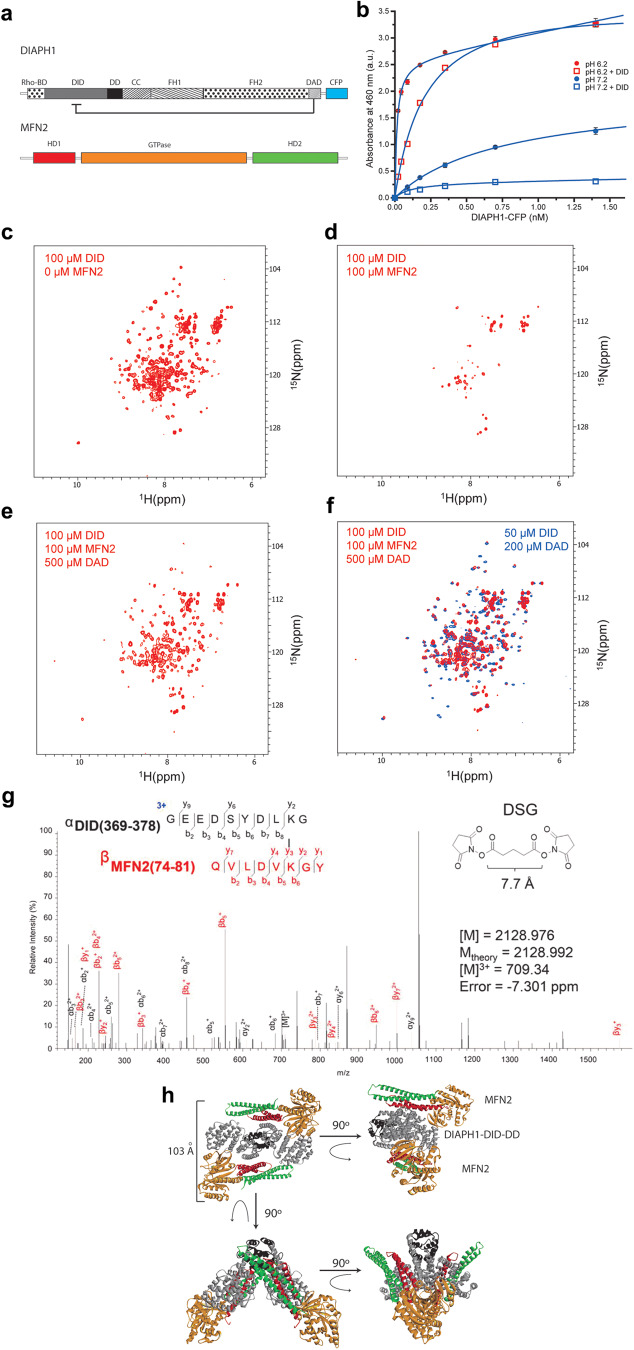
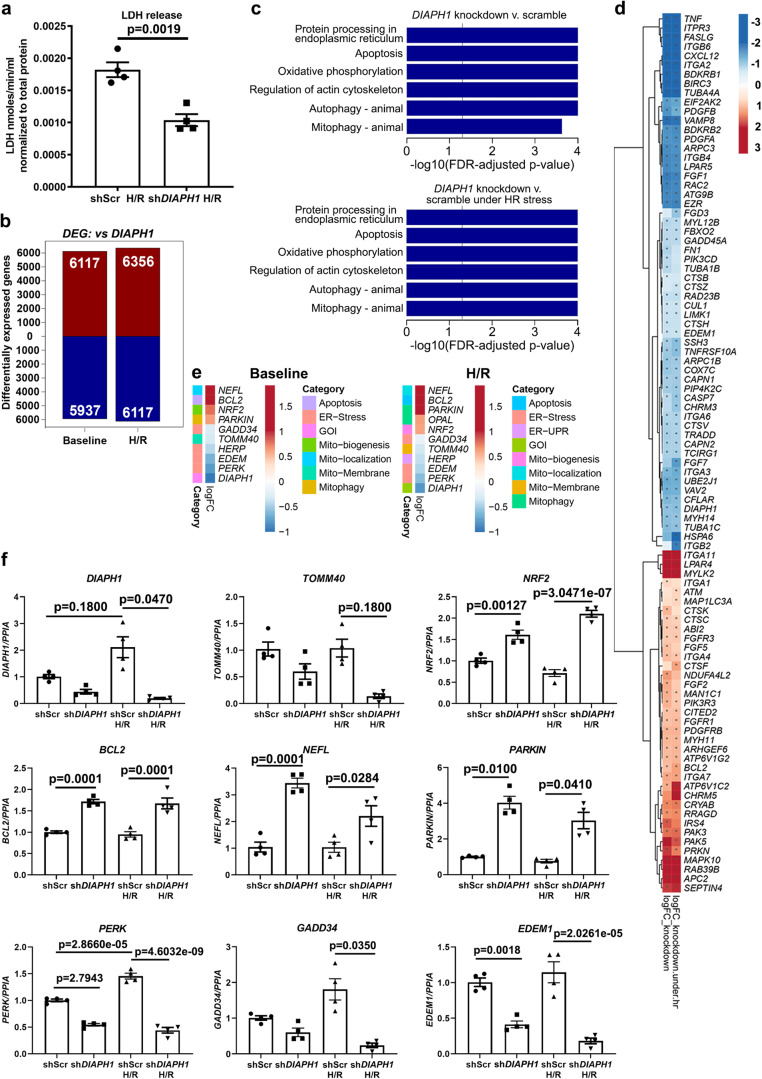
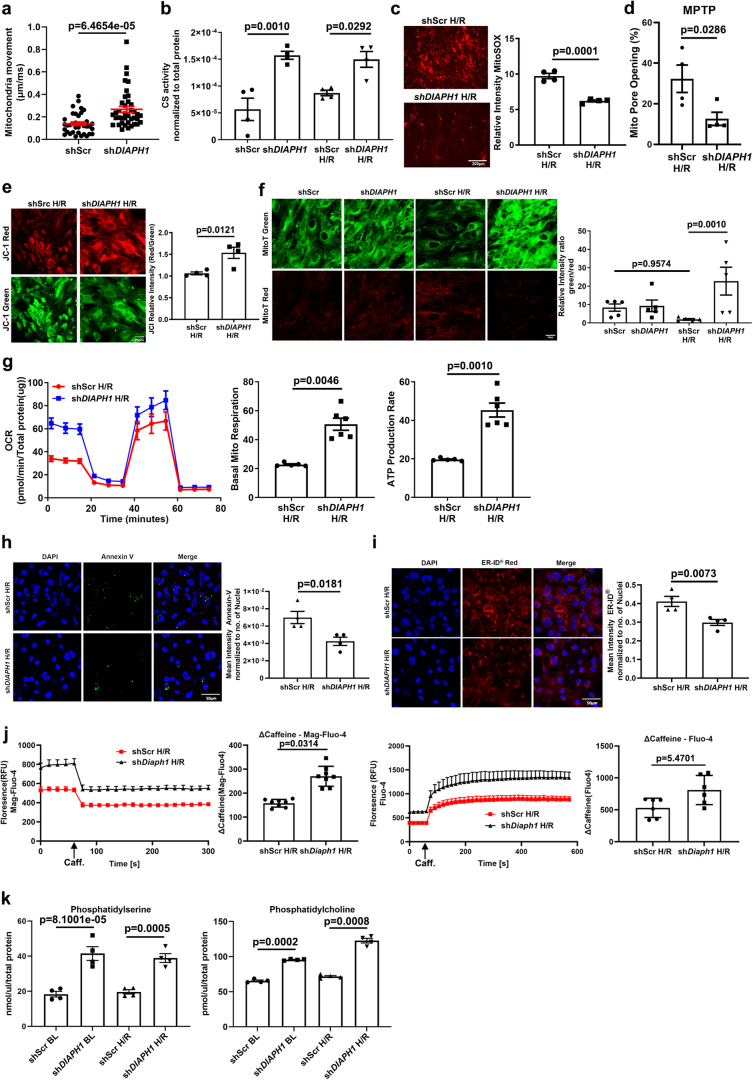
Inter-organelle contact and communication between mitochondria and sarco/endoplasmic reticulum (SR/ER) maintain cellular homeostasis and are profoundly disturbed during tissue ischemia. We tested the hypothesis that the formin Diaphanous-1 (DIAPH1), which regulates actin dynamics, signal transduction and metabolic functions, contributes to these processes. We demonstrate that DIAPH1 interacts directly with Mitofusin-2 (MFN2) to shorten mitochondria-SR/ER distance, thereby enhancing mitochondria-ER contact in cells including cardiomyocytes, endothelial cells and macrophages. Solution structure studies affirm the interaction between the Diaphanous Inhibitory Domain and the cytosolic GTPase domain of MFN2. In male rodent and human cardiomyocytes, DIAPH1-MFN2 interaction regulates mitochondrial turnover, mitophagy, and oxidative stress. Introduction of synthetic linker construct, which shorten the mitochondria-SR/ER distance, mitigated the molecular and functional benefits of DIAPH1 silencing in ischemia. This work establishes fundamental roles for DIAPH1-MFN2 interaction in the regulation of mitochondria-SR/ER contact networks. We propose that targeting pathways that regulate DIAPH1-MFN2 interactions may facilitate recovery from tissue ischemia.


Conflict of interest statement

A.M.S., A.S., and R.R. have patents and patent applications through NYU Grossman School of Medicine that have been submitted/published and that are related to some of the work detailed in this manuscript. These include the following: (i) Patent Number 10,729,695 (United States), (ii) patent number 10,265,320 (United States), (iii) application number 14851038.1 (pending, Europe), (iv) application number 16/094,720 (pending, United States), (v) application number 17786436.0 (pending, Europe), (vi) application number PCT/US2020/044926 (pending, United States). R.R. is a consultant for Applied Therapeutics. The remaining authors declare no competing interests.

Figures

Fig. 1
Fig. 1. DIAPH1 regulates Mitochondria(Mito)-SR/ER distance through interaction with MFN2.
TEM imaging was performed to measure Mito-SR/ER distance a shScr and shDIAPH1 hiPSC-CMs under normal and H/R conditions and b in perfused WT and DKO mice hearts under baseline or I/R conditions. The distance was measured using NIH ImageJ software. Scale bar 0.5 µm. (for a and b, Mito-SR/ER distance (in nm) from four biologically independent samples, Krushal–Wallis with Dunn’s pairwise comparison test was performed for p values) c Immuno-electron microscopy study showing DIAPH1 Immunogold particles located in close proximity with Mito and SR in HiPSC-CMs exposed to H/R. Scale bar 100 nm and 50 nm. d DIAPH1 and MFN2 pull-down assay in HiPSC-CMs exposed to H/R. Upper panel represents DIAPH1 pulldown followed by Western blot detection with MFN2 antibody and the lower panel represents MFN2 pulldown with DIAPH1 antibody detection. Input refers to the total lysate, Ab blank refers to IP sample without DIAPH1/MFN2 antibody e Leica SP8 Confocal microscopy images of fluorescent DUOLINK proximity ligation assay (PLA) signal of DIAPH1–MFN2. Interactions are represented as red dots and corresponding quantification was represented by number of positive interactions per nucleus in shScr and shDIAPH1 hiPSC-CMs under baseline and H/R. Scale bar 25 µm. f Leica SP8 confocal microscopy images of HiPSC-CMs under H/R stained with live staining ER-tracker green followed by co-staining with DUOLINK PLA red to detect SR–DIAPH1–MFN2 localization. Scale bar 20 µm. g DIAPH1-MFN2 DUOLINK PLA interactions in human heart biopsy sections (ischemic and non-ischemic) Scale bar 25 µm. The control samples were post-transplant endomyocardial biopsy and all other samples were sections of left ventricle from heart explants of patients with ischemic cardiomyopathy. Corresponding closest matched sections to DUOLINK for H&E staining was used to detect muscle morphology. Magnification for H&E sections were at 40×, 40×, 20×, 40×, and 20× respectively, in the order mentioned in the figure. For human biopsy samples, n represents random images taken from each tissue biopsy(for p values t-test with pooled SD was performed to compare between different patient biopsies. Unpaired t-test was performed between groups Isch-CM patient 2 vs. Isch-CM patient 2). Data are presented as the mean ± SEM. Statistics file and source data are provided as a Source Data file.
Fig. 2
Fig. 2. Structural characterization of DIAPH1–MFN2 interaction.
a Domain structure of the studied proteins. DIAPH1–CFP domains are Rho-BD, Rho GTPase binding domain; DID; DD, dimerization domain; CC, coiled-coil; FH1/2; DAD; and CFP, cyan fluorescent protein, respectively. MFN2 domains are HD1/2, helical domains 1 and 2; and GTase domain. The autoinhibitory intramolecular DID–DAD interaction is indicated. b Binding of the cytosolic MFN2 with DIAPH1-cyan fluorescent protein, CFP, under neutral (blue circles), Kd = 0.7 ± 0.1 nM, and acidic (red circles), Kd = 0.01 ± 0.003 nM, conditions. The binding in the presence of the competitor, DID, is shown by the blue (no binding) and red (Kd = 0.2 ± 0.1 nM) squares under neutral and acidic conditions, correspondingly. Data are presented as mean values ± SEM. cf. Structural basis of the DID–MFN2 interaction probed by NMR spectroscopy. 1H-15N-HSQC spectra of [U-15N]-DID upon titration with MFN2 and DAD peptide at 305 K. Amide proton–nitrogen cross-peaks from the protein backbone and side chains of 100 µM [U-15N]-DID are broadened upon addition of MFN2 (c, d). Adding DAD peptide (500 µM) restores the cross peaks of DID (e, f). In panel f, red peaks correspond to the NMR spectrum of 100 µM [U-15N]-DID with 100 µM MFN2 and 500 µM DAD, while blue peaks correspond to the NMR spectrum of 50 µM [U-15N]-DID with 200 µM DAD. g A representative high-energy collision MS spectrum was obtained for the DSG cross-linked product between MFN2 and DID at 709.34 m/z. The inlay shows the sequence and composition of cross-linked peptides and an experimental mass of 2128.976 Da, which is in good agreement with the theoretical mass of 2128.992 Da calculated using putative elemental composition. Standard nomenclature was used in labeling charge states and fragment ions. MS data were deposited to ProteomeXchange, https://www.proteomexchange.org/, and jPOST, https://repository.jpostdb.org/, sites with accession numbers PXD045744 and JPST002335, respectively. h Representative ribbon model of the docked MFN2:DIAPH1–DID–DD tetrameric complex. MFN2 and DIAPH1-DID-DD are colored according to the domain structure of panel (a). Source data are provided as a Source Data file.
Fig. 3
Fig. 3. Genomics data establish a link between DIAPH1 and Mito-SR/ER function.
a LDH release was measured in the supernatant of shDIAPH1 HiPSC-CMs compared to shScr HiPSC-CMs exposed to 30 min hypoxia and 60 min reoxygenation (H/R) to mimic ischemic injury (n represents four biologically independent samples, unpaired t-test was performed for p values). b Bulk RNAseq studies to show the total number of DEGs in shScr and shDIAPH1 HiPSC-CMs under baseline and H/R conditions. c KEGG pathway enrichment analysis was performed to show differentially regulated pathways, and d heat maps showing the top 50 up and downregulated genes related to mitochondria and SR/ER function (data obtained from four biologically independent samples). e Heat maps showing DEGs specific to mitochondria and SR/ER stress from more sensitive and targeted nCounter technology by NanoString (data obtained from four biologically independent samples). f qPCR validation of SR/ER stress and mitochondria markers confirmed by Bulk RNAseq and NanoString technology (n represents four biologically independent samples. Shapiro–Wilk test normality test was performed for all groups, following tests were performed for each gene respectively; Welch’s ANOVA with Games–Howell pairwise comparison Test for DIAPH1, GADD34, and PARKIN, Krushal–Wallis with Dunn’s pairwise comparison test for TOMM40 and ANOVA with TukeyHSD pairwise comparison for NRF2, BCL2, NEFL, PERK, and EDEM1). Data are presented as the mean ± SEM. Source data are provided as a Source Data file.
Fig. 4
Fig. 4. Silencing DIAPH1 improves mitochondrial and ER function.
a Represents quantification of mitochondrial velocity (µm/ms) in shScr and shDIAPH1 hiPSC-CMs under baseline conditions. Nikon Eclipse Ti Epifluorescence Microscope (Inverted) at 40× magnification was used to obtain images of cells stained with MitoTracker™ Red CMXRos live cell imaging dye (each value represents velocity for individual mitochondria tracked, n = 5 biologically independent samples, p value obtained from Wilcoxon rank-sum test). b Colorimetric assessment of citrate synthase activity in HiPSC-CMs under Baseline and H/R (n = 4 biologically independent samples, p value obtained from ANOVA with TukeyHSD pairwise comparison test). c Mitochondria superoxide measurements as measured by 5 µM MitoSOX dye in shScr and shDIAPH1 hiPSC-CMs upon H/R. Scale bar 200 µm (n = 4 biologically independent samples, unpaired t test was performed for p value). d Mitochondria pore opening measured by flow-cytometry using mitochondrial Permeability Transition Pore Assay Kit in HiPSC-CMs under H/R conditions (n = 4 biologically independent samples, one-tailed Wilcoxon rank-sum test was performed for p value). e Leica SP8 Confocal microscopy at 63× magnification and respective quantification of the relative intensity of JC-1 (red/green) dye to measure mitochondria membrane potential in shScr and shDIAPH1 hiPSC-CMs under H/R (n = 4 biologically independent samples, unpaired t test was performed for p value). f Leica SP8 Confocal microscopy images of fluorescent MitoTimer signal of young (green) and old (red fluorescence) mitochondria in HiPSC-CMs. Quantification represents the ratio of the relative intensity of green to red indicating the turnover of Mito (n = 4 biologically independent samples, Kruskal–Wallis with Dunn’s pairwise comparison test was performed for p value). g Represents oxygen consumption rate (OCR) measurements obtained from Seahorse. The panel also represents basal mitochondrial respiration and ATP production rate extrapolated from OCR measurement (n = 5 for shScr and 6 for shDIAPH1 biologically independent samples, Welch’s unpaired t-test was performed for p value). h Leica SP8 confocal images and respective quantification of Annexin V-FITC staining to measure apoptosis in shScr and shDIAPH1 HiPSC-CMs exposed to H/R. Scale bar 50 µM. (n = 4 biologically independent samples, unpaired t-test was performed for p value). i Leica SP8 confocal microscopy images and respective quantification of ER-ID® Red staining to measure ER stress in shScr and shDIAPH1 HiPSC-CMs exposed to H/R conditions. Scale bar 50 µM. (n = 4 biologically independent samples, ANOVA with TukeyHSD test was performed for p value). j Live cell ER lumen and cytosolic calcium measurements in shScr and shDiaph1 H9C2 cells exposed to H/R using 20 µM Mag-Fluo-4 AM and 5 µM Fluo-4 AM dye, respectively. ER, calcium content was estimated as the delta between basal and caffeine-stimulated fluorescence measurements (n = 6 biologically independent samples for fluo4 and n = 8 for Mag-fluo4, unpaired t-test was performed for p value). k Fluorometric assay to measure phosphatidylserine and phosphatidylcholine levels using TECAN infinity pro 200 plate reader (n = 4 biologically independent samples, Welch’s ANOVA with Games–Howell pairwise comparison test for phosphatidylcholine and ANOVA with TukeyHSD pairwise comparison for phosphatidylserine was performed for p value). Data are presented as the mean ± SEM. A normality test was performed for all groups. All statistics and source data are provided as a Source Data file.
Fig. 5
Fig. 5. Deletion of CM-specific Diaph1 is protective in ischemia/reperfusion injury.
a Generation of Diaph1 floxed mice. Schematic representation of Diaph1 targeting strategy, resulting in deletion of exons 4–7. The diagram is not depicted to scale. Hatched rectangles represent Diaph1 coding sequences, gray rectangles indicate non-coding exon portions, and solid line represents chromosome sequence. The initiation codon (ATG) and stop codon (Stop) are indicated. FRT sites are represented by double red triangles, and loxP sites by blue triangles. Diaph1flox/flox Cre (+) (“CM-DKO”) and Diaph1flox/flox Cre (−) (“WT”) mice hearts which underwent LAD ligation for 30 min creating ischemic/no flow condition followed by reperfusion to mimic I/R injury. b Quantification of infarct size in CM-DKO and WT hearts (n = 6 biologically independent samples, unpaired t-test was performed for p value). 2D-echocardiography measurements of (c, d), ejection fraction (n = 6 biologically independent samples, unpaired t-test was performed for p value) and e, f fractional shortening 48 h post LAD surgery in CM-DKO and WT mice (n = 6 biologically independent samples, Wilcoxon rank-sum test was performed for pre-echo and unpaired t-test was performed for post-echo p value). Data are presented as the mean ± SEM. All statistics and source data are provided as a Source Data file.
Fig. 6
Fig. 6. RAGE–DIAPH1 regulates Mito-SR/ER distance and DIAPH1–MFN2 interactions in HiPSC-CMs.
a. Leica SP8 confocal microscopy images at 63X magnification of DIAPH1–MFN2 DUOLINK PLA signal and corresponding quantification of signal in shAGER and shScr HiPSC-CMs under baseline and H/R conditions. Scale bar 25 µm. (n = 4 biologically independent samples, ANOVA with TukeyHSD pairwise comparison test was performed for p value). b Represents TEM images to measure Mito-SR/ER distance and quantification using NIH-ImageJ software in shAGER and shScr HiPSC-CMs under baseline and H/R conditions. Scale bar 0.5 µm. (Each value represents Mito-SR/ER distance in nm originating from four biologically independent samples, Kruskal–Wallis with Dunn’s pairwise comparison test was performed for p values) c Leica SP8 confocal microscopy images at 63× magnification of DIAPH1–MFN2 DUOLINK PLA signal and corresponding quantification in HiPSC-CMs treated with RAGE229, 10 µM, for 1 h under baseline and H/R conditions. Scale bar 25 µm. (n = 4 biologically independent samples, unpaired t-test was performed for p value). d Treatment with CML-AGE, 500 µg/ml, for 1 h and RAGE229, 10 µM, for 1 h. For combined treatment, RAGE229 was added 10 min prior to the addition of CML-AGE treatment for 1 h. Scale bar 25 µm. (n = 6 biologically independent samples, Welch’s ANOVA with Games–Howell pairwise comparison test was performed for p value). Data are presented as the mean ± SEM. All statistics and source data are provided as a Source Data file.
Fig. 7
Fig. 7. Reduction of Mito-SR/ER distance with physical linkers abrogates the benefits of DIAPH1 silencing in HiPSC-CMs in H/R.
a Scheme representing the construction of FRB–FKBP12–RAPAMYCIN–Linker complex fluorescence YFP and RFP tags. b Leica SP8 confocal microscopy images at 63× magnification representing 48 h post Lipofectamine LTX transfection followed by treatment with 100 nM rapamycin for 10 min. Scale bar 25 µm. (Data reproduced from two independent experiments) c TEM images and quantification after successful transfection with mitochondria and SR/ER localization sequences with or without 100 nM rapamycin treatment to reduce Mitochondria and SR/ER to approximately 5 nm. Scale bar 0.5 µm. (Each value represents Mito-SR/ER distance in nm originating from four biologically independent samples, Kruskal–Wallis with Dunn’s pairwise comparison test was performed for p values) d Colorimetric assay to detect LDH levels in conditioned medium obtained from linker groups (n = 4–6 biologically independent samples, ANOVA with TukeyHSD pairwise comparison test was performed for p value). e MitoSOX staining to detect mitochondrial superoxide and respective quantification using NIH-ImageJ. Images were taken at 10× magnification using an EVOS epifluorescence microscope with an RFP filter. Scale bar 200 µm. (n = 6 biologically independent samples, ANOVA–TukeyHSD pairwise comparison test was performed for p value). f qPCR under linker conditions for SR/ER and mitochondrial markers. N represents biological replicates originating from at least two consecutive batches. (n = 4 biologically independent samples. Welch’s ANOVA with Games–Howell pairwise comparison test for DIAPH1, PERK, and EDEM1, Krushal–Wallis with Dunn’s pairwise comparison test for GADD34, and ANOVA with TukeyHSD pairwise comparison for BCL2 and PARKIN for p values). Data are presented as the mean ± SEM. All statistics and source data are provided as a Source Data file.

References

    1. Paillard M, et al. Depressing mitochondria-reticulum interactions protects cardiomyocytes from lethal hypoxia-reoxygenation injury. Circulation. 2013;128:1555–1565. doi: 10.1161/CIRCULATIONAHA.113.001225. - DOI - PubMed
    1. Scheffer DDL, Garcia AA, Lee L, Mochly-Rosen D, Ferreira JCB. Mitochondrial fusion, fission, and mitophagy in cardiac diseases: challenges and therapeutic opportunities. Antioxid. Redox Signal. 2022;36:844–863. doi: 10.1089/ars.2021.0145. - DOI - PMC - PubMed
    1. Gottlieb RA, et al. At the heart of mitochondrial quality control: many roads to the top. Cell Mol. Life Sci. 2021;78:3791–3801. doi: 10.1007/s00018-021-03772-3. - DOI - PMC - PubMed
    1. Ong SB, Gustafsson AB. New roles for mitochondria in cell death in the reperfused myocardium. Cardiovasc. Res. 2012;94:190–196. doi: 10.1093/cvr/cvr312. - DOI - PMC - PubMed
    1. Ong SB, Hausenloy DJ. Mitochondrial morphology and cardiovascular disease. Cardiovasc. Res. 2010;88:16–29. doi: 10.1093/cvr/cvq237. - DOI - PMC - PubMed

Publication types