. 2023 Oct 30;13(1):18573.
doi: 10.1038/s41598-023-45201-4.

Exploring intrinsic variability between cultured nasal and bronchial epithelia in cystic fibrosis

Affiliations

Exploring intrinsic variability between cultured nasal and bronchial epithelia in cystic fibrosis

Lisa W Rodenburg et al. Sci Rep. .

Abstract

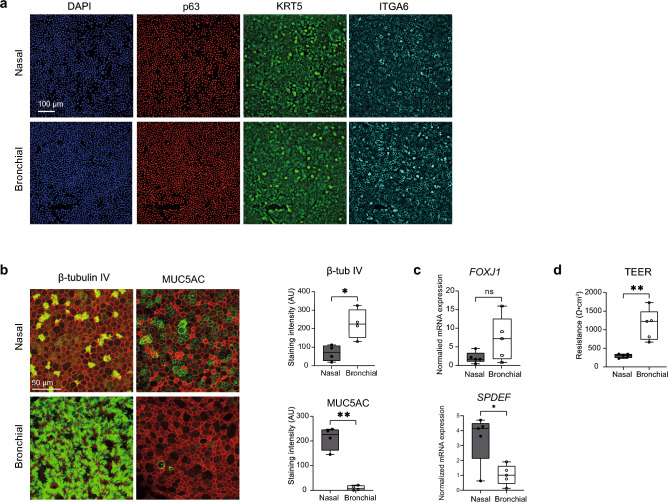
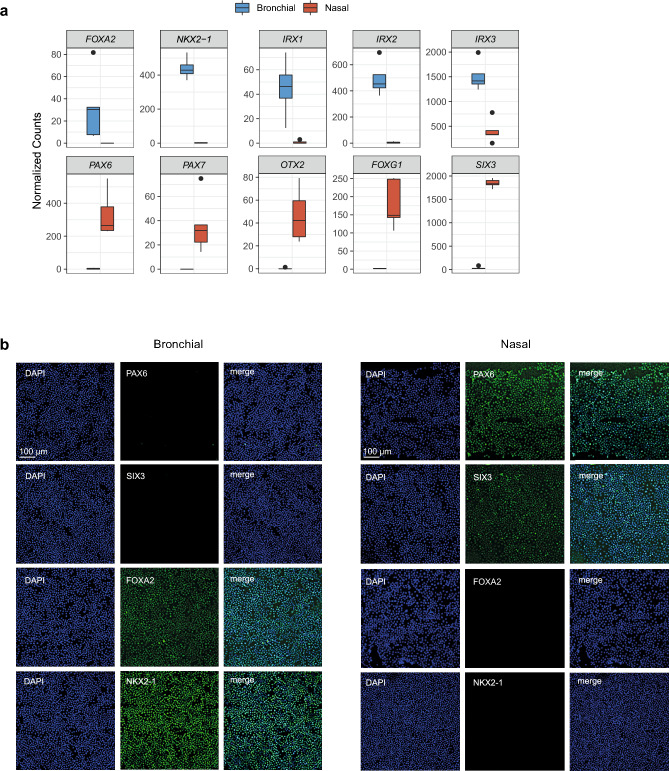
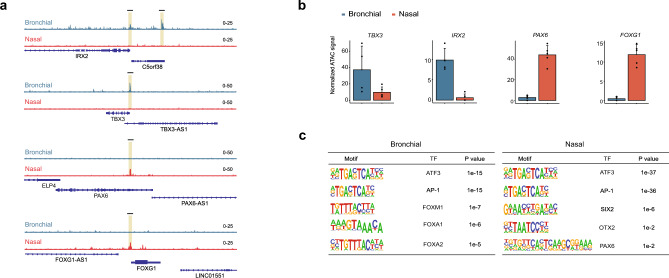
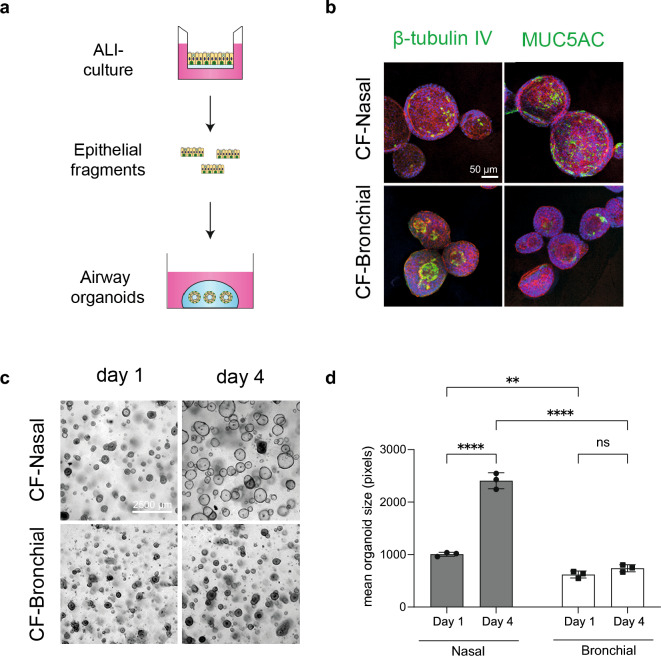
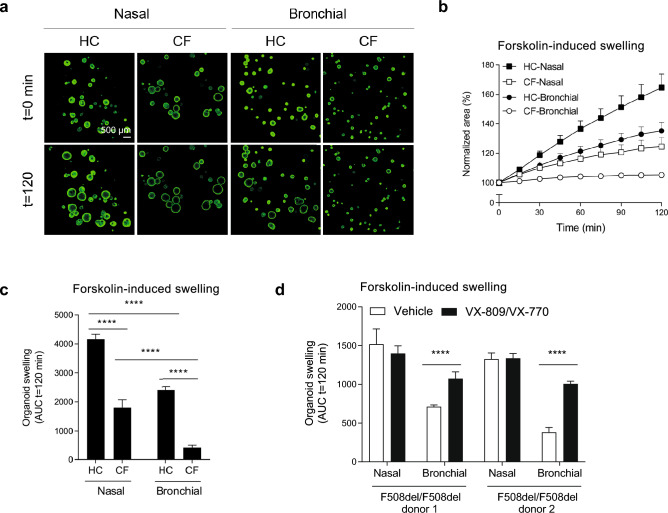
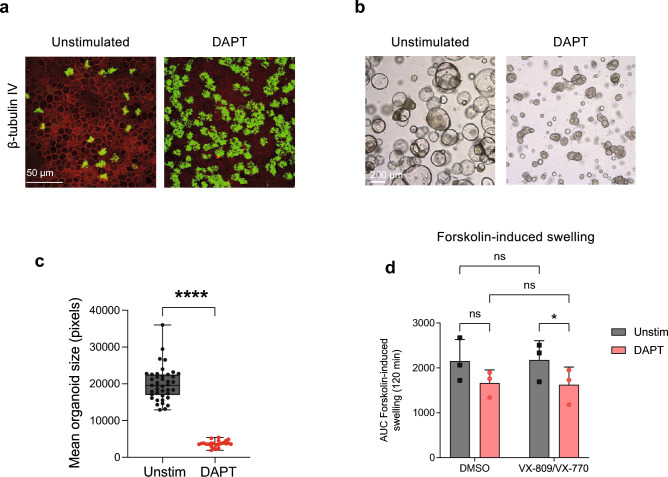
The nasal and bronchial epithelium are unified parts of the respiratory tract that are affected in the monogenic disorder cystic fibrosis (CF). Recent studies have uncovered that nasal and bronchial tissues exhibit intrinsic variability, including differences in mucociliary cell composition and expression of unique transcriptional regulatory proteins which relate to germ layer origin. In the present study, we explored whether intrinsic differences between nasal and bronchial epithelial cells persist in cell cultures and affect epithelial cell functioning in CF. Comparison of air-liquid interface (ALI) differentiated epithelial cells from subjects with CF revealed distinct mucociliary differentiation states of nasal and bronchial cultures. Moreover, using RNA sequencing we identified cell type-specific signature transcription factors in differentiated nasal and bronchial epithelial cells, some of which were already poised for expression in basal progenitor cells as evidenced by ATAC sequencing. Analysis of differentiated nasal and bronchial epithelial 3D organoids revealed distinct capacities for fluid secretion, which was linked to differences in ciliated cell differentiation. In conclusion, we show that unique phenotypical and functional features of nasal and bronchial epithelial cells persist in cell culture models, which can be further used to investigate the effects of tissue-specific features on upper and lower respiratory disease development in CF.


Conflict of interest statement

J.M.B. has a patent granted (10006904) related to CFTR function measurements in organoids and received personal fees from HUB/Royal Dutch academy of sciences, during the conduct of the study; nonfinancial support from Vertex Pharmaceuticals and personal fees and nonfinancial support from Proteostasis Therapeutics, outside the submitted work. C.K.v.d.E. reports grants from GSK, Nutricia, TEVA, Gilead, Vertex, ProQR, Proteostasis, Galapagos NV, Eloxx pharmaceuticals, outside the submitted work; In addition, C.K.v.d.E. has a patent related to CFTR function measurements in organoids (10006904) with royalties paid. The other authors declare no potential conflict of interest.

Figures

Figure 1
Figure 1
Nasal and bronchial epithelial cell cultures from individuals with CF exhibit unique mucociliary differentiation states. (a) Representative IF staining of the basal cell markers p63 (red), KRT5 (green), and ITGA6 (cyan) in undifferentiated CF nasal and bronchial epithelial cells (F508del/F508del). DAPI (blue) was used to stain nuclei. Scale bar equals 100 µm. (b) Representative IF staining (left panel) and quantification (right panel) of β-tubulin IV (ciliated cells) and MUC5AC (goblet cells) in paired ALI-differentiated nasal and bronchial cells of CF subjects (n = 4 independent donors; all F508del/F508del). Cultures were differentiated for 18 days. Epithelial markers are shown in green, phalloidin (red) was used as actin cytoskeleton staining. Scale bar equals 50 µm. For quantification, 3 microscopic fields were analysed per well. (c) mRNA expression of the cell type-specific transcriptional factors FOXJ1 (ciliated cells) and SPDEF (goblet cells) in paired ALI-differentiated nasal and bronchial epithelial cells of CF subjects (n = 5 independent donors; F508del/F508del, F508del/F508del, F508del/A455E, F508del/A455E, F508del/1717-1G>A). (d) TEER measurements of paired ALI-differentiated nasal and bronchial epithelial cells of CF subjects (n = 5 independent donors; F508del/F508del, F508del/F508del, F508del/A455E, F508del/A455E, F508del/1717-1G>A). Data is shown as mean ± SD. Analysis of differences was conducted using paired t-tests (bd). ns non-significant, *p < 0.05, **p < 0.01.
Figure 2
Figure 2
Transcriptome analysis of nasal and bronchial epithelial cells reveals unique core gene signatures. (a) PCA of transcriptomic analysis of paired ALI-differentiated nasal (red) and bronchial (blue) cells of CF subjects (n = 5 independent donors; F508del/F508del, F508del/F508del, F508del/A455E, F508del/A455E, F508del/1717-1G>A). A–E indicate individual donors. (b) Volcano plot showing DEGs (defined as adjusted p value < 0.01 and fold change > 1.5) between paired ALI-differentiated nasal and bronchial epithelial cells of CF subjects (n = 5 independent donors; F508del/F508del, F508del/F508del, F508del/A455E, F508del/A455E, F508del/1717-1G>A). Red dots indicate enriched genes in nasal epithelial cells and blue dots indicate enriched genes in bronchial epithelial cells. (c) Heatmap showing the 20 most significantly enriched genes in nasal (red) and bronchial (blue) epithelial cells. Z scores of normalized expression values are depicted. (d) Gene set enrichment analysis showing the top 15 of enriched GO terms in ALI-differentiated nasal and bronchial epithelial cells (n = 5 independent donors; F508del/F508del, F508del/F508del, F508del/A455E, F508del/A455E, F508del/1717-1G>A). Color indicates the degree of significance and dot size indicates gene count. Gene ratio explains the fraction of DEG’s in the specific GO term. (e) Normalized counts of ciliated cell-related genes (upper panel), goblet cell-related genes (middle planel) and distal airway secretory cell (club cell)-related genes (lower panel) in paired ALI-differentiated nasal (red) and bronchial (blue) cells of CF subjects (n = 5 independent donors; F508del/F508del, F508del/F508del, F508del/A455E, F508del/A455E, F508del/1717-1G>A). (f) Heatmap showing gene expression in paired ALI-differentiated nasal (red) and bronchial (blue) cells of CF subjects (n = 5 independent donors; F508del/F508del, F508del/F508del, F508del/A455E, F508del/A455E, F508del/1717-1G>A) of nasal- and trachea/bronchial-enriched genes based on scRNA-seq by Deprez et al..
Figure 3
Figure 3
Identification of nasal and bronchial cell-specific signature TFs. (a) Normalized counts of RNA-seq analysis from nasal- and bronchial-specific TFs in paired ALI-differentiated nasal (red) and bronchial (blue) cells of CF subjects (n = 5 independent donors; F508del/F508del, F508del/F508del, F508del/A455E, F508del/A455E, F508del/1717-1G>A). (b) Representative IF staining of paired undifferentiated nasal and bronchial epithelial cells of an individual with CF (F508del/F508del). Cells were stained for the bronchial epithelial markers NKX2-1 and FOXA2 and the nasal epithelial markers PAX6 and SIX3. Scale bar equals 100 µm.
Figure 4
Figure 4
Unique epigenomic features of nasal and bronchial basal progenitor cells. (a) Representative genome browser shots of ATAC-seq peaks across the genes IRX2, TBX3, PAX6 and FOXG1. Five paired nasal and bronchial cell cultures were analyzed (4 donors carrying the F508del/F508del mutation, 1 donor F508del/A455E). One bronchial sample was omitted for further analysis due to insufficient sample quality. (b) Quantified ATAC-seq signals of selected genes in the different donors (n = 4–5 independent donors). (c) Selection of enriched motif matrices and corresponding TF in nasal and bronchial epithelial cells, predicted by the HOMER motif analysis. Data is shown as mean ± SD.
Figure 5
Figure 5
ALI culture-derived nasal and bronchial organoids display distinctive morphological features. (a) Schematic representation showing how ALI-differentiated airway epithelia are converted into organoids to study organoid size and FIS. (b) Representative IF staining of paired nasal and bronchial airway organoids of a CF subject (F508del/2183AA>G), showing β-tubulin IV (ciliated cells) and MUC5AC (goblet cells) staining (in green). Phalloidin (red) was used as actin cytoskeleton staining and DAPI (blue) to stain nuclei. Scale bar equals 50 µm. (c) Representative brightfield images of paired CF nasal and bronchial airway organoids (F508del/F508del) at day 1 and 4 after plating of epithelial fragments, showing lumen formation in nasal but not in bronchial organoids. Scale bar equals 2500 µm. (d) Quantification of mean organoid size (pixels) of paired CF nasal and bronchial airway organoids at day 1 and 4 after plating of epithelial fragments (n = 3 wells from 1 donor; F508del/F508del). Data is shown as mean ± SD. Analysis of differences was conducted with a two-way ANOVA with Tukey post-hoc test (d). ns non-significant, **p < 0.01, ****p < 0.0001.
Figure 6
Figure 6
Differences in CFTR-independent forskolin-induced fluid secretion between nasal and bronchial organoids. (a) Representative confocal images of calcein green-stained nasal and bronchial airway organoids from HC and CF (F508del/2183AA>G) at t = 0 and t = 120 min after stimulation with forskolin (5 µM). Scale bar equals 500 μm. (b) Nasal and bronchial airway organoids from HC (n = 3 independent donors) and CF (n = 3 independent donors; F508del/F508del, F508del/F508del, F508del/1717-1G>A) subjects were stimulated with forskolin (5 µM) and organoid swelling was measured in time, demonstrating differences in fluid secretion. Results are depicted as percentage increase in normalized area in time. (c) Nasal and bronchial airway organoids from HC (n = 3 independent donors) and CF (n = 3 independent donors; F508del/F508del, F508del/F508del, F508del/1717-1G>A) subjects were stimulated with forskolin (5 µM) and organoid swelling was measured in time, demonstrating differences in fluid secretion. Results are depicted as area under the curve (AUC) plots (t = 120 min). (d) Paired nasal and bronchial airway organoids from CF subjects with a F508del/F508del genotype (n = 2 independent donors) were pre-treated with VX-809 (10 µM) for 48 h, and subsequently acute stimulated with forskolin (5 µM) together with VX-770 (10 µM) or vehicle. Airway organoid swelling is depicted as AUC plots (t = 120 min). Data is shown as mean ± SD. Swelling assays were conducted in quadruplicates for each condition. Analysis of differences was conducted with a two-way ANOVA with Bonferroni post-hoc test (c,d). ****p < 0.0001.
Figure 7
Figure 7
Intrinsic fluid secretion in nasal organoids is reduced by ciliated cell enrichment. (a) Representative IF staining of β-tubulin IV (ciliated cells) in nasal cells cultured with or without the γ-secretase inhibitor DAPT (20 µM) from an individual with CF (F508del/F508del). Cultures were differentiated for 18 days. Epithelial markers are shown in green, phalloidin (red) was used as actin cytoskeleton staining. Scale bar equals 50 µm. (b) Representative brightfield images of nasal organoids treated with or without the γ-secretase inhibitor DAPT (20 µM), from an individual with CF (F508del/F508del), 6 days after plating. Scale bar equals 200 µm. (c) Quantification of mean organoid size of nasal organoids treated with or without the γ-secretase inhibitor DAPT (20 µM) from an individual with CF (F508del/F508del) (n = 24/41 wells). (d) Nasal organoid swelling assay with organoids from individuals with CF (n = 3 independent donors; all F508del/F508del), treated with or without the γ-secretase inhibitor DAPT (20 µM). Organoids were stimulated with forskolin (5 µM) alone, or with forskolin (5 µM) together with VX-770 (10 µM) and pre-treatment with VX-809 (10 µM) for 48 h. Results are depicted as AUC plots (t = 120 min). Data is shown as mean ± SD. Swelling assays were conducted in quadruplicates for each condition. Analysis of differences was conducted with an unpaired t-test (c) or two-way ANOVA with Tukey post-hoc test (d). ns non-significant, *p < 0.05, ****p < 0.0001.

References

    1. Som PM, Naidich TP. Illustrated review of the embryology and development of the facial region, part 1: Early face and lateral nasal cavities. AJNR Am. J. Neuroradiol. 2013;34:2233–2240. doi: 10.3174/ajnr.A3415. - DOI - PMC - PubMed
    1. Herriges M, Morrisey EE. Lung development: Orchestrating the generation and regeneration of a complex organ. Development. 2014;141:502–513. doi: 10.1242/dev.098186. - DOI - PMC - PubMed
    1. Widdicombe JH. Early studies on the surface epithelium of mammalian airways. Am. J. Physiol. Lung Cell. Mol. Physiol. 2019;317:L486–L495. doi: 10.1152/ajplung.00240.2019. - DOI - PubMed
    1. Kojima T, et al. Regulation of tight junctions in upper airway epithelium. Biomed Res. Int. 2013;2013:947072. doi: 10.1155/2013/947072. - DOI - PMC - PubMed
    1. Knowles MR, Boucher RC. Mucus clearance as a primary innate defense mechanism for mammalian airways. J. Clin. Investig. 2002;109:571–577. doi: 10.1172/JCI0215217. - DOI - PMC - PubMed

Publication types

MeSH terms

Substances