. 2023 Oct 30;14(1):6902.
doi: 10.1038/s41467-023-42558-y.

Isoform-resolved transcriptome of the human preimplantation embryo

Affiliations

Isoform-resolved transcriptome of the human preimplantation embryo

Denis Torre et al. Nat Commun. .

Abstract

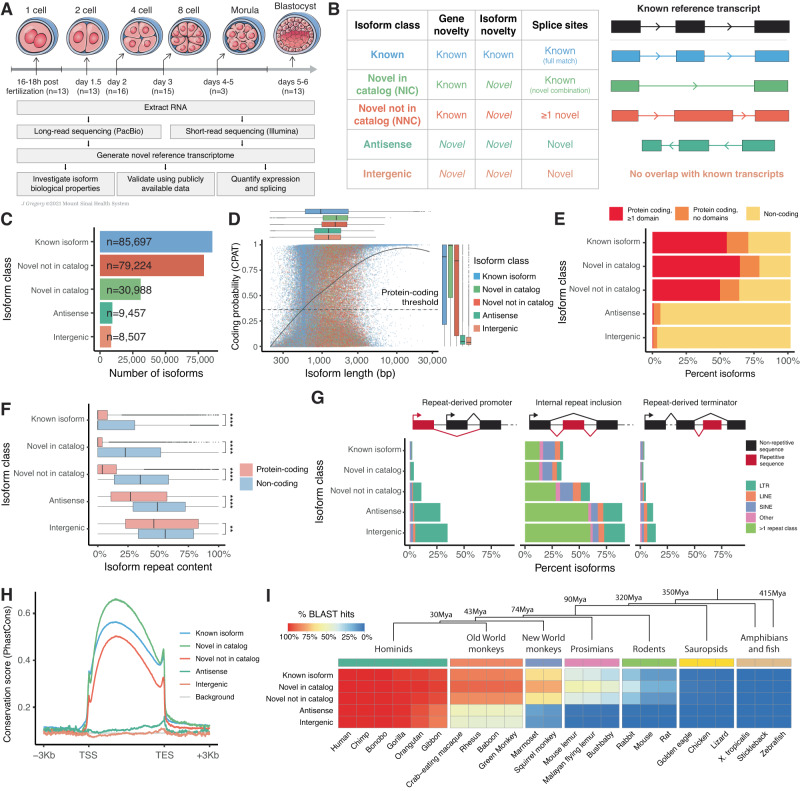
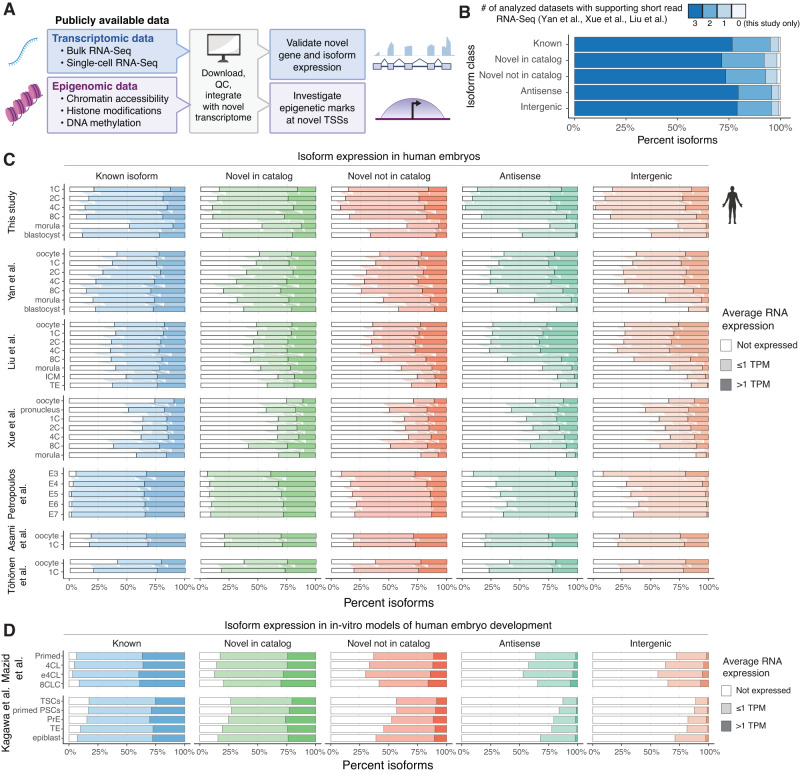
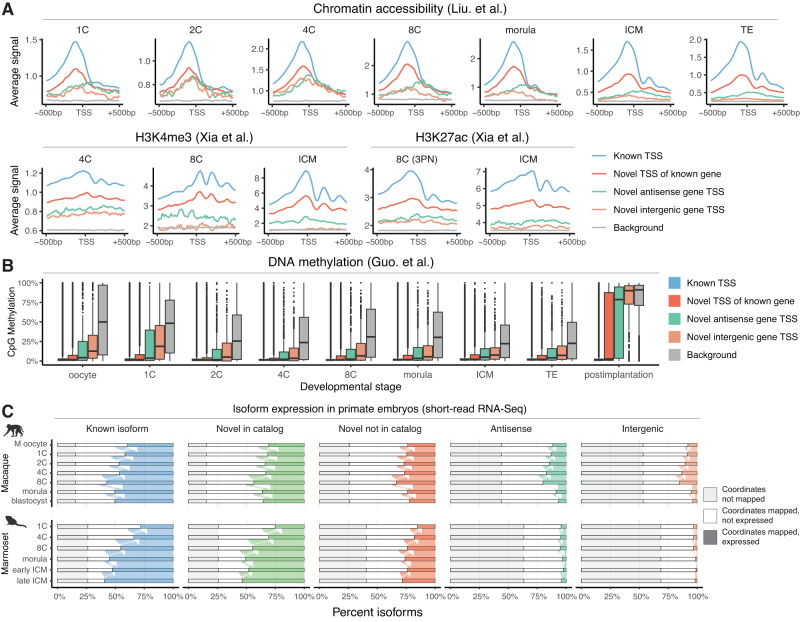
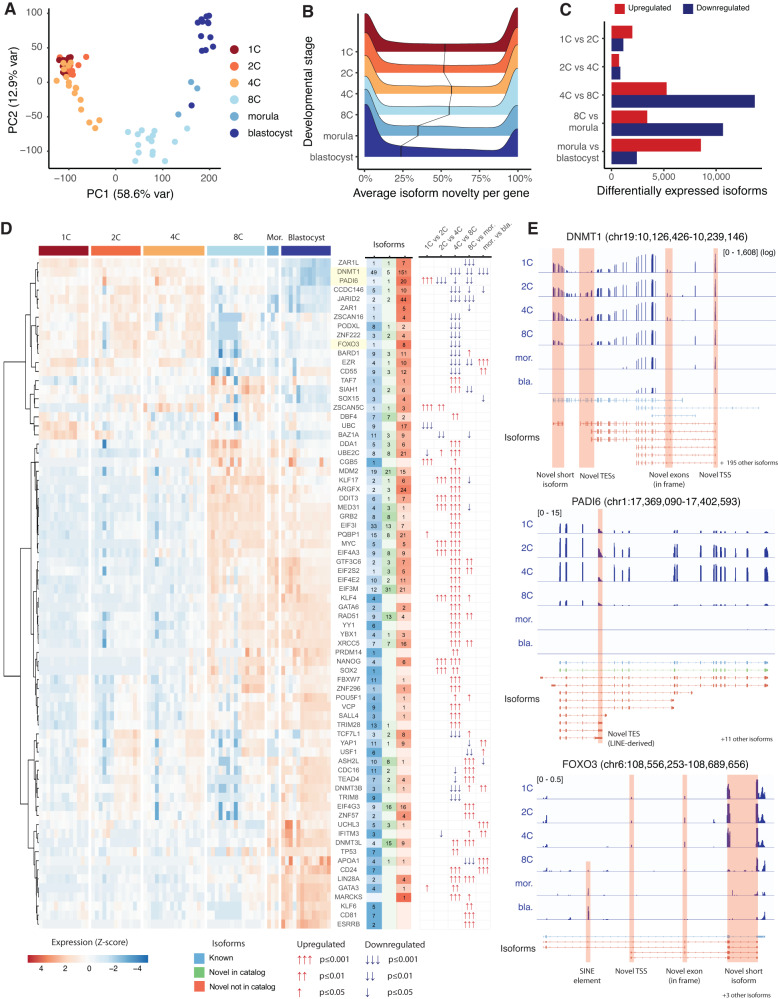
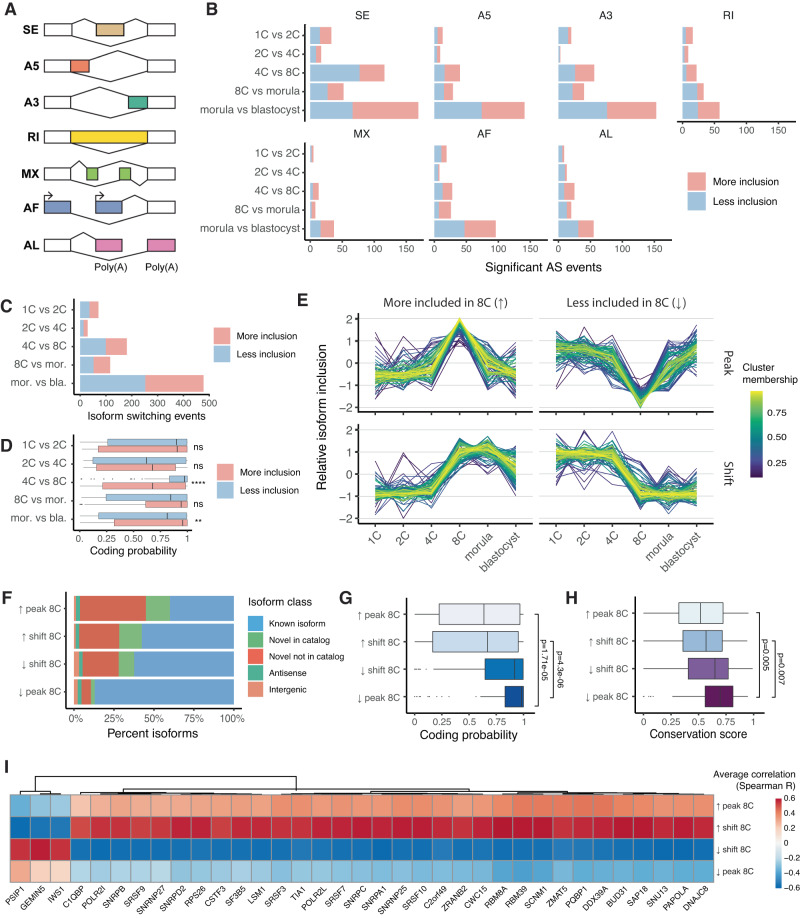
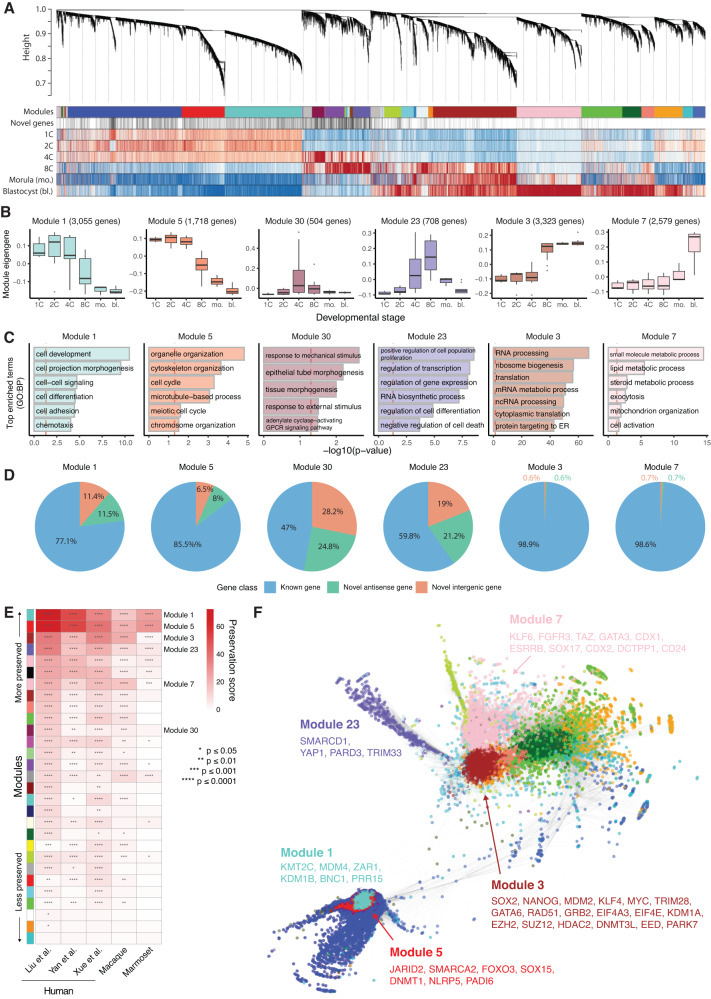
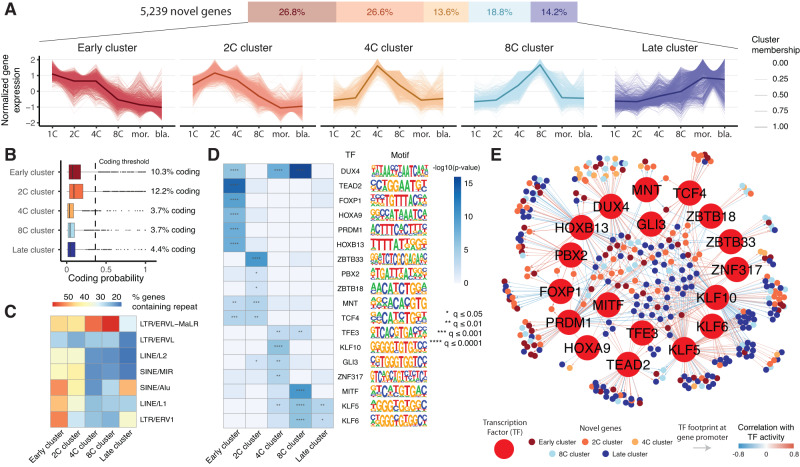
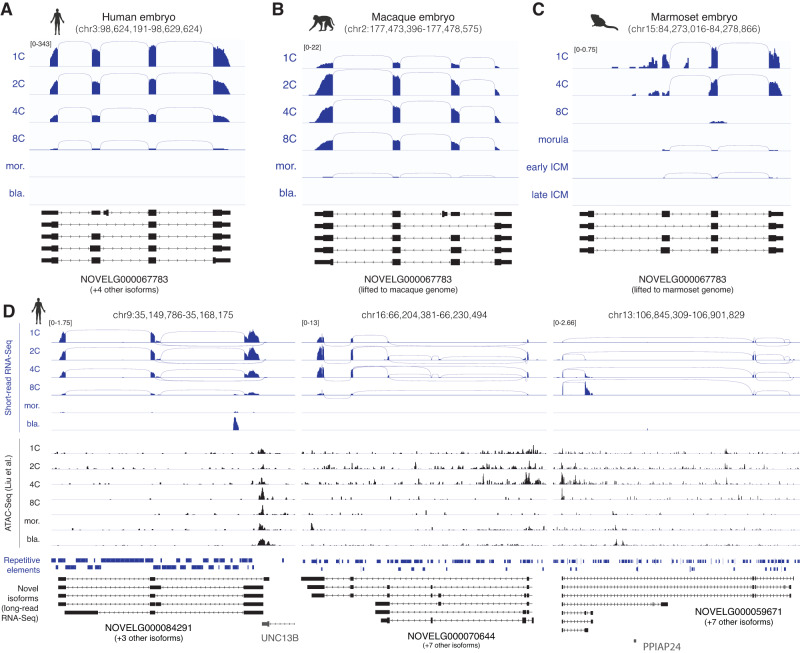
Human preimplantation development involves extensive remodeling of RNA expression and splicing. However, its transcriptome has been compiled using short-read sequencing data, which fails to capture most full-length mRNAs. Here, we generate an isoform-resolved transcriptome of early human development by performing long- and short-read RNA sequencing on 73 embryos spanning the zygote to blastocyst stages. We identify 110,212 unannotated isoforms transcribed from known genes, including highly conserved protein-coding loci and key developmental regulators. We further identify 17,964 isoforms from 5,239 unannotated genes, which are largely non-coding, primate-specific, and highly associated with transposable elements. These isoforms are widely supported by the integration of published multi-omics datasets, including single-cell 8CLC and blastoid studies. Alternative splicing and gene co-expression network analyses further reveal that embryonic genome activation is associated with splicing disruption and transient upregulation of gene modules. Together, these findings show that the human embryo transcriptome is far more complex than currently known, and will act as a valuable resource to empower future studies exploring development.


Conflict of interest statement

R.P.S. is an equity holder and paid consultant to GeneDx. However, the research was solely conducted by MSSM and TASMC facilities. The remaining authors declare no competing interests.

Figures

Fig. 1
Fig. 1. Generation and functional characterization of the isoform-resolved human embryo transcriptome.
A Overview of the embryonic developmental stages and the sequencing approach (illustration by Jill Gregory). B Schematic representation of the isoform structural classes defined from long-read RNA-Seq data. C Number of isoforms in the novel human embryo transcriptome for each structural class. D Scatter plot displaying isoform length and predicted coding probability for each isoform, colored by isoform class. Residual boxplots display the distributions of isoform length and coding probability along the X and Y axes respectively. E Bar plot displaying the percentage of isoforms in each class based on their predicted protein-coding status, and the presence of known protein domains in the encoded peptide. F Box plots displaying the relative repeat content of isoforms in each structural class, grouped by predicted protein-coding status. For known isoforms, n = 59,517 protein-coding and n = 26,180 non-coding; novel in catalog, n = 24,018 protein-coding and n = 6970 non-coding; novel not in catalog, n = 49,826 protein-coding and n = 29,398 non-coding; antisense, n = 550 protein-coding and n = 8907 non-coding; intergenic, n = 289 protein-coding and n = 8218 non-coding. p < 2x10¹⁶ for known, novel in catalog, novel not in catalong and antisense isoforms, p = 0.0062 for intergenic isoforms. P-values were calculated using unpaired two-sided Wilcoxon Rank Sum test, Benjamini-Hochberg correction. G Bar plots displaying the relative abundance of repetitive elements acting as alternative promoters, internal exon elements, or terminators for each isoform class, grouped by repeat class. H Average base-wise conservation scores (PhastCons100way) across exons and ±3 kb of each isoform, grouped by isoform class. I Evolutionary conservation of transcripts across multiple vertebrates, in relation to the phylogenetic tree. The heatmap displays the percentage of conserved isoforms in each structural class compared to different vertebrate genomes, determined using BLAST. The phylogenetic tree displays evolutionary divergence of selected vertebrate groups from hominids. For the box plot in F, box limits extend from the 25th to 75th percentile, while the middle line represents the median. Whiskers extend to the largest value no further than 1.5 times the inter-quartile range (IQR) from each box hinge. Points beyond the whiskers are outliers. Source data are provided as a Source Data file.
Fig. 2
Fig. 2. Novel isoforms and genes are broadly expressed in early preimplantation stages.
A Overview of the data types integrated and approach to validate the novel isoform-resolved transcriptome. B Percentage of isoforms in each class, grouped by the number of integrated short-read RNA-Seq datasets in which they are expressed (Yan et al., Liu et al., Xue et al.). C Percentage of isoforms in each developmental stage, grouped by isoform class and average expression level across short-read RNA-Seq datasets profiling human preimplantation embryos and oocytes (TPM – Transcript Per Million). D As above, but displaying data from single-cell short-read RNA-Seq datasets (SmartSeq2) profiling in-vitro models of human preimplantation development (8CLCs and blastoids). Source data are provided as a Source Data file. Icons in Fig. 2A, C were created with BioRender.com.
Fig. 3
Fig. 3. Novel isoforms are supported by orthogonal epigenomic and non-human primate embryo transcriptomic data.
A Integration of public datasets with the newly identified transcriptome demonstrate epigenetic marks for active transcription across developmental stages. Data are normalized ATAC-Seq and CUT&RUN signal within ±500 bp of TSSs (n = 78,217 known TSSs, 21,016 novel TSSs of known genes, 3589 novel antisense gene TSSs, 3814 novel intergenic gene TSSs, 106,636 background sequences). B Distribution of CpG methylation at TSSs from the novel transcriptome across developmental stages (percentages within ±500 bp of each site, TSSs defined in A). C Percentage of isoforms in each class, grouped according to their mapping status to the macaque and marmoset genomes and their expression in corresponding preimplantation short-read RNA-Seq datasets. For the box plot in B, box limits extend from the 25th to 75th percentile, while the middle line represents the median. Whiskers extend to the largest value no further than 1.5 times the inter-quartile range (IQR) from each box hinge. Points beyond the whiskers are outliers. Icons in C were created with BioRender.com. Source data are provided as a Source Data file.
Fig. 4
Fig. 4. Novel isoform diversity and classifications are associated with known developmental genes.
A PCA of gene expression across short-read RNA-Seq samples, colored by developmental stage. B Percentage of short RNA-Seq reads mapping to novel isoforms for each gene expressed in each developmental stage. C Number of significantly differentially expressed isoforms at each developmental stage transition. D Heatmap of expression levels for selected developmental genes, including the classes of isoforms found for each gene (known, NIC, NNC). The statistical significance and direction of differential gene expression across developmental stage transitions are presented with arrows. E Detailed dynamic expression of selected known and novel isoforms of three representative developmental genes: DNMT1, PADI6 and FOXO3. Source data are provided as a Source Data file.
Fig. 5
Fig. 5. Alternative splicing induces ORF disruption and novel isoform inclusion during embryonic genome activation.
A Schematic representation of the seven types of AS events analyzed: skipped exon (SE), alternative 5’ splice site (A5), alternative 3’ splice site (A3), retained intron (RI), mutually exclusive exons (MX), alternative first exon (AF), and alternative last exon (AL). B Number of significant AS events at each developmental stage transition. C Number of significant isoform switching events at each developmental stage transition. D Predicted protein-coding probability of isoforms undergoing significant isoform switches at each developmental stage transition, grouped by direction of inclusion. (1C vs 2C, p = 0.94; 2C vs 4C, p = 0.83; 4C vs 8C, p = 4.3e−06; 8C vs morula, p = 0.28; morula vs blastocyst, p = 0.0021, unpaired two-sided Wilcoxon Rank Sum test, Benjamini-Hochberg correction; for 1C vs 2C, n = 35 more included and n = 36 less included isoforms; for 2C vs 4C, n = 16 more included and n = 13 less included isoforms; for 4C vs 8C, n = 82 more included and n = 99 less included isoforms; for 8C vs morula, n = 64 more included and n = 52 less included isoforms; for morula vs blastocyst, n = 226 more included and n = 252 less included isoforms). E Relative inclusion levels of isoforms undergoing significant switching events at the 8C stage. Four major clusters are identified, based on the direction of inclusion (more or less included at the 8C stage) and temporal inclusion dynamics (transient peak or sustained shift). F Structural classes of the isoform clusters defined in E. G, H Coding probabilities and evolutionary conservation scores for the isoform clusters defined in E. (unpaired two-sided Wilcoxon Rank Sum test, Benjamini-Hochberg correction; cluster sizes: n = 80 for positive peak at 8C; n = 92 for positive shift at 8C, n = 93 for negative shift at 8C, n = 85 for negative peak at 8C. Box plot colors are proportional to median values for each corresponding box). I Heatmap displaying average correlation (Spearman R) between splicing factor expression and isoform inclusion levels for each isoform cluster defined in E. Displayed are the top 35 splicing factors as ranked by highest absolute correlation values. For the box plots in D, G, H, box limits extend from the 25th to 75th percentile, while the middle line represents the median. Whiskers extend to the largest value no further than 1.5 times the inter-quartile range (IQR) from each box hinge. Points beyond the whiskers are outliers. Source data are provided as a Source Data file.
Fig. 6
Fig. 6. Novel genes are key components of early expressed, evolutionarily conserved modules of co-expressed developmental genes.
A Hierarchical clustering tree displaying results of the gene co-expression network analysis. Modules of genes co-expressed across developmental stages are displayed as color bars. Novel genes are highlighted below. Normalized gene expression across stages is also displayed (red - highest relative expression, blue - lowest expression). B Representative expression profiles (module eigengenes) of selected gene modules characterizing specific developmental stages (sample sizes for each stage shown in Fig. 1A). C Gene Ontology: Biological Process terms enriched in the selected gene modules shown in B. D Percentage of each gene class in the selected modules. E Heatmap of module preservation scores in independent, publicly available short-read RNA-Seq datasets of human and non-human primate embryos (scores and p-values calculated using the WGCNA modulePreservation function, p-values adjusted using Bonferroni method). Module colors (from A) are shown on the left. F Network diagram displaying connected genes from different modules (represented as different colors, from A) of the gene co-expression network. A selection of known developmental genes is highlighted for five modules. For the box plot in B, box limits extend from the 25th to 75th percentile, while the middle line represents the median. Whiskers extend to the largest value no further than 1.5 times the inter-quartile range (IQR) from each box hinge. Points beyond the whiskers are outliers. Source data are provided as a Source Data file.
Fig. 7
Fig. 7. Novel genes have distinct expression patterns, predicted biological properties, and transcriptional regulators.
A Novel genes separate into five clusters with distinct expression patterns across human preimplantation development (n = 1402 genes in early cluster, 1391 genes in 2C cluster, 712 genes in 4C cluster, 987 genes in 8C cluster, 746 genes in late cluster). B Predicted coding probability for novel genes in each cluster defined in A. C Heatmap displaying the percentage of novel genes in each cluster containing distinct classes of human retrotransposons. D Heatmap displaying predicted transcription factor regulators of each novel gene cluster, including their DNA binding motifs (p-values calculated using HOMER findMotifsGenome.pl, q-values adjusted using Benjamini-Hochberg method). E Network diagram displaying predicted TFs-novel target gene pairs, as determined by integration of ATAC-Seq footprinting and inferred TF activity-gene expression correlation. For the box plot in B, box limits extend from the 25th to 75th percentile, while the middle line represents the median. Whiskers extend to the largest value no further than 1.5 times the inter-quartile range (IQR) from each box hinge. Points beyond the whiskers are outliers. Source data are provided as a Source Data file.
Fig. 8
Fig. 8. Examples of novel genes expressed in human and non-human primate embryos.
A Short-read RNA-Seq expression across developmental stages (displayed in blue, RPKM normalization) and long-read-defined isoforms for evolutionarily conserved novel human gene NOVELG000067783. B, C Short-read RNA-Seq expression from macaque and marmoset preimplantation embryos (data from Wang et al. and Boroviak et al., respectively), and long-read-defined isoforms for novel human gene NOVELG000067783. Novel isoform annotations from the human genome (hg38) were lifted to the corresponding locations in the respective primate genomes (Mmul10 for macaque, calJac4 for marmoset) using liftOver. D Short-read RNA-Seq expression, long-read-defined isoforms and matching chromatin accessibility (from Liu et al.) for three novel human-specific genes. Also shown are repetitive genomic elements from RepeatMasker. Source data are provided as a Source Data file. Icons in AD were created with BioRender.com.

References

    1. Huch M, Koo BK. Modeling mouse and human development using organoid cultures. Development. 2015;142:3113–3125. doi: 10.1242/dev.118570. - DOI - PubMed
    1. Steiner D, et al. Derivation, propagation and controlled differentiation of human embryonic stem cells in suspension. Nat Biotechnol. 2010;28:361–364. doi: 10.1038/nbt.1616. - DOI - PubMed
    1. Itskovitz-Eldor J, et al. Differentiation of human embryonic stem cells into embryoid bodies compromising the three embryonic germ layers. Mol. Med. 2000;6:88–95. doi: 10.1007/BF03401776. - DOI - PMC - PubMed
    1. Aanes H, Collas P, Alestrom P. Transcriptome dynamics and diversity in the early zebrafish embryo. Brief Funct. Genomics. 2014;13:95–105. doi: 10.1093/bfgp/elt049. - DOI - PubMed
    1. Shahbazi MN. Mechanisms of human embryo development: from cell fate to tissue shape and back. Development. 2020;147:14. doi: 10.1242/dev.190629. - DOI - PMC - PubMed

Publication types

Substances