. 2023 Oct 30;14(1):6911.
doi: 10.1038/s41467-023-42570-2.

Microglia-mediated demyelination protects against CD8+ T cell-driven axon degeneration in mice carrying PLP defects

Affiliations

Microglia-mediated demyelination protects against CD8+ T cell-driven axon degeneration in mice carrying PLP defects

Janos Groh et al. Nat Commun. .

Abstract

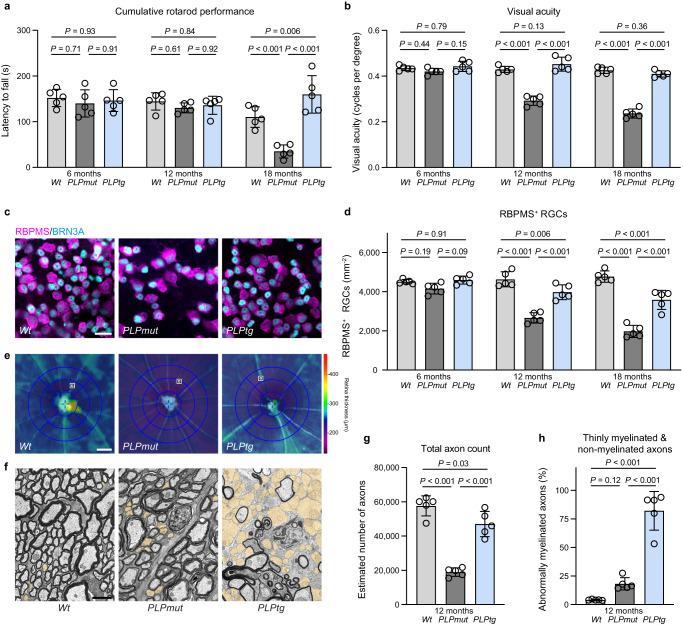
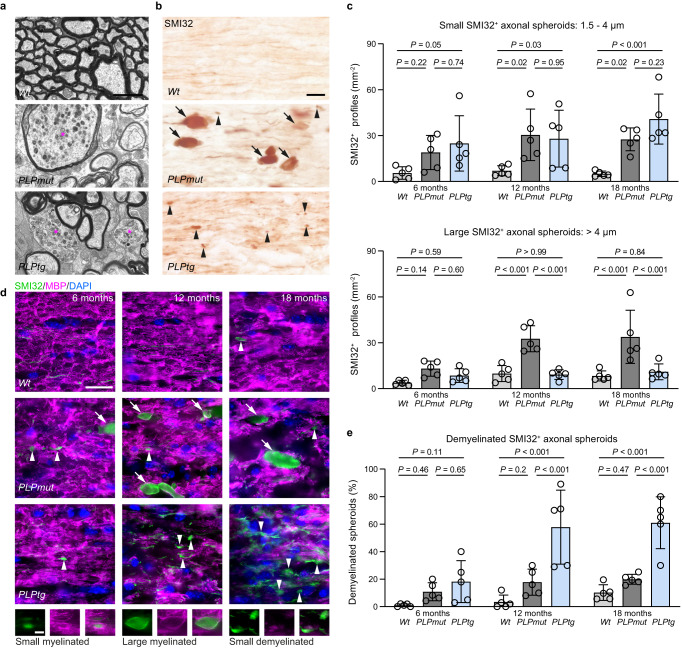
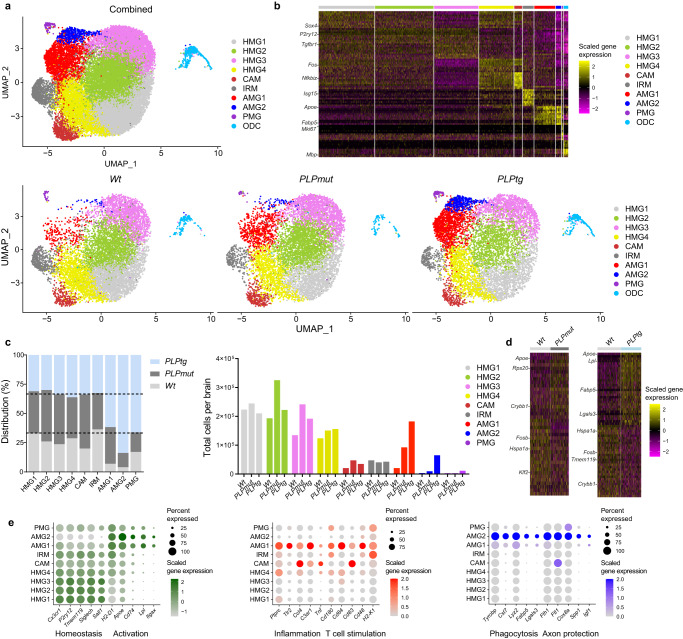
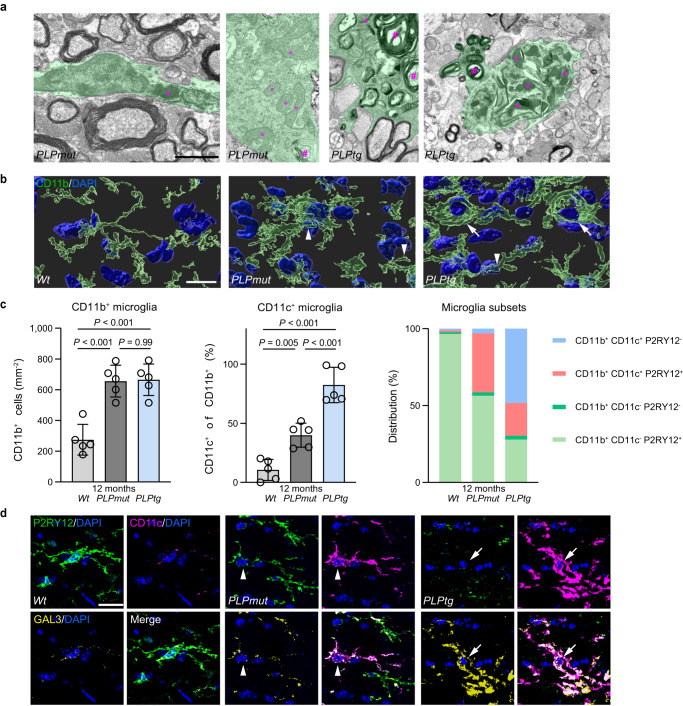
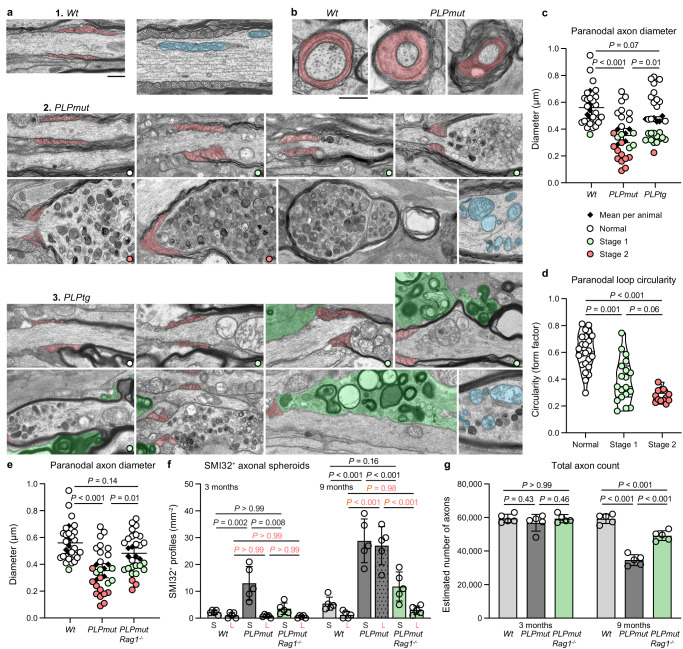
Axon degeneration and functional decline in myelin diseases are often attributed to loss of myelin but their relation is not fully understood. Perturbed myelinating glia can instigate chronic neuroinflammation and contribute to demyelination and axonal damage. Here we study mice with distinct defects in the proteolipid protein 1 gene that develop axonal damage which is driven by cytotoxic T cells targeting myelinating oligodendrocytes. We show that persistent ensheathment with perturbed myelin poses a risk for axon degeneration, neuron loss, and behavioral decline. We demonstrate that CD8+ T cell-driven axonal damage is less likely to progress towards degeneration when axons are efficiently demyelinated by activated microglia. Mechanistically, we show that cytotoxic T cell effector molecules induce cytoskeletal alterations within myelinating glia and aberrant actomyosin constriction of axons at paranodal domains. Our study identifies detrimental axon-glia-immune interactions which promote neurodegeneration and possible therapeutic targets for disorders associated with myelin defects and neuroinflammation.


Conflict of interest statement

The authors declare no competing interests.

Figures

Fig. 1
Fig. 1. Neurodegeneration and myelin loss correlate inversely in mice with distinct myelin defects.
a Accelerating rotarod analysis of motor performance in Wt, PLPmut, and PLPtg mice (each circle represents the mean value of five consecutive runs of one mouse) at different ages. Motor performance is significantly impaired in PLPmut but not PLPtg mice at advanced disease stage (n = 5 mice per group, two-way ANOVA with Tukey’s multiple comparisons test, F (2, 36) = 14.88, P < 0.001). b Automated optokinetic response analysis of visual acuity (cycles per degree) shows a progressive decline of visual acuity in PLPmut but not PLPtg mice (each circle represents the mean value of one mouse, n = 5 mice per group, two-way ANOVA with Tukey’s multiple comparisons test, F (2, 36) = 195.0, P = 0.001). c Immunofluorescence detection and (d) quantification of RBPMS+BRN3A+ RGCs in the retinae of Wt, PLPmut, and PLPtg mice (n = 5) mice per group, two-way ANOVA with Tukey’s multiple comparisons test, F (2, 36) = 112.3, P < 0.001. Scale bar, 20 μm. e Representative interpolated thickness maps from retinal volume scans of 12-month-old Wt, PLPmut, and PLPtg mice. Scale bar corresponds to 50 μm of subtended retina. f Representative electron micrographs of optic nerve cross-sections from 12-month-old Wt, PLPmut, and PLPtg mice (thinly and non-myelinated axons are indicated in yellow pseudocolor). Scale bar, 2 μm. g Electron microscopy-based estimation of total axonal numbers in the optic nerves. Axon loss is much milder in PLPtg than in PLPmut mice (n = 5 mice per group, one-way ANOVA with Tukey’s multiple comparisons test, F (2, 12) = 63.67, P < 0.001). h Quantification of thinly myelinated (g-ratio ≥ 0.85) and non-myelinated axons in Wt, PLPmut, and PLPtg mice (n = 5 mice per group, one-way ANOVA with Tukey’s multiple comparisons test, F (2, 12) = 81.47, P < 0.001). Data are presented as the mean ± s.d.
Fig. 2
Fig. 2. Axonal spheroids show a similar initial formation but a different progression in mice with distinct PLP defects.
a Representative electron micrographs of optic nerve cross-sections from 12-month-old Wt, PLPmut, and PLPtg mice demonstrate differences in size and myelination state of axonal spheroids (asterisks). Scale bar, 2 μm. b Immunohistochemical visualization of SMI32+ axonal spheroids in the optic nerves of 12-month-old Wt, PLPmut, and PLPtg mice. Arrowheads indicate small axonal spheroids (diameter 1.5–4 µm) and arrows indicate large axonal spheroids (diameter >4 µm). Scale bar, 20 μm. c Quantification of small (top) and large (bottom) axonal spheroids at different ages (each circle represents the mean value of one mouse). Small spheroids are similarly frequent in PLPmut and PLPtg mice but become large with disease progression only in PLPmut mice (n = 5 mice per group, two-way ANOVA with Tukey’s multiple comparisons test, Small: F (2, 36) = 16.71, P < 0.001, Large: F (2, 36) = 30.04, P < 0.001). d Immunofluorescence detection of SMI32+ axonal spheroids (small: arrowheads, large: arrows) and MBP in the optic nerves of Wt, PLPmut, and PLPtg mice at different ages. Scale bar, 20 μm. Bottom images show examples of spheroids of different sizes and myelination states with split channels at higher magnification. Scale bar, 5 µm. e Quantification of the myelination state of SMI32+ axonal spheroids demonstrates their progressive demyelination in PLPtg but not PLPmut mice (n = 5 mice per group, two-way ANOVA with Tukey’s multiple comparisons test, F (2, 36) = 39.45, P < 0.001). Data are presented as the mean ± s.d.
Fig. 3
Fig. 3. scRNA-seq reveals heterogeneous neural-immune interactions in mice with distinct myelin defects.
a UMAP visualization of CD45O1+ mature oligodendrocytes and CD45lowSiglec-H+ microglia freshly sorted from adult (10-month-old) Wt, PLPmut, and PLPtg (n = 3 mice per group) mouse brains and analyzed by scRNA-seq. Combined (top, 26,308 cells) and separate (bottom) visualization of cells from Wt (9,484 cells), PLPmut (8,405 cells), and PLPtg (8,419 cells) brains are displayed. b Heatmap of top 10 cluster-specific genes. The colour scale is based on a z-score distribution from −2 (purple) to 2 (yellow). c Contribution of the samples to each microglia cluster is displayed in percent (left) and absolute numbers extrapolated to total cells per brain (right). AMG1 is enriched in both myelin mutants and AMG2 mostly in PLPtg mice. d Heatmaps of top 30 differentially expressed genes comparing microglia isolated from Wt and PLPmut (left) or Wt and PLPtg (right) brains across all clusters as identified in panel (a). e Dot plot expression visualization of selected genes implicated in microglial homeostasis and activation (left), inflammation and T cell stimulation (middle), or phagocytosis and axon protection (right) for microglia clusters as annotated in panel a. The color scales are based on z-score distributions from −1 (lightgrey) to 2 (green) or 0 (lightgrey) to 2 (red, blue). HMG, homeostatic microglia; CAM, capillary-associated microglia; IRM, interferon-responsive microglia; AMG, activated microglia; PMG, proliferating microglia; ODC, oligodendrocytes. Complete lists of cluster-specific markers and differentially expressed genes can be found in Supplementary Data 1.
Fig. 4
Fig. 4. Myelin phagocytosis by activated microglia mediates demyelination in mice with distinct PLP defects.
a Representative electron micrographs of microglial cells (green pseudocolor) in optic nerve cross-sections from 12-month-old PLPmut, and PLPtg mice demonstrate differences in morphology, mitochondrial content (circles), and intracellular accumulation of myelin fragments (hashtags) and lysosomal storage material (asterisks). Scale bar, 2 μm. b Immunofluorescence detection and IMARIS Z-stack surface rendering of CD11b+ microglia in optic nerves of Wt, PLPmut, and PLPtg mice. Arrowheads indicate “bushy” microglia with thick processes and arrows indicate “amoeboid” microglia with short processes. Scale bar, 10 μm. c Quantification of CD11b+ microglia (left), CD11c+ microglia (% of CD11b, middle), and distribution of CD11c/P2RY12 reactivity on microglia (% of CD11b, right) in the optic nerves of 12-month-old Wt, PLPmut, and PLPtg mice (each circle represents the mean value of one mouse) as shown in Supplementary Fig. 6a, b. Ramified CD11c+ P2RY12+ microglia (representing AMG1) accumulate in both myelin mutants while amoeboid CD11c+ P2RY12- microglia (representing AMG2) arise in PLPtg mice (n = 5 mice per group, one-way ANOVA with Tukey’s multiple comparisons test, Left: F (2, 12) = 23.88, P < 0.001, Middle: F (2, 12) = 48.00, P < 0.001). d Representative immunofluorescence detection of P2RY12, CD11c, and GAL3 in the optic nerves of 12-month-old Wt, PLPmut, and PLPtg mice. CD11c+ P2RY12- (AMG2, arrow) microglia in PLPtg mice show higher expression of GAL3 than CD11c+ P2RY12- (AMG1, arrowhead) microglia in PLPmut or CD11c- P2RY12+ (HMG) microglia in Wt mice. Scale bar, 10 µm. Data are presented as the mean ± s.d.
Fig. 5
Fig. 5. Modulating microglia-mediated removal of perturbed myelin inversely affects axonal damage.
a Representative electron micrographs of optic nerve cross-sections from control (top) or cuprizone treated (bottom) Wt (left) and PLPmut (right) mice. The asterisk indicates an axonal spheroid. Scale bar, 2 μm. b Electron microscopy-based quantification of thinly myelinated (g-ratio ≥ 0.85) and non-myelinated axons (left) or axonal spheroids and degenerating axons (right) in Wt and PLPmut mice (n = 5 mice per group) after control or cuprizone (Cup) diet (each circle represents the mean value of one mouse, n = 4,5,5,5 mice per group, one-way ANOVA with Tukey’s multiple comparisons test, Left: F (3, 15) = 117.5, P < 0.001, Right: F (3, 15) = 19.13, P < 0.001). c Representative electron micrographs of optic nerve cross-sections from control (top) or PLX5622 treated (bottom) Wt (left) and PLPtg (right) mice. The asterisks indicate axonal spheroids. Scale bar, 2 μm. d Electron microscopy-based quantification of thinly myelinated (g-ratio ≥ 0.85) and non-myelinated axons (left) or axonal spheroids and degenerating axons (right) in Wt and PLPtg mice (n = 4 mice per group) after control or PLX5622 diet (n = 4 mice per group, one-way ANOVA with Tukey’s multiple comparisons test, Left: F (3, 12) = 118.8, P < 0.001, Right: F (3, 12) = 82.59, P < 0.001). e Representative immunofluorescence detection of P2RY12, CD11c, and GAL3 reactivity of microglia in optic nerves. Arrowheads indicate P2RY12+CD11c+GAL3- microglia (AMG1) and arrows indicate P2RY12-CD11c+GAL3+ microglia (AMG2). Scale bar, 20 μm. f Quantification of P2RY12-CD11c+GAL3+ microglia in the optic nerves of Wt and PLPmut mice after control or cuprizone (Cup) diet (left) and Wt and PLPtg mice after control or PLX5622 diet (right). AMG2 accumulate in PLPmut mice after cuprizone diet and is reduced in number after PLX5622 diet in PLPtg mice (n = 4 mice per group, one-way ANOVA with Tukey’s multiple comparisons test, Left: F (3, 12) = 127.4, P < 0.001, Right: F (3, 12) = 194.9, P < 0.001). Data are presented as the mean ± s.d.
Fig. 6
Fig. 6. T cell-driven axonal spheroid formation is initiated in proximity to constricted paranodal domains.
a Representative electron micrographs of optic nerve longitudinal sections from 3- to 9-month-old Wt (top), PLPmut (middle), and PLPtg mice displaying putative subsequent stages of axonal spheroid formation. Progressive constriction of axon diameters by oligodendrocytic paranodal loops (light red pseudocolor) correlates with the accumulation of disintegrating mitochondria (exemplarily shown in light blue pseudocolor), juxtaparanodal swelling, and fragmentation in PLPmut mice. Early-stage axonal spheroids in PLPtg mice are often associated with myelin-phagocytosing microglia (green pseudocolor). Scale bar, 0.5 μm. b Fibers with constricted paranodal domains are also detectable in cross-sections of optic nerves from PLPmut mice. Scale bar, 0.5 µm c Electron microscopy-based quantification of minimum paranodal axon diameters in 9-month-old Wt, PLPmut, and PLPtg mice (each circle represents the value of one paranodal region and each diamond represents the mean value of one mouse), colours indicate stages of spheroid formation, n = 5 mice and 25 paranodes per group, one-way ANOVA with Tukey’s multiple comparisons tests, F (2, 12) = 17.5, P < 0.001. d Analysis of the form factor of paranodal loops reveals decreased circularity along with progressive stages of spheroid formation (each circle represents the mean value of one paranodal region, n = 5 mice and 56 paranodes: 24 normal, 19 stage 1, 13 stage 2, one-way ANOVA with Tukey’s multiple comparisons test, F (2, 53) = 30.54, P < 0.001). e Electron microscopy-based quantification of minimum paranodal axon diameters in 9-month-old Wt, PLPmut (as shown in panel c), and PLPmut/Rag1−/− mice (n = 5 mice and 25 paranodes per group, one-way ANOVA with Tukey’s multiple comparisons test, F (2, 12) = 15.55, P < 0.001). f Quantification of small (S) and large (L) SMI32+ axonal spheroids in 3- and 9-month-old Wt, PLPmut, and PLPmut/Rag1−/− mice (each circle represents the mean value of one mouse, n = 5 mice per group, two-way ANOVA with Tukey’s multiple comparisons test, F (5, 48) = 36.19, P < 0.001). g Electron microscopy-based estimation of total axonal numbers in the optic nerves. Axon loss is significantly milder in PLPmut/Rag1−/− than PLPmut mice (n = 5 mice per group, two-way ANOVA with Tukey’s multiple comparisons test, F (2, 24) = 44.33, P < 0.001). Data are presented as the mean ± s.d.
Fig. 7
Fig. 7. Constricted paranodal domains in myelin mutants are associated with regions showing increased actomyosin activity.
a Representative immunofluorescence detection and IMARIS Z-stack surface rendering of CASPR and pMLC in the optic nerves of 12-month-old Wt, PLPmut, and PLPmut/Rag1−/− mice. pMLC is localized at normal appearing nodes of Ranvier (arrowheads). In PLPmut mice, paranodal domains with irregularly small diameters are surrounded by additional pMLC aggregates (arrows). Scale bar, 2 µm (top), 1 µm (bottom). b Super-resolution fluorescence detection and IMARIS Z-stack surface rendering of CASPR, F-actin, and pMLC in the optic nerves of 12-month-old Wt and PLPmut mice. Compact assemblies of F-actin and pMLC enwrap constricted paranodal domains in PLPmut mice (arrows). Note the proximity of a cell nucleus to the constricted paranodal domain. Scale bars: 10 µm expanded, 2.5 µm unexpanded (top), 2 µm expanded, 500 nm unexpanded (bottom). c Quantification of pMLC+ profiles in close association (≤1 µm distance) with individual CASPR+ paranodes in optic nerves of Wt, PLPmut, and PLPmut/Rag1−/− mice (each circle represents the mean value of one mouse). Paranodes in PLPmut mice are associated with a higher number of pMLC+ assemblies which is attenuated by Rag1 deficiency (n = 25 paranodes per mouse and 3 mice per group, One-way ANOVA with Tukey’s multiple comparisons test, F (2, 6) = 24.27, P = 0.001). Data are presented as the mean ± s.d.
Fig. 8
Fig. 8. Focal impairment of fast axonal transport in axonal spheroids depends on cytoskeletal plasticity.
a Representative straightened axon, kymograph, and kymograph of successfully tracked particles (top) as well as quantification of axonal transport parameters (bottom) in the optic nerve and b femoral quadriceps nerve explants from 12-month-old Wt/Nmnat2-Venus and PLPmut/Nmnat2-Venus mice. The straightened axon shows the first frame of the time-lapse recording (optic nerve: 60 frames in total, quadriceps nerve: 120 frames in total, frame rate 2 fps). Scale bar, 10 µm. Total NMNAT2 particle count and velocity are decreased in CNS but not PNS axons of PLPmut mice (each circle represents the mean value of 5 axons of one mouse, n = 5 mice per group, two-sided Student’s t-test, Optic nerve: Total particle count t = 5.602, Maximum velocity t = 4.241, Average velocity t = 6.478, Quadriceps nerve: Total particle count t = 0.1369, Maximum velocity t = 0.2749, Average velocity t = 0.7069, All d.f. = 8). c Straightened axon and kymograph of an optic nerve explant from a PLPmut/Nmnat2-Venus mouse exemplifying focal accumulation of particles (arrow) in an axon with blocked axonal transport (top). Representative immunofluorescence detection of SMI32 reactivity in optic nerves from 12-month-old PLPmut/Nmnat2-Venus mice (bottom). The arrows indicate axonal spheroids with an accumulation of NMNAT2 particles. Scale bars, 10 µm. d Schematic experimental design (left, created with BioRender.com). SMI32+ axonal spheroids were quantified in pairs of optic nerves from PLPmut/Nmnat2-Venus mice before or after live imaging explants in neurobasal A medium containing DMSO, cytochalasin D (Cyt D), or blebbistatin (Blebbi). Inhibition of actin polymerization or myosin activity blocks the increased frequency of SMI32+ axonal spheroids after 1 h imaging ex vivo (each circle represents the mean value of one optic nerve, n = 5,4,4 mice per group, two-sided paired t test, DMSO: t = 4.968, d.f. = 4, Cyt D: t = 0.7346, d.f. = 3, Blebbi: t = 1.575, d.f. = 3). Data are presented as the mean ± s.d.
Fig. 9
Fig. 9. Actomyosin constriction drives axonal spheroid formation in myelin mutant mice.
a Representative immunofluorescence detection (left) of pMLC and SMI32 in optic nerve explants from 12-month-old PLPmut/Nmnat2-Venus mice after live imaging explants in neurobasal A medium containing DMSO, cytochalasin D (Cyt D), or blebbistatin (Blebbi). Quantification (right) of pMLC fluorescence by thresholding analysis demonstrates an increase in relative pMLC+ area after live imaging which is blocked by Cyt D or Blebbi (each circle represents the mean value of one optic nerve, n = 5,4,4 mice per group, two-sided paired t test, DMSO: t = 4.292, d.f. = 4, Cyt D: t = 1.613, d.f. = 3, Blebbi: t = 3.125, d.f. = 3). b Quantification of SMI32+ axonal spheroids in pairs of optic nerves from Wt/Nmnat2-Venus mice before and after live imaging explants for 1 h in neurobasal A medium containing DMSO (each circle represents the mean value of one optic nerve, n = 5 mice per group, two-sided paired t test, t = 2.053, d.f. = 4). c Representative immunofluorescence detection (left) of pMLC and SMI32 in optic nerve explants from 12-month-old PLPmut mice after maintaining explants in neurobasal A medium containing DMSO, calyculin A (Cal A), or fasudil. Quantification (right) of pMLC fluorescence by thresholding analysis and d SMI32+ axonal spheroids demonstrates a further increase of relative pMLC+ area and axonal spheroid formation after Cal A and a block of pMLC induction and axonal spheroid formation after fasudil (each circle represents the mean value of one optic nerve, n = 4 mice per group, two-sided paired t test, Cal A: t = 3.703, d.f. = 3, fasudil: t = 2.577, d.f. = 3) e Schematic experimental design (left, created with BioRender.com) and IMARIS Z-stack surface rendering of CD8 and SMI32 in the optic nerves of 9-month-old PLPmut mice with or without fasudil treatment. Scale bar, 10 µm. Quantification of CD8+ T cells (middle) and SMI32+ axonal spheroids (right) demonstrates no impact of fasudil on the numbers of CD8+ T cells but on axonal spheroid formation in PLPmut mice (each circle represents the mean value of one optic nerve, n = 5 mice per group, One-way ANOVA with Tukey’s multiple comparisons test, CD8: F (3, 16) = 17.72, P < 0.001, SMI32: F (3, 16) = 18.99, P < 0.001). Data are presented as the mean ± s.d.

References

    1. Simons M, Nave KA. Oligodendrocytes: myelination and axonal support. Cold Spring Harb. Perspect. Biol. 2015;8:a020479. doi: 10.1101/cshperspect.a020479. - DOI - PMC - PubMed
    1. Bonetto G, Belin D, Karadottir RT. Myelin: a gatekeeper of activity-dependent circuit plasticity? Science. 2021;374:eaba6905. doi: 10.1126/science.aba6905. - DOI - PubMed
    1. Duncan ID, Radcliff AB. Inherited and acquired disorders of myelin: the underlying myelin pathology. Exp. Neurol. 2016;283:452–475. doi: 10.1016/j.expneurol.2016.04.002. - DOI - PMC - PubMed
    1. Salvadores N, Sanhueza M, Manque P, Court FA. Axonal degeneration during aging and its functional role in neurodegenerative disorders. Front Neurosci. 2017;11:451. doi: 10.3389/fnins.2017.00451. - DOI - PMC - PubMed
    1. Stassart RM, Möbius W, Nave KA, Edgar JM. The axon-myelin unit in development and degenerative disease. Front Neurosci. 2018;12:467. doi: 10.3389/fnins.2018.00467. - DOI - PMC - PubMed

Publication types

Substances