. 2023 Oct 30;14(1):6903.
doi: 10.1038/s41467-023-42682-9.

Proteomics reveal biomarkers for diagnosis, disease activity and long-term disability outcomes in multiple sclerosis

Affiliations

Proteomics reveal biomarkers for diagnosis, disease activity and long-term disability outcomes in multiple sclerosis

Julia Åkesson et al. Nat Commun. .

Abstract

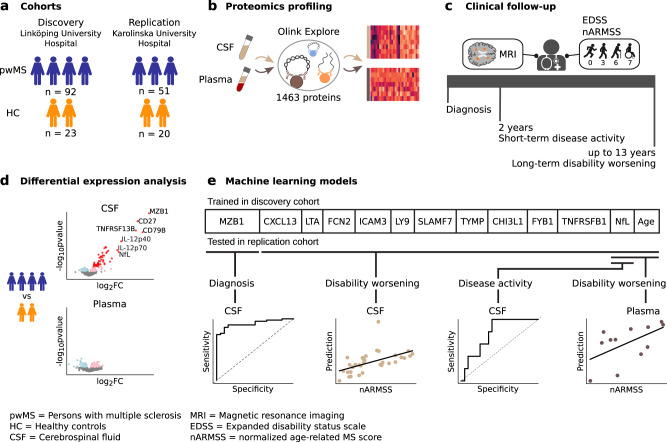
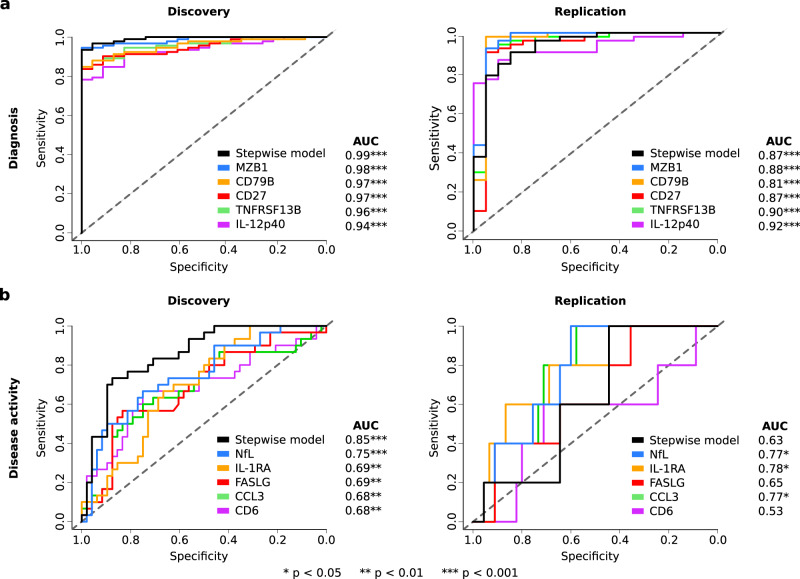
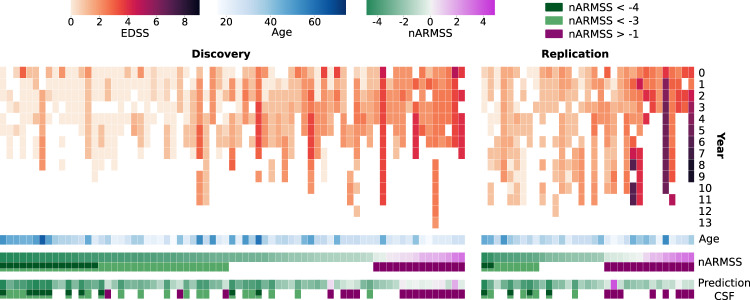
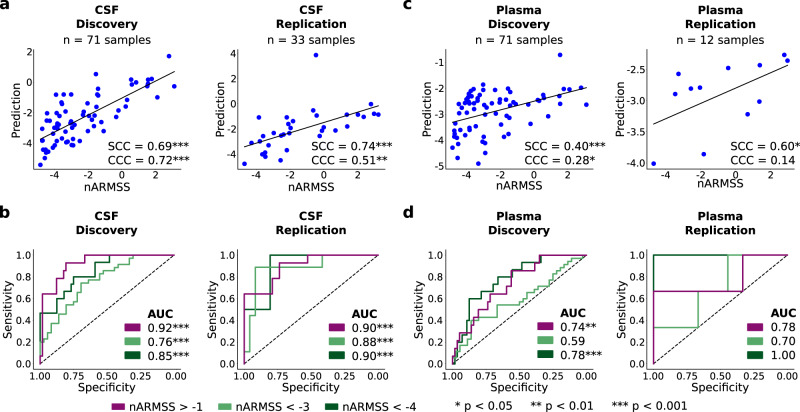
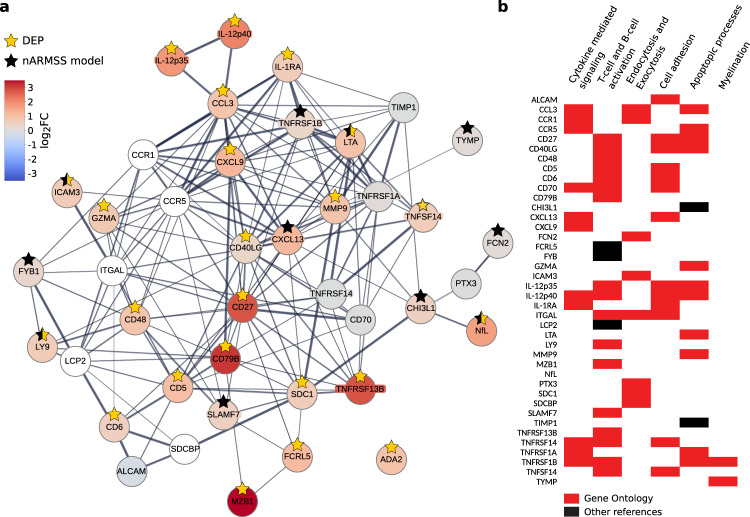
Sensitive and reliable protein biomarkers are needed to predict disease trajectory and personalize treatment strategies for multiple sclerosis (MS). Here, we use the highly sensitive proximity-extension assay combined with next-generation sequencing (Olink Explore) to quantify 1463 proteins in cerebrospinal fluid (CSF) and plasma from 143 people with early-stage MS and 43 healthy controls. With longitudinally followed discovery and replication cohorts, we identify CSF proteins that consistently predicted both short- and long-term disease progression. Lower levels of neurofilament light chain (NfL) in CSF is superior in predicting the absence of disease activity two years after sampling (replication AUC = 0.77) compared to all other tested proteins. Importantly, we also identify a combination of 11 CSF proteins (CXCL13, LTA, FCN2, ICAM3, LY9, SLAMF7, TYMP, CHI3L1, FYB1, TNFRSF1B and NfL) that predict the severity of disability worsening according to the normalized age-related MS severity score (replication AUC = 0.90). The identification of these proteins may help elucidate pathogenetic processes and might aid decisions on treatment strategies for persons with MS.


Conflict of interest statement

T.O. has received advisory board/lecture honoraria as well as unrestricted research grants from Biogen, Novartis, Sanofi, and Merck. None of which has any relation to the current manuscript. F.P. has received research grants from Janssen, Merck KgaA and UCB, and fees for serving on DMC in clinical trials with Chugai, Lundbeck and Roche, and preparation of expert witness statement for Novartis. J.M. has received honoraria for advisory boards for Sanofi Genzyme and Merck and lecture honorarium from Merck. The remaining authors declare no competing interests.

Figures

Fig. 1
Fig. 1. Overview of the study.
a Prospective longitudinal study of two Swedish cohorts of persons with MS (pwMS) in the early stages and healthy controls (HC). b Proteomics profiling of cerebrospinal fluid (CSF) and plasma samples of all pwMS and HC at baseline. c Clinical examination of pwMS during a follow-up of up to 13 years. d Differential expression analysis, performed with a two-sided linear model t-test (Limma analysis), to find MS biomarker candidates. e Building machine learning models for identification of protein MS biomarkers for diagnosis (logistic regression model), prediction of short-term disease activity (logistic regression model), and prediction of long-term disability worsening (linear regression model).
Fig. 2
Fig. 2. Differential expression analysis of persons with MS (pwMS) compared to healthy controls (HC) in cerebrospinal fluid (CSF) and plasma.
a Principal component (PC) analysis of all proteins measured in the CSF samples (left) and plasma samples (right). b Volcano plots showing differentially expressed proteins (DEPs) in CSF (left) and plasma (right). The top upregulated proteins, which overlapped in discovery cohort and replication cohort, are marked with protein names in the plots. The differential expression analysis was performed using a two-sided linear model t-test (Limma analysis). c DEPs (false discovery rate < 0.05) in the CSF, in either the discovery cohort or the replication cohort. The first two columns show the log2 fold change (FC) of the DEPs in each cohort. Most proteins are upregulated (red) and 23 proteins overlap in discovery and replication cohorts. In the three columns to the right, it is marked which proteins are in three different list of known MS-associated genes and proteins (DisGeNET database, GWAS genes, and MS biomarkers) with the odds ratio of the enrichment shown on the top (two-sided Fisher’s exact test). The DEPs were significantly enriched for MS-associated genes from DisGeNet (discovery: p = 7∗10−8, replication: p = 0.002), GWAS (discovery: p = 1∗10−7, replication: p = 2∗10−4), and known MS biomarkers (discovery: p = 1∗10−12, replication: p = 2∗10−6).
Fig. 3
Fig. 3. Performance of the top cerebrospinal fluid (CSF) proteins for predicting diagnosis and disease activity over 2 years.
Predictive power, assessed by area under the curve (AUC), of the most significant CSF proteins in the discovery cohort in differentiating between a persons with MS (pwMS; n = 92 samples in the discovery and n = 51 samples in the replication cohort) and healthy controls (HC; n = 23 samples in the discovery and n = 20 samples in the replication cohort) and b pwMS showing evidence of disease activity after 2 years (n = 48 samples in discovery and n = 45 samples in replication cohort) and pwMS not showing evidence of disease activity after 2 years (n = 30 samples in discovery and n = 5 samples in replication cohort). A logistic regression model was used to assess the predictive power of both individual proteins (the top 5 proteins in the discovery cohort are shown) and a combination of proteins, selected with a stepwise method, trained on the discovery cohort and independently validated on the replication cohort. The significance of the AUC scores were assessed with a two-sided Mann–Whitney U test. The p-values for the AUC scores of the diagnosis models in the order (stepwise model, NfL, CD79B, CD27, TNFRSF13B, IL-12p40) were (2∗10−13, 4∗10−13, 1∗10−12, 3∗10−12, 6∗10−12, 6∗10−11) for the discovery cohort and (6∗10−7, 4∗10−7, 2∗10−5, 10∗10−7, 1∗10−7, 2∗10−8) for the replication cohort. The p-values for the AUC scores of the disease activity models in the order (stepwise model, NfL, IL-1RA, FASLG, CCL3, CD6) were (1∗10−8, 9∗10−5, 0.002, 0.003, 0.004, 0.004) for the discovery cohort and (0.19, 0.02, 0.02, 0.14, 0.03, 0.41) for the replication cohort.
Fig. 4
Fig. 4. Overview of the Expanded Disability Status Scale (EDSS) scores during yearly follow-up for persons with MS (pwMS).
The disability worsening scores for pwMS, who had at least two EDSS scores over a period of more than 3 years. Each column corresponds to one person. The top heatmap shows the EDSS scores for each follow-up year (0–13 years), followed by the age of each person. White cells indicate that no EDSS score was available for that year. Thereafter follows the normalized age-related MS score (nARMSS), calculated from a person’s EDSS score and age. In the row underneath the nARMSS score it is marked if a person’s nARMSS score is below the thresholds nARMSS < −4 or nARMSS < −3, or above the threshold nARMSS > −1. White cells indicate that the nARMSS score is not covered by any of these three thresholds. The last two rows show the predicted nARMSS score obtained from the suggested cerebrospinal fluid (CSF) model combining 11 proteins (first row) and if the predicted nARMSS score is covered by any of the three thresholds mentioned above (second row).
Fig. 5
Fig. 5. Performance of the top models for predicting long-term disability worsening using cerebrospinal fluid (CSF) and plasma proteins.
a CSF: The predicted normalized age-related MS scores (nARMSS) were significantly correlating with the true nARMSS for both discovery and replication cohorts, assessed with Spearman’s correlation coefficient (SCC; discovery: p = 3∗10−11, replication: p = 9∗10−7) and Lin’s concordance correlation coefficient (CCC; discovery: p = 2∗10−12, replication: p = 0.002). b CSF: Receiver operating characteristic (ROC) curves and area under the curve (AUC) scores for each of the three different nARMSS thresholds. The p-values for the AUC scores in the order (nARMSS > −1, nARMSS < −3, nARMSS < −4) were (2∗10−5, 7∗105, 6∗10−7) for the discovery cohort and (0.03, 4∗10−4, 6∗10−5) for the replication cohort. c Plasma: Reducing the CSF model to NfL and age resulted in a model that could predict nARMSS from plasma samples. The predicted nARMSS significantly correlated with the true nARMSS for both the discovery cohort (SCC: p = 5∗10−4, CCC: p = 0.02) and replication cohort (SCC: p = 0.04, CCC: p = 0.66). d Plasma: ROC curves and AUC scores for each of the three different nARMSS thresholds. The p-values for the AUC scores in the order (nARMSS > −1, nARMSS < −3, nARMSS < −4) were (4∗10−4, 0.09, 0.003) for the discovery cohort and (0.08, 0.19, 0.07) for the replication cohort. The significance of the SCCs and CCCs was assessed with t-statistics (two-sided) and the significance of the AUC scores were assessed with a one-sided Mann–Whitney U test.
Fig. 6
Fig. 6. Identified MS proteins share functional context.
a An MS network was formed by connecting the proteins in the normalized age-related MS score (nARMSS) model (black star) and the differentially expressed proteins (DEPs) that overlapped in the discovery and the replication cohort (yellow star). The proteins were connected using STRING (combined interaction score > 0.4) with one intermediate protein allowed to be added to connect proteins. The proteins are color-coded on the log2 fold change (FC), comparing persons with MS with healthy controls. The white colored proteins were not included in the proteomics profiling. IL-12p35 was not measured in the proteomics profiling but is included as a DEP as it together with IL-12p40 represents IL-12p70. The linewidth of the interactions is related to the combined interaction score of each interaction in STRING. b Proteins in the MS network divided into functional categories. The proteins were categorized into groups with shared functionality based on Gene Ontology enrichment analyses (red), and the literature (black).

References

    1. Rotstein D, Montalban X. Reaching an evidence-based prognosis for personalized treatment of multiple sclerosis. Nat. Rev. Neurol. 2019;15:287–300. doi: 10.1038/s41582-019-0170-8. - DOI - PubMed
    1. Liu J, Kelly E, Bielekova B. Current status and future opportunities in modeling clinical characteristics of multiple sclerosis. Front Neurol. 2022;13:884089. doi: 10.3389/fneur.2022.884089. - DOI - PMC - PubMed
    1. Villoslada P, Baranzini S. Data integration and systems biology approaches for biomarker discovery: challenges and opportunities for multiple sclerosis. J. Neuroimmunol. 2012;248:58–65. doi: 10.1016/j.jneuroim.2012.01.001. - DOI - PubMed
    1. Kosa, P. et al. Molecular models of multiple sclerosis severity identify heterogeneity of pathogenic mechanisms. Nat Commun.13, 7670 (2022). - PMC - PubMed
    1. Zhong W, et al. Next generation plasma proteome profiling to monitor health and disease. Nat. Commun. 2021;12:2493. doi: 10.1038/s41467-021-22767-z. - DOI - PMC - PubMed

Publication types