. 2023 Nov;29(11):2939-2953.
doi: 10.1038/s41591-023-02602-2. Epub 2023 Oct 30.

An integrated gene-to-outcome multimodal database for metabolic dysfunction-associated steatotic liver disease

Affiliations

An integrated gene-to-outcome multimodal database for metabolic dysfunction-associated steatotic liver disease

Timothy J Kendall et al. Nat Med. 2023 Nov.

Abstract

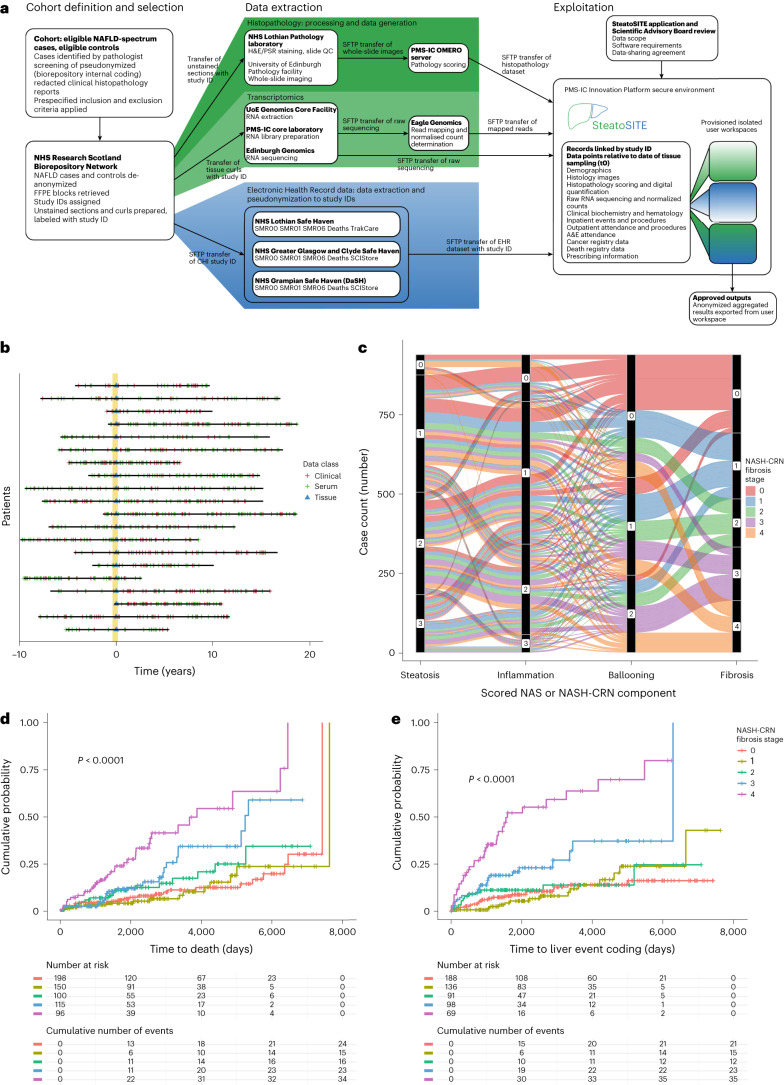
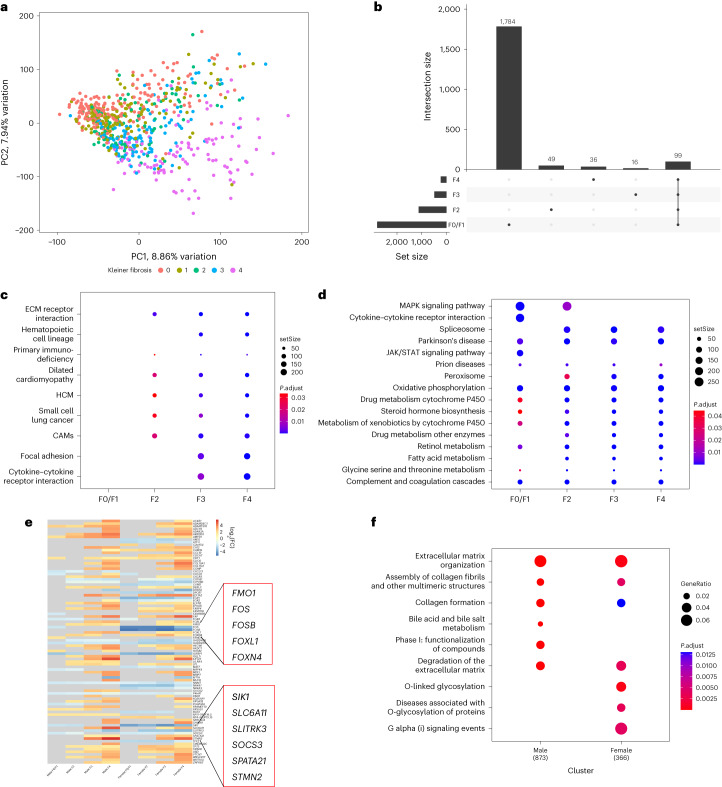
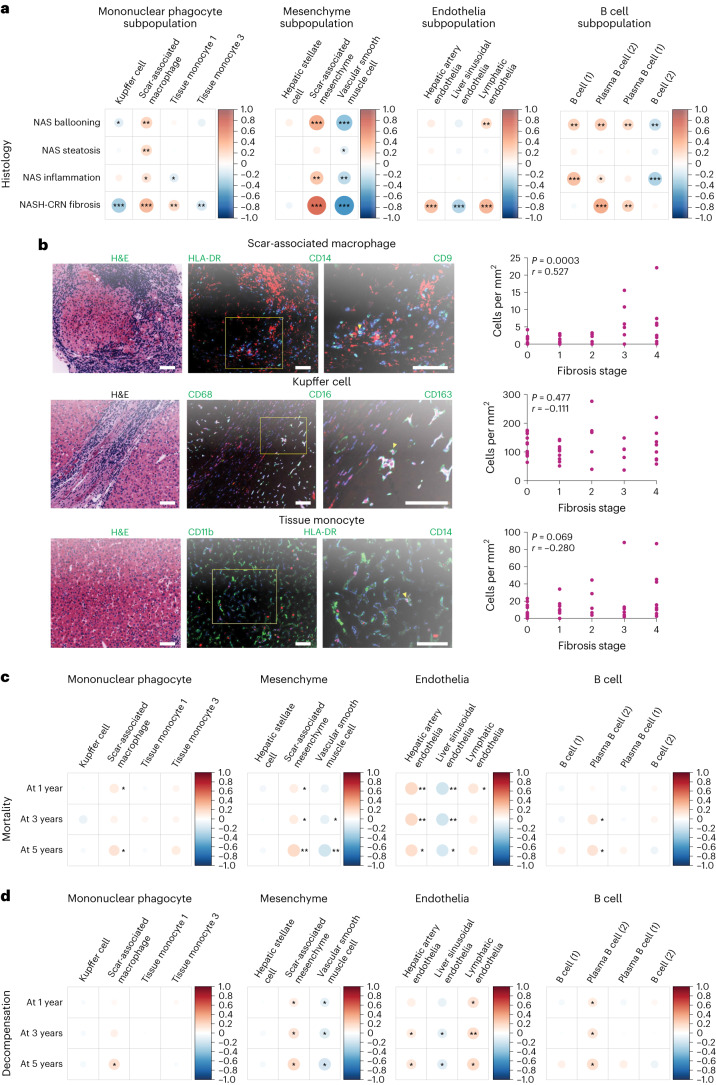
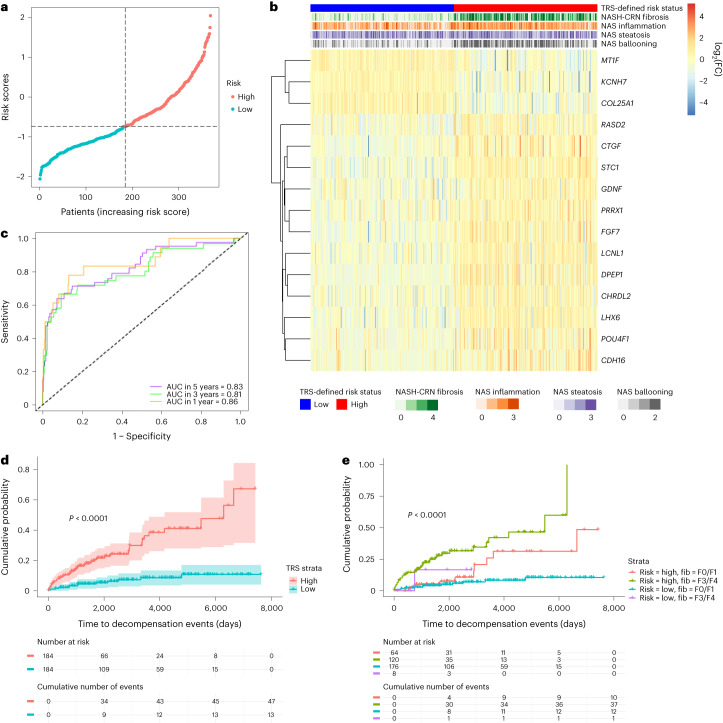
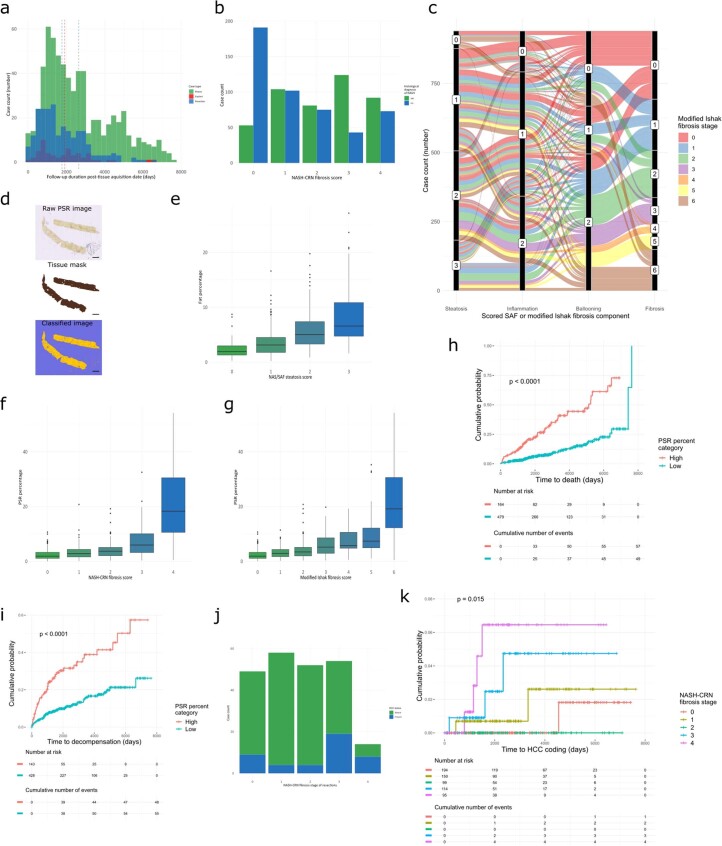
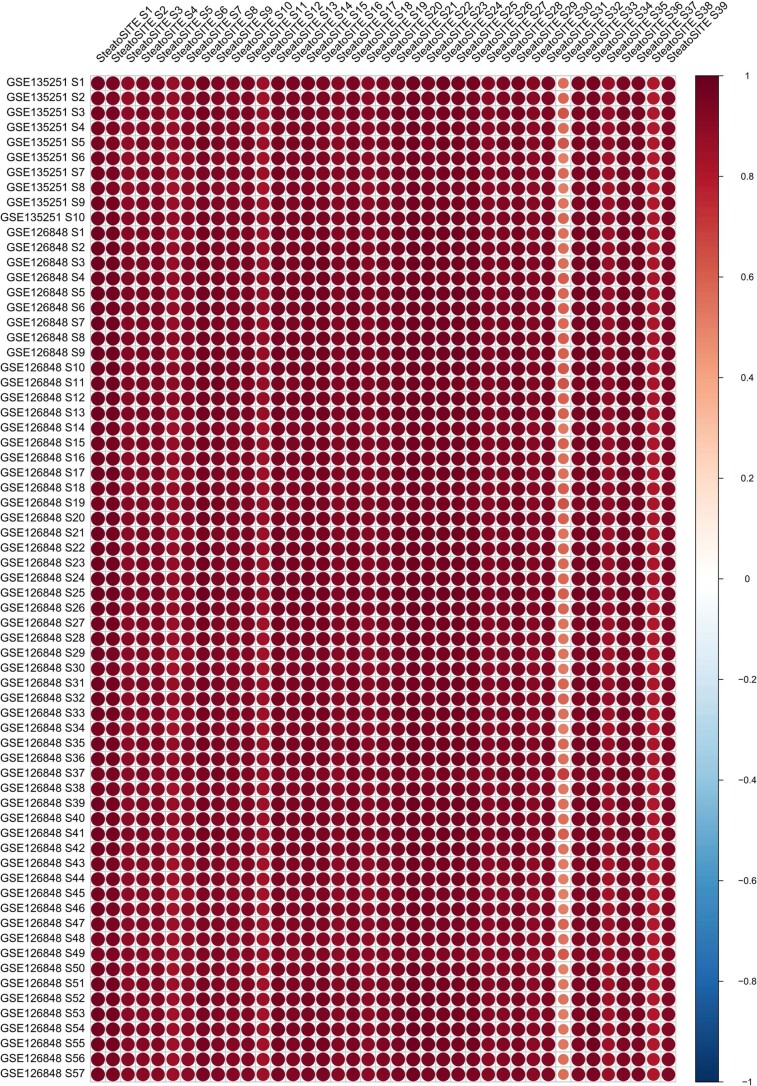
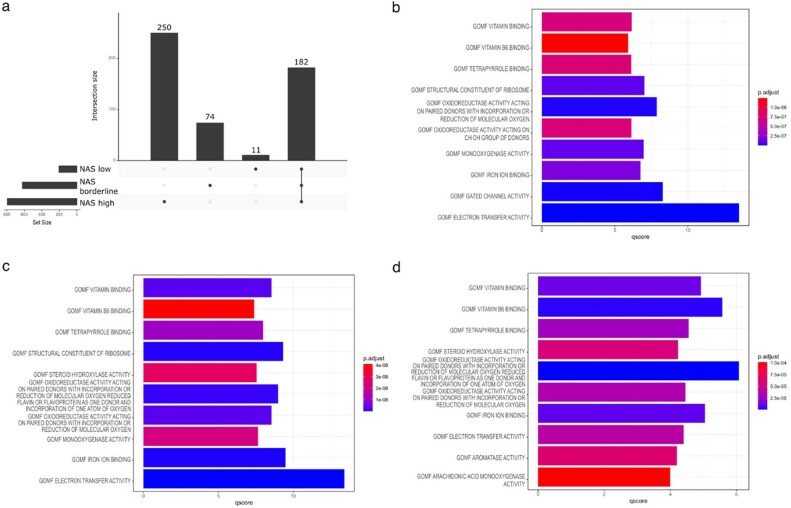
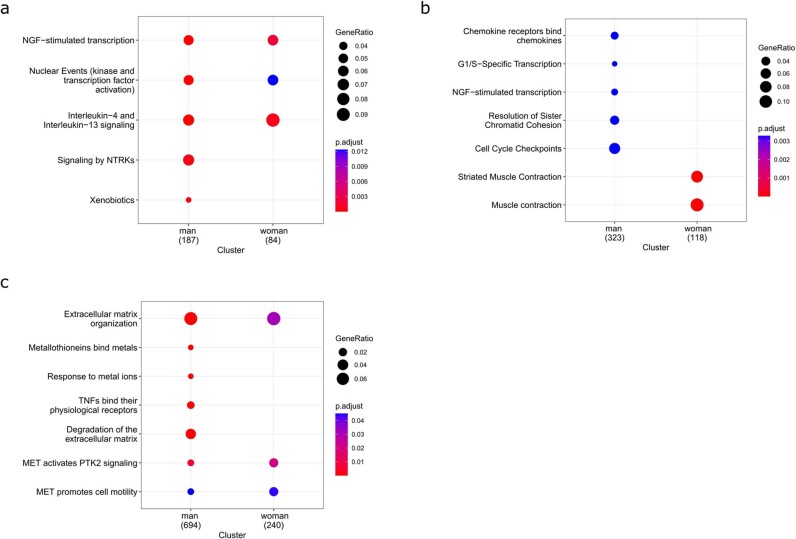
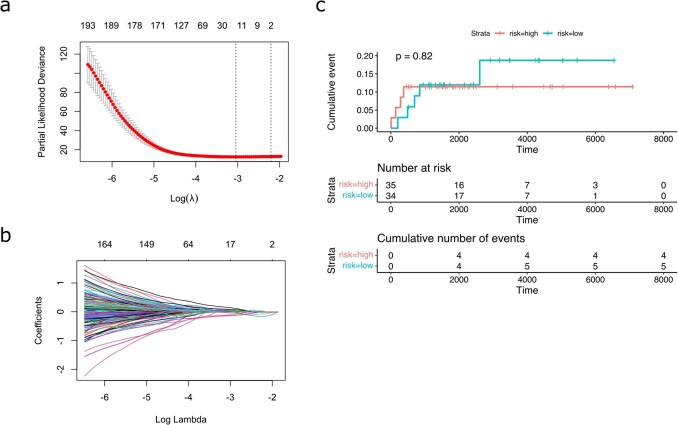
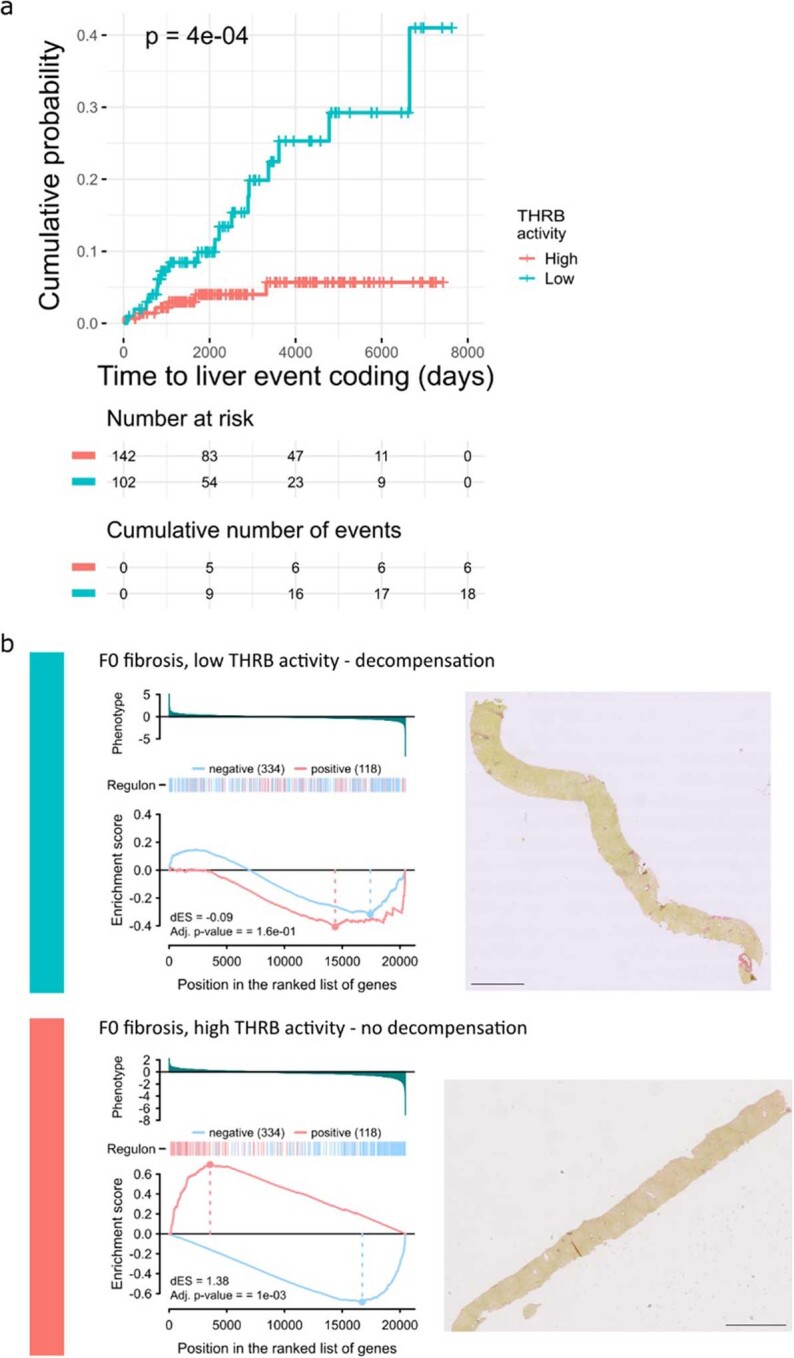
Metabolic dysfunction-associated steatotic liver disease (MASLD) is the commonest cause of chronic liver disease worldwide and represents an unmet precision medicine challenge. We established a retrospective national cohort of 940 histologically defined patients (55.4% men, 44.6% women; median body mass index 31.3; 32% with type 2 diabetes) covering the complete MASLD severity spectrum, and created a secure, searchable, open resource (SteatoSITE). In 668 cases and 39 controls, we generated hepatic bulk RNA sequencing data and performed differential gene expression and pathway analysis, including exploration of gender-specific differences. A web-based gene browser was also developed. We integrated histopathological assessments, transcriptomic data and 5.67 million days of time-stamped longitudinal electronic health record data to define disease-stage-specific gene expression signatures, pathogenic hepatic cell subpopulations and master regulator networks associated with adverse outcomes in MASLD. We constructed a 15-gene transcriptional risk score to predict future hepatic decompensation events (area under the receiver operating characteristic curve 0.86, 0.81 and 0.83 for 1-, 3- and 5-year risk, respectively). Additionally, thyroid hormone receptor beta regulon activity was identified as a critical suppressor of disease progression. SteatoSITE supports rational biomarker and drug development and facilitates precision medicine approaches for patients with MASLD.


Conflict of interest statement

T.J.K. serves as a consultant for or has received speakers’ fees from Resolution Therapeutics, Clinnovate Health, Perspectum and Incyte Corporation. P.R. serves as a consultant for Merck and has received research grant funding from Genentech. J.A.F. serves as a consultant or advisory board member for Resolution Therapeutics, Kynos Therapeutics, Ipsen, Redx Pharma, River 2 Renal Corp., Stimuliver, Galecto Biotech, Global Clinical Trial Partners and Guidepoint and has received research grant funding from Intercept Pharmaceuticals and Genentech. A.J.-J. is an employee and stock owner at NeoGenomics. I.N.G. serves as an advisory board member for Resolution Therapeutics and has received research grant funding from Gilead Sciences. M.D.M. and D.R.D. have a controlling shareholder interest in Biodev Ltd. The remaining authors declare no competing interests.

Figures

Fig. 1
Fig. 1. Clinicopathological correlations.
a, SteatoSITE Data Commons overview. b, Schematic diagram in which horizontal lines are individual patient timelines decorated with a variable amount of multimodal data preceding or following the date of liver tissue sampling (time zero, represented by the vertical yellow line). c, Alluvial diagram illustrating the relationship between the scored histopathological features of liver samples. d,e, Kaplan–Meier time-to-event analysis with log-rank test P value for all-cause mortality (P < 0.0001) (d) and hepatic decompensation events (P < 0.0001) (e) in patients with biopsies showing early disease (fibrosis stages F0 to F2), bridging fibrosis (stage F3) and cirrhosis (stage F4). A&E, accident and emergency; SFTP, Secure File Transfer Protocol.
Fig. 2
Fig. 2. Hepatic transcriptomic analysis and summary bioinformatics.
a, PCA plot for 616 MASLD samples and 34 normal liver control samples after including batch effects as covariates in the linear model. The first PC is displayed on the x axis and the second PC on the y axis, with the corresponding percentage of total variance explained by each PC. Dots represent individual samples colored according to NASH-CRN fibrosis stage. b, UpSet plot of DEGs showing the unique DEGs belonging to individual sets (fibrosis stages F0/1, F2, F3, F4) and the intersection of DEGs across all fibrosis stages. Set sizes are presented as bars, and their composition is described by the bottom panel. c,d, Dot plots showing the downregulated (c) and upregulated (d) Kyoto Encyclopedia of Genes and Genomes pathways (Benjamini and Hochberg false discovery rate q < 0.05 and fold-change of ≥1) obtained from one-sided gene-set-enrichment analysis for different fibrosis stages (F0/1, F2, F3, F4). The size of the dot is on the basis of gene count enriched in the pathway, and the color of the dot shows the pathway enrichment significance. e, FC of the top 20 differentially expressed genes in each fibrotic stage for both men and women. Exemplar dysregulated genes between men and women are highlighted for illustration. The gray color indicates that the genes were not statistically significantly dysregulated for that specific stage. f, Dot plot highlighting the differences between the Reactome pathways (q < 0.05 and FC ≥1) obtained by one-sided GSEA in men and women in stage F4 compared with controls. setSIZE indicates the total number of genes present in each specific gene set. P.adjust indicates the Benjamini and Hochberg adjusted P values. GeneRatio is k/n, where k is the overlap between the genes of interest and the gene set and n is the number of all unique genes of interest. CAM, cell adhesion molecule; ECM, extracellular matrix; HCM, hypertrophic cardiomyopathy; JAK, Janus kinase; MAPK, mitogen-activated protein kinase; STAT, signal transducer and activator of transcription.
Fig. 3
Fig. 3. Hepatic bulk RNA-seq data with clinical annotation.
a, Corrplots of macrophage, mesenchyme, endothelia and B cell subpopulation proportion correlations with NAS components and NASH-CRN fibrosis stage. *P < 0.05, **P < 0.01, ***P < 1 × 10−6. Color and size of circles indicate the Pearson correlation coefficients. b, Representative H&E-stained sections and multiplex immunofluorescent staining to identify subpopulations of SAMacs, Kupffer cells and tissue monocytes. Selected markers shown. Arrowheads indicate stated cell type. Correlation of number of stated cell type per mm2 tissue with fibrosis stage (n = 43; Spearman’s rho and P value indicated). Scale bars, 100 µm. c,d, Corrplots of macrophage, mesenchyme, endothelia and B cell subpopulation proportion correlations with 1-, 3- and 5-year all-cause mortality (c) and decompensation risk (d). *P < 0.05, **P < 0.01. Color and size of circles indicate the Pearson correlation coefficients.
Fig. 4
Fig. 4. Prediction of risk of future decompensation events in advanced fibrosis using hepatic bulk RNA-seq data.
a, Correlation between the risk scores and the time of the decompensation events. b, Heatmap of the gene expression profile of the prognostic signature. c, Time-dependent ROC curves and AUC analyses by the expression of the 15 genes. d, Kaplan–Meier curves (with 95% confidence intervals) showing high- and low-risk groups for all biopsy cases; log-rank test P value < 0.0001. e, Kaplan–Meier curves demonstrating separation of patients into high- and low-risk groups in both mild (F0/1) and severe (F3/4) fibrosis stages; log-rank test P value.
Fig. 5
Fig. 5. The relationship of THRB with disease progression.
a, Heatmap of estimated transcriptional network (regulon) activity across the SteatoSITE dataset. b, Patterns of activity and cluster membership of the three regulons (THRB, AEBP2, BNC2). c, Relationships of THRB, AEBP1, BNC2 regulatory networks with significant numbers of component genes from the TRS as gene target members in disease progression. Red edges, positive regulation of gene target; blue edges, negative regulation of gene target; blue nodes, net negative gene regulation; red nodes, net positive gene regulation; gray nodes, net neutral gene regulation; green nodes, TRS gene member. d, Ranked THRB regulon differential activity plot confirms the negative relationship between THRB regulon activity and disease stage (left and center), and the Kaplan–Meier plot indicates that lower THRB regulon activity is predictive of hepatic decompensation (right); log-rank test P value. e, In histologically identical high-risk fibrosis stages (F3 and F4), low THRB activity identifies patients at high risk of hepatic decompensation event; log-rank test P value < 0.0001. f, Example individual two-tailed gene set enrichment plots of target genes in the THRB regulon (left, two-tailed gene set enrichment testing with Benjamini and Hochberg (false discovery rate) adjusted P values < 0.001) from two patients with identical F4 stage (cirrhosis) on PSR-stained sections (right), where the patient with low THRB differential regulon activity (top, blue) progressed to a hepatic decompensation event 224 days after biopsy in contrast to a patient with high THRB regulon activity who did not experience a decompensation event during the 4,500 days until censoring (bottom, red). Scale bars, 2 mm. dES, differential enrichment score.
Extended Data Fig. 1
Extended Data Fig. 1. Additional histopathological analyses.
a, Clinical follow-up depth (in days) according to specimen type. b, Clinical assessment of the presence or absence of a histological diagnosis of steatohepatitis versus NASH-CRN stage. c, Alluvial diagram illustrating the relationship between the scored SAF and modified Ishak stage features. d, A representative whole-slide image of a PSR-stained section with the associated tissue mask and applied classifier showing PSR-positive (red) and fat droplets (purple) from the QuPath quantitative pathology pipeline; only pixels present within the tissue mask are used for PSR and fat quantitation. Pixel classification using the same classifier always returns the same values so was only undertaken once. Scale bar, 2 mm. e, The amount of steatosis from image quantification versus NAS steatosis assigned scores from the 922 cases with quantifiable whole-slide images. f, The PSR percentage from image quantification versus assigned NASH-CRN scores from the 922 cases with quantifiable whole-slide images. g, The PSR percentage from image quantification versus assigned modified Ishak scores from the 922 cases with quantifiable whole-slide images. All boxplots show median (centre line), first and third quartiles (lower and upper box limits), 1.5× interquartile range (whiskers). Computationally-derived scar proportion can be used to stratify the risk of all-cause mortality (h) and hepatic decompensation (i); log–rank test P-values < 0.0001. j, Count of presence or absence of hepatocellular carcinoma (HCC) in resection cases versus assigned NASH-CRN stage. k, Kaplan–Meier time-to-event analysis for HCC in patients with biopsies showing early disease (fibrosis stages F0 to F2), bridging fibrosis (stage F3) and cirrhosis (stage F4); log–rank test P-value = 0.015.
Extended Data Fig. 2
Extended Data Fig. 2. Validation of normal liver transcriptome.
Correlation (corrplot) of transcriptomic profiles of normal SteatoSITE samples (n = 39) with published normal liver reference data (n = 57). The colour scale corresponds to the strength and direction of correlations.
Extended Data Fig. 3
Extended Data Fig. 3. SteatoSITE RNA-seq according to NAS scores.
a, UpSet plot of differentially assessed genes (DEGs), showing DEGs belonging to individual sets (according to NAFLD activity score (NAS) ≤ 2, NAS 3/4 and NAS ≥ 5) and the intersection of DEGs across all NAS sets. Set sizes are presented as bars and their composition is described by the bottom panel. b, Top 10 molecular functions (gene ontology (GO) terms) identified with one-sided gene set enrichment analysis based on the differentially expressed genes of NAS ≤ 2; c, NAS 3/4; d, NAS ≥ 5 (Benjamin and Hochberg false discovery rate q < 0.05 and fold-change of ≥1).
Extended Data Fig. 4
Extended Data Fig. 4. SteatoSITE RNA-seq gender-focused gene enrichment analysis.
Reactome pathways obtained from one-sided gene set enrichment analysis in both men and women for a, F0/1 vs control; b, F2 vs controls; c, F3 vs controls (Benjamin and Hochberg false discovery rate q < 0.05 and fold-change ≥ 1).
Extended Data Fig. 5
Extended Data Fig. 5. Correlation of scar-associated macrophage numbers with NAFLD activity score components.
Scar-associated macrophage numbers determined by multiplex immunofluorescence correlated positively with assigned components of the NAFLD activity score (n = 43). Spearman’s rho and P-value indicated for ballooning (a), steatosis (b), and inflammation (c).
Extended Data Fig. 6
Extended Data Fig. 6. Regularised Cox regression model.
a, Plot of the optimal value of logarithmic lambda (n = 100) and the cross-validation error. Data presented as mean value +/− SD. b, Coefficient values across the logarithmic lambda. c, Kaplan-Meier plot demonstrating no separation of the event curves of patients with biopsies showing F2 fibrosis using the transcriptional risk score; log rank test P-value = 0.82.
Extended Data Fig. 7
Extended Data Fig. 7. Gene expression of the prognostic signature across the fibrotic stages.
Plots of the normalised expression of the named 15 gene constituents of the transcriptional risk score by NASH-CRN fibrosis stage (n = 368), as visualised by the Shiny transcriptome browser app. All boxplots show median (centre line), first and third quartiles (lower and upper box limits), 1.5× interquartile range (whiskers). P-values of one-way ANOVA with post-hoc Tukey test.
Extended Data Fig. 8
Extended Data Fig. 8. Additional predictive and personalisation value of estimated THRB regulon activity in F0 and F1 stage disease.
a, In histologically identical low-risk fibrosis stages (F0 and F1 biopsy cases), low THRB activity identifies patients at high risk of progression to a hepatic decompensation event; log rank test P-value. b, Example individual 2-tailed gene set enrichment plots of target genes in the THRB regulon (left, 2-tailed gene set enrichment testing with Benjamini and Hochberg (false discovery rate) adjusted P-values) from two patients with identical F0 stage (no scarring) on PSR stained sections (right), where the patient with low THRB differential regulon activity (top, blue) progressed to a hepatic decompensation event 3000 days after biopsy in contrast to a patient with high THRB regulon activity who did not experience a decompensation event during the 4400 days until censoring (bottom, red). Scale bars, 2 mm.
Extended Data Fig. 9
Extended Data Fig. 9. Correlations between the main principal components and the clinical data.
P-values of Spearman correlation test. * P < 0.05, ** P < 0.01, ** P < 0.001, **** P < 0.0001.

References

    1. Rinella, M. E. et al. A multi-society Delphi consensus statement on new fatty liver disease nomenclature. Hepatology10.1097/HEP.0000000000000520 (2023). - PubMed
    1. WHO European Region. SDR, chronic liver disease and cirrhosis, all ages, per 100 000. European Health Information Gatewayhttps://gateway.euro.who.int/en/indicators/hfa_236-1860-sdr-chronic-live... (2021).
    1. Lazarus JV, et al. The global NAFLD policy review and preparedness index: are countries ready to address this silent public health challenge? J. Hepatol. 2022;76:771–780. doi: 10.1016/j.jhep.2021.10.025. - DOI - PubMed
    1. NHS Blood and Transplant Annual Report and Accounts 2018/19 (NHS Blood and Transplant, 2019).
    1. Le MH, et al. Forecasted 2040 global prevalence of nonalcoholic fatty liver disease using hierarchical Bayesian approach. Clin. Mol. Hepatol. 2022;28:841–850. doi: 10.3350/cmh.2022.0239. - DOI - PMC - PubMed