. 2023 Nov;5(11):1887-1910.
doi: 10.1038/s42255-023-00912-w. Epub 2023 Oct 30.

PDK4-dependent hypercatabolism and lactate production of senescent cells promotes cancer malignancy

Affiliations

PDK4-dependent hypercatabolism and lactate production of senescent cells promotes cancer malignancy

Xuefeng Dou et al. Nat Metab. 2023 Nov.

Erratum in

Abstract

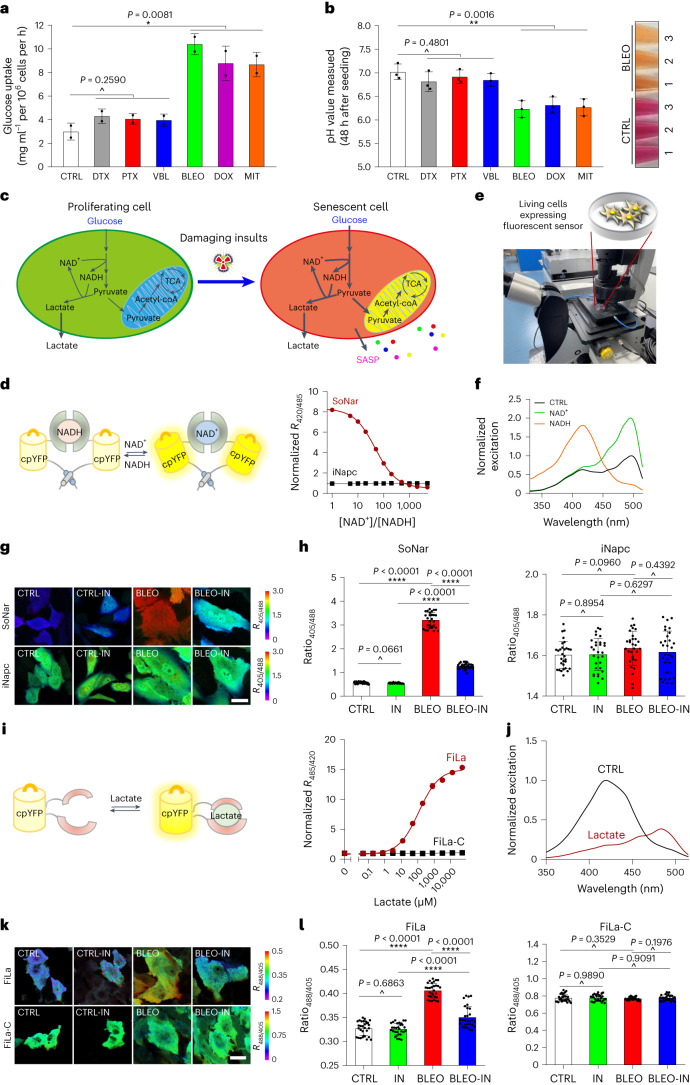
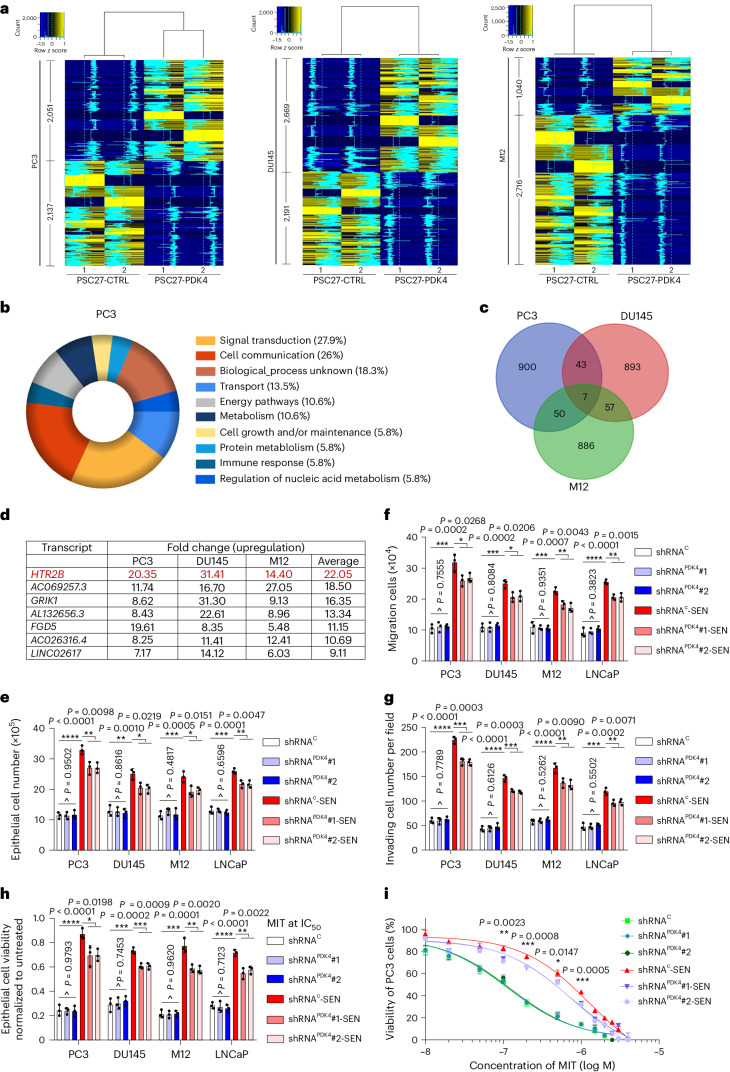
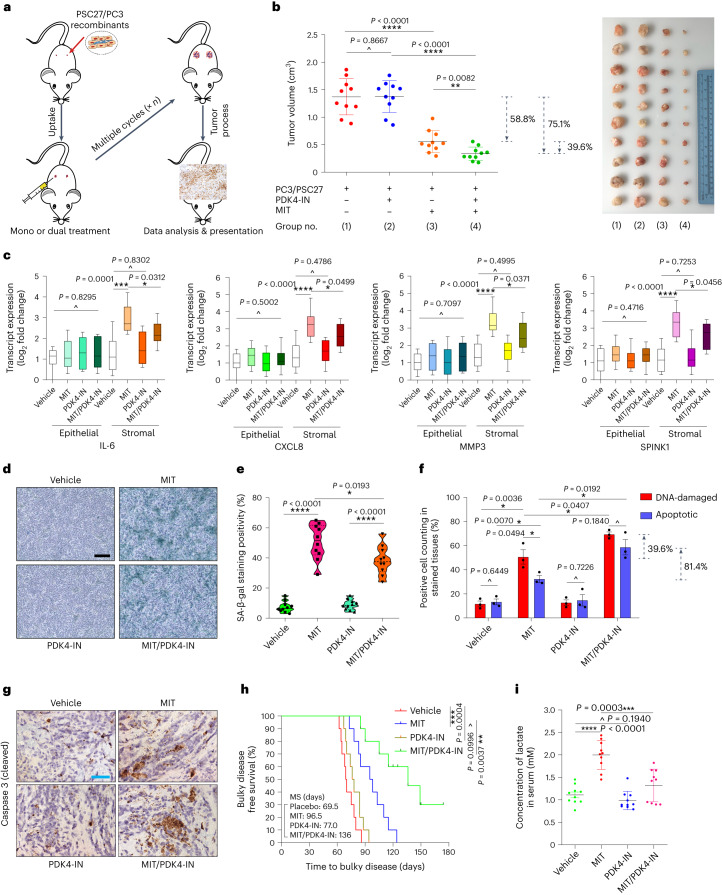
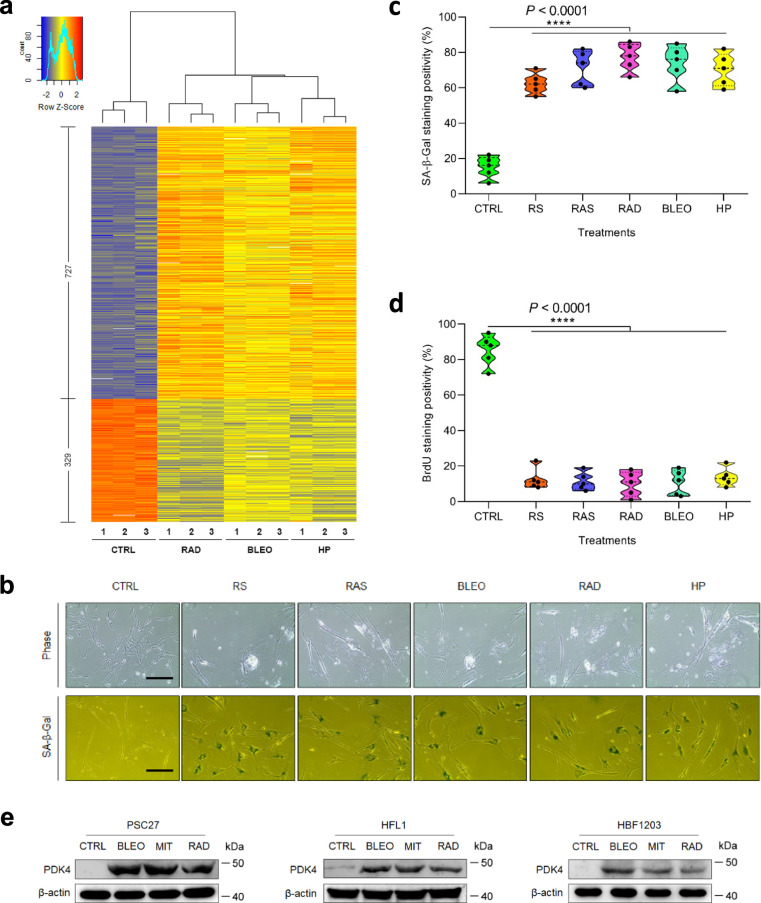
Senescent cells remain metabolically active, but their metabolic landscape and resulting implications remain underexplored. Here, we report upregulation of pyruvate dehydrogenase kinase 4 (PDK4) upon senescence, particularly in some stromal cell lines. Senescent cells display a PDK4-dependent increase in aerobic glycolysis and enhanced lactate production but maintain mitochondrial respiration and redox activity, thus adopting a special form of metabolic reprogramming. Medium from PDK4+ stromal cells promotes the malignancy of recipient cancer cells in vitro, whereas inhibition of PDK4 causes tumor regression in vivo. We find that lactate promotes reactive oxygen species production via NOX1 to drive the senescence-associated secretory phenotype, whereas PDK4 suppression reduces DNA damage severity and restrains the senescence-associated secretory phenotype. In preclinical trials, PDK4 inhibition alleviates physical dysfunction and prevents age-associated frailty. Together, our study confirms the hypercatabolic nature of senescent cells and reveals a metabolic link between cellular senescence, lactate production, and possibly, age-related pathologies, including but not limited to cancer.


Conflict of interest statement

The authors declare no competing interests.

Figures

Fig. 1
Fig. 1. Genotoxicity induces PDK4 upregulation and a full-spectrum SASP.
a, Expression profiling of primary human stromal line PSC27 by microarray. CTRL, control; RAD, radiation; BLEO, bleomycin. Red highlight indicates SASP factors. Purple arrow indicates PDK4. Microarray data are adapted from Sun et al. with permission from Nature Medicine. b, Quantitative PCR with reverse transcription to determine PDK4 expression. Signals are normalized to CTRL. RS, replicative senescence; RAS, lentiviral transduction of human oncogene HRASG12V. Data are shown as mean ± s.d. in scatter-dot blot. c, Immunoblot analysis of PDK4 expression as delineated in b. GAPDH, loading control. d, Comparative RT–PCR assay of PDK4 expression after treatment of PSC27 or prostate epithelial cells. Signals are normalized to CTRL. BPH1, M12, PC3, DU145, LNCaP and VCaP, human epithelial lines of prostate origin. e, Comparative RT–PCR assay of PDK4 expression. WI38, HFL1, HBF1203 and BJ, human stromal lines of different origins; MIT, mitoxantrone. f, A time-course RT–PCR assessment of the expression of PDK4 and a subset of typical SASP factors. Numeric numbers indicate the individual days after treatment (indexed at the top line). g, Immunoblot measurement of PDK4 expression at the protein level at the individual time points as indicated. β-actin, loading control. h, Comparative appraisal of human PDK family expression at transcript level in PSC27. Signals are normalized to untreated sample per gene. CXCL8, experimental control as a hallmark SASP factor. i, Immunoblot assessment of the expression of PDK family members at protein level. β-actin, loading control. j. Immunoblot analysis of the expression of indicated factors at protein level after treatment of cells with BLEO in the absence or presence of several chemical inhibitors as indicated. β-actin, loading control. Data in b,df,h are shown as mean ± s.d. and represent three biological replicates. Data in c,g,i,j are representative of two independent experiments. P values were calculated by one-way ANOVA (b,f), two-way analysis of variance (ANOVA) (d) or two-sided unpaired Student’s t-tests (e,f,h). ^P > 0.05; *P < 0.05; **P < 0.01; ***P < 0.001; ****P < 0.0001. Source data
Fig. 2
Fig. 2. Senescent cells display a distinct glucose metabolism profile.
a, A schematic molecular roadmap briefly outlining the landscape of glucose metabolism in mammalian cells. b, Partial metabolic profiling (glycolysis) of senescent cells induced by BLEO and incubated with uniformly labeled [U-13C6]-glucose. Results from GC–MS analysis of metabolites as indicated. c, Partial metabolic profiling (TCA cycle) of senescent cells induced by BLEO and incubated with uniformly labeled [U-13C6]-glucose. Results from GC–MS analysis of metabolites as indicated. d, Heat map depicting changes of glucose catabolism-associated metabolites as measured for senescent cells by GC–MS. e, Representative TEM images showing the ultrastructural profile of mitochondria in PSC27. L, low resolution; H, high resolution. Scale bars, 1.0 μm. f, Measurement of extracellular fluids with an XF24 Extracellular Flux Analyzer. Pyruvate and lactate were assayed. g, OCR of stromal cells was measured using an XF24 Extracellular Flux Analyzer. All Seahorse data were normalized with cell numbers, with metabolic parameters automatically calculated by WAVE software equipped in Seahorse. OCR, oxygen consumption rate; Oligo, oligomycin; FCCP, carbonyl cyanide 4-(trifluoromethoxy) phenylhydrazone; Rot, rotenone; Ant, antimycin; IN, PDK4-IN (PDK4 inhibitor, 5 μM). h, Measurement of ATP production by PSC27. ATP production measured as (last rate measurement before Oligo injection) minus (minimum rate measurement after Oligo injection). i, Assessment of basal respiration as an essential element of the senescence-associated metabolism program. j, Examination of maximal respiration as another fundamental element of the senescence-associated metabolism program. k, Assessment of non-mitochondrial oxygen consumption in stromal cells. l, Measurement of pH values in stromal cells. m, Determination of lactate production in stromal cells. n, Examination of the leak of H+ (proton) from mitochondria of stromal cells. Data in all bar plots are shown as mean values ± s.d. and represent 3 (l,m) or 3–6 (b,c,fk,n) biological replicates. P values were calculated by two-sided unpaired Student’s t-tests (b,c,f,hn). ^P > 0.05; *P < 0.05; **P < 0.01; ***P < 0.001; ****P < 0.0001. Source data
Fig. 3
Fig. 3. Senescent cells exhibit altered NAD+/NADH and lactate production.
a, Glucose uptake measurement of PSC27 upon senescence. DTX, docetaxel; PTX, paclitaxel; VBL, vinblastine; BLEO, bleomycin; DOX, doxorubicin; MIT, mitoxantrone. b, Examination of pH value of cells treated in a. Representative images of CM from proliferating and senescent cells, respectively (right). c, Schematic illustration of potential changes in cell metabolic activities during stress-induced senescence. d, Graphic model for design of SoNar. Fluorescence ratios plotted against the NAD+/NADH ratio at 400 μM total NAD (right). Fluorescence ratios normalized to the CTRL condition (n = 3). iNapc, a control sensor, which displays pH sensitivities similar to SoNar. e, Technical overview for in vitro imaging of living cells with confocal laser-scanning microscopy. f, Excitation spectra of purified SoNar in the control condition (black) and after addition of 20 μM NAD+ (green) or NADH (orange), normalized to the peak intensity in control. Emission measured at 530 nm. g, Fluorescence imaging of SoNar in CTRL and senescent (BLEO) cells, in the absence or presence of PDK inhibitor (IN). Scale bar, 20 μm. h, Quantification of SoNar or iNapc fluorescence (n = 30 cells). SoNar (left). iNapc (right). i, Schematic representation of molecular design for lactate sensor FiLa. Lactate titration curves (right). Data are normalized to initial value (n = 3). FiLa-C, a control sensor, which displays pH sensitivities similar to FiLa. j, Excitation spectra of purified FiLa in control (black) and saturated with lactate (dark red). k, Fluorescence imaging of FiLa in CTRL and senescent (BLEO) cells. Scale bar, 20 μm. l, Quantification of FiLa (left) and FiLa-C (right) fluorescence (n = 30 cells). Data in all bar plots are shown as mean ± s.d. and represent 3 (a,b) or 30 biological replicates (h,l). Pseudocolors were employed to allow straightforward visualization of the fluorescence images (g,k). P values were calculated by one-way ANOVA (a,b) or two-sided unpaired Student’s t-tests (h,l). ^P > 0.05; *P < 0.05; **P < 0.01; ***P < 0.001; **** P < 0.0001. Source data
Fig. 4
Fig. 4. Stromal PDK4 expression enhances cancer cell malignancy.
a, Heat map depicting differentially expressed human transcripts in PCa lines after a 3-d culture with the CM of PSC27 cells overexpressing PDK4 (PSC27-PDK4). In contrast to cancer cells cultured with control CM (PSC27-CTRL), the number of genes up- and downregulated per PCa line are indicated. Intensity of tracing lines consistent with the relative expression fold change averaged per up- or downregulated genes. b, Graphical visualization of pathways by Gene Ontology profiling (pie chart depicting biological processes). Genes significantly enriched in upregulated list were sorted according to fold change in PC3 cells exposed to the CM of PSC27-PDK4 cells. c, Venn diagram displaying the overlap of transcripts co-upregulated in PC3, DU145 and M12 cells (per 2 or 3 lines) upon treatment with the CM from PSC27-PDK4 in contrast to those treated with the CM of PSC27-CTRL. d, Summary of transcripts co-upregulated in PCa lines (top ranked, with a fold change ≥ 5.0 and false discovery rate (FDR) < 0.01) upon treatment with the CM of PSC27-PDK4. Red highlight indicates HTR2B. e, Measurement of PCa line proliferation in different conditions. Human PDK4 was knocked down from PSC27 cells. C, scramble control. f, Examination of migration activity in different conditions. Cells were treated in a manner similar to that described in e. g, Evaluation of invasion ability in different conditions. Cells were treated in a manner similar to that described in e. h, Determination of resistance to MIT upon exposure to the CM of PSC27. MIT, mitoxantrone, a chemotherapeutic agent applied at the half-maximum inhibitory concentration (IC50) concentration per PCa line. i, Dose–response curves plotted from MIT-based viability assays of PC3 exposed to the CM of PSC27 and treated by MIT. P values indicate the significance of difference between shRNAC-SEN and shRNAPDK4-SEN groups. Data in all bar and curve plots (ei) are shown as mean values ± s.d. and averaged from three biological replicates. P values were calculated by two-sided unpaired Student’s t-tests (eh) or one-way ANOVA (ei). ^P > 0.05. *P < 0.05. **P < 0.01. ***P < 0.001. Source data
Fig. 5
Fig. 5. Therapeutically targeting PDK4 promotes anticancer outcome.
a, Schematic workflow of experimental procedure. Two weeks after subcutaneous implantation and tissue recombinant uptake, animals received metronomic treatments. b, Statistical profiling of tumor end volumes. PC3 xenografted alone or together with PSC27 to the hind flank of animals. MIT and PDK4-IN administered either alone or concurrently to induce tumor regression. Representative tumor images (right). c, Transcript assessment of canonical SASP factors in stromal cells isolated from tumors. Tissues from animals subject to LCM isolation, total RNA preparation and expression assays. The group measured as of the lowest value was used as normalization baseline per factor. d, Representative IHC images of SA-β-gal staining profile of tissues isolated from placebo or drug-treated animals. Scale bar, 100 μm. e, Comparative statistics of SA-β-gal staining for mouse tissues described in d. f, Statistical assessment of DNA-damaged and apoptotic cells in tumor specimens analyzed in d. Values are presented as a percentage of cells positively stained by IHC with antibodies against γ-H2AX or caspase 3 (cleaved). g, Representative IHC images of caspase 3 (cleaved) in tumors at the end of therapeutic regimens. Biopsies of placebo-treated animals served as negative controls for drug-treated mice. Scale bars, 100 μm. h, Bulky DFS plotted against the time of implantation until animal death attributed to advanced bulky disease development. MS, median survival. P values calculated by two-sided log-rank (Mantel–Cox) tests. i, Measurement of circulating lactate in peripheral blood of mice that underwent therapeutic regimen involving MIT and/or PDK4-IN. Data in all dot, bar or violin graphs are shown as mean ± s.d. For animal assays, n = 10 (b,c,e,h,i) and n = 3 (f). For the box-and whiskers-graphs (c), minima, maxima, median, 25th and 75th percentiles are shown, with whiskers indicating smallest and largest values. P values were calculated by two-sided unpaired Student’s t-tests (b,c,e,f,i) or log-rank (Mantel–Cox) tests (h). MIT, mitoxantrone. ^P > 0.05; *P < 0.05; **P < 0.01; ***P < 0.001; ****P < 0.0001. Source data
Fig. 6
Fig. 6. Lactate indicates in vivo SASP development and predicts adverse clinical outcome.
a, Abundance of lactate in serum of untreated and chemo-treated patients with PCa. Data are derived from ELISA and shown as mean ± s.d. n = 20. b, Abundance of CXCL8 protein in patient serum analyzed in a. Data are from an ELISA and are presented as mean ± s.d.; n = 20. c, Abundance of SPINK1 protein in patient serum analyzed in a. Data are from an ELISA and are presented as mean ± s.d.; n = 20. d, Scatter-plot showing correlation between lactate and CXCL8 in the serum of individual patients described in ac. Pearson’s correlation coefficient, P value and confidence interval indicated. e, Scatter-plot showing correlation between lactate and SPINK1 in the serum. Pearson’s correlation coefficient, P value and confidence interval indicated. f, Heat map depicting overall correlation between serum lactate, stromal/serum CXCL8, stromal/serum SPINK1 in chemo-treated patients (n = 10). Raw scores of stromal factors from independent pathological reading of primary tumors, with those of serum factors from ELISA. Color key, relative expression. g, Kaplan–Meier survival analysis of chemo-treated patients with PCa. DFS stratified according to circulating lactate in serum (low, average score <2, dark green; high, average score ≥2, dark red). DFS represents length (months) of period calculated from the date of chemotherapy to point of first time disease relapse. Survival curves generated according to the Kaplan–Meier method, with a P value calculated using a log-rank (Mantel–Cox) test; n = 10 per group. DFI, disease-free interval; HR, hazard ratio. h, TCGA data showing alterations of PDK4 in a variety of human cancer types at genomic level, including mutation, amplification and deep deletion. Alteration frequency displayed in percentage. i, Graphic illustration to summarize metabolic reprogramming of senescent cells and formation of lactate-enriched microenvironment in a genotoxic setting and functional implications of the metabolite lactate in promoting cancer resistance and potentially other age-related conditions. Data in ac are shown as mean ± s.d. P values were calculated by two-sided unpaired Student’s t-tests (ac), Pearson correlation tests (d,e) or log-rank (Mantel–Cox) tests (g). ***P < 0.001; ****P < 0.0001. Source data
Fig. 7
Fig. 7. Lactate activates ROS production via NOX1 and enhances SASP intensity.
a, Biochemical scheme illustrating intracellular mechanisms of ROS generation upon exposure of cells to lactate, a small molecule metabolite derived from either autocrine or paracrine pathways in-tissue microenvironment. b, Examination of ROS biogenesis with DCFH2-DA, a cell-permeable fluorescent probe sensitive to changes in cellular redox state. Experiments performed 1 d after treatment of PSC27 cells with rotenone (10 μM), CCCP (10 μM) and/or lactate (10 mM). Representative images (left). Scale bar, 10 μm. Statistics (right). DMSO, dimethylsulfoxide. c, Immunoblot assay of representative NOX molecules and DDR signaling after exposure of cells to different treatments. β-actin, loading control. d, Measurement of ROS production with DCFH-DA. Experiments performed 1 d after treatment of BLEO-induced senescent PSC27 cells with ML-090, PDK4-IN and APX-115. Representative images (left). Scale bar, 10 μm. Statistics (right). e, Confocal microscopy of immunofluorescence staining of PSC27 cells treated by BLEO and/or PDK4-IN. Primary antibodies against γH2AX and CXCL8 employed (red and green, respectively, after secondary antibody incubation and laser excitation; blue, 4,6-diamidino-2-phenylindole (DAPI)). Scale bar, 10 μm. f, Comparative statistics of DDR in PSC27 cells treated by agents as indicated in e. DDR was classified into four sub-categories including 0 foci, 1–3 foci, 4–10 foci and >10 foci per cell. g, Immunoblot analysis of the expression of target molecules after exposure of cells to different treatments. CXCL8, a hallmark SASP factor; β-actin, loading control. h, Heat map depicting expression change pattern of genes in the transcriptome-wide range. The first 50 genes most upregulated upon BLEO treatment are shown, with their changes in the presence of PDK4-IN lined up correspondingly. Red stars indicate representative SASP factors. The data in the bar graphs of b and d are shown as mean ± s.d. For datasets in b and d, n = 3. Data in c,g are representative of two independent experiments. P values were calculated by two-sided unpaired Student’s t-tests (b,d) or two-way ANOVA (f). ^P > 0.05; *P < 0.05; **P < 0.01; ***P < 0.001; ****P < 0.0001. Source data
Fig. 8
Fig. 8. PDK4-targeting alleviates frailty and extends lifespan of aged animals.
a, Schematic design of physical functional examinations for 20-month-old C57BL/6J mice receiving preclinical treatment by vehicle, PDK4-IN or PCC1 (biweekly) for consecutive 4 months. PCC1, senolytic control. b, Representative images of SA-β-gal staining of livers from young and aged mice treated with vehicle, PDK4-IN or PCC1 as described in a. Scale bar, 200 μm. c, Quantification and comparison of SA-β-gal staining positivity in liver tissues. d, Quantification and comparison of SA-β-gal staining positivity in lung tissues. e, Quantification and comparison of SA-β-gal staining positivity in prostate tissues. f, Quantification and comparison of SA-β-gal staining positivity in myocardium tissues. g, Representative hematoxylin and eosin (H&E) staining (left) and quantification of alveolar size (right). Scale bar, 200 μm. h, Quantitative measurement of maximal walking speed (relative to baseline) of experimental mice. im, Quantitative measurement of maximal walking speed (relative to baseline) (i), performance time (j), grip strength (k), treadmill endurance (l) and daily activity (m) of 20-month-old animals after the 4-month treatment. n, Measurement of circulating lactate (in mM) in the peripheral blood of mice after the 4-month treatment as described in a. o, Schematic design for lifespan appraisal of mice (both sexes) at 25–26 months of age. p, Post-treatment survival curves of C57BL/6J animals treated biweekly with vehicle (n = 58; 31 males and 27 females), PDK4-IN (n = 55; 28 males and 27 females) or PCC1 (n = 51; 26 males and 25 females) starting at 25–26 months of age. Animals in each group were adapted in three (young) or four (aged) independent cages. For preclinical assays, n = 5 per group (cf) and n = 10 per group (gn). Data in all bar and dot graphs are shown as mean ± s.d. (cg,n). For box-and-whisker graphs (hm), the minima, maxima, median, 25th and 75th percentiles are shown, with whiskers indicating smallest and largest values. P values were calculated by two-sided unpaired Student’s t-tests (cf,gn) or log-rank (Mantel–Cox) tests (p). ^P > 0.05; *P < 0.05; **P < 0.01; ***P < 0.001; ****P < 0.0001. Source data
Extended Data Fig. 1
Extended Data Fig. 1. Profiling of global gene expression and senescence induction upon in vitro treatment.
a. Heat map depiction of expression changes for transcripts up- or downregulated in PSC27 stromal cells after induction of senescence with individual agents. b. Senescence assessment with SA-β-Gal staining of human stromal cells that experienced either lentiviral transduction of oncogenic HRASG12V (RAS) or anticancer treatments (RS, RAD, BLEO and HP) as indicated. Representative images are shown. Scale bars, 50 μm. c. Comparative statistics of senescence positivity upon appraisal with SA-β-Gal staining of stromal cells as described in b. d. Comparative statistics of senescence induction upon evaluation of BrdU staining positivity of PSC27 cells as described in b. e. Immunoblot analysis of PDK4 induction in PSC27, HFL1 and HBF1203 cell lines. In each line, cells were exposed to bleomycin (BLEO), mitoxantrone (MIT) or ionizing radiation (RAD). β-actin, loading control. Data in c and d are presented as violin graphs and represent 5 biological replicates. Data in e are representative of two independent experiments. P values were calculated by one-way ANOVA (c-d). **** P < 0.0001. Source data
Extended Data Fig. 2
Extended Data Fig. 2. PDK4 is expressed in stroma after chemotherapy and negatively correlated with post-treatment survival.
a. Representative images of PDK4 expression in biospecimens of human prostate cancer (PCa) patients after histological examination. Left, untreated; right, chemo-treated. Rectangular regions selected in upper images per staining amplified into lower images. Scale bars, 100 μm. b. Pathological assessment of stromal PDK4 expression in PCa tissues. Patients pathologically assigned into 4 categories per IHC staining intensity of PDK4 in stroma. 1, negative; 2, weak; 3, moderate; 4, strong expression. Left, statistical comparison. Right, representative images of each category. EL, expression level. Scale bar, 100 µm. c. Boxplot summary of PDK4 transcript expression by qRT-PCR analysis upon laser capture microdissection of cells from tumor and stroma, respectively. Signals normalized to the lowest value in untreated epithelium group, with comparison performed between untreated and treated samples per cell lineage. d. Comparative analysis of PDK4 expression between epithelial cells before and after chemotherapy. Each dot represents an individual patient, with the data of “before” and “after” connected to allow direct assessment of PDK4 induction in a same patient. e. Comparative analysis of PDK4 expression at transcription level between stromal cells collected before and after chemotherapy. Presentation follows d. f. Pathological correlation between designated factors in the stroma of PCa patients after treatment. Scores from assessment of molecule-specific IHC staining, with expression levels colored to reflect low (blue) via modest (turquoise) and fair (yellow) to high (red) signal intensity. g. Kaplan–Meier analysis. Disease-free survival (DFS) stratified according to PDK4 expression. DFS represents length (months) of period calculated from date of PCa diagnosis to point of first time disease relapse. HR, hazard ratio. PCa patients (48 totally) in analysis from treated group of b. Data in all bar plots are shown as mean ± S.D. and represent 3 biological replicates. P values were calculated by two-sided unpaired Student’s t-tests (c-e), two-way ANOVA (b) or Log-rank (Mantel–Cox) tests (g). ^, P > 0.05. *** P < 0.001. **** P < 0.0001. Source data
Extended Data Fig. 3
Extended Data Fig. 3. Senescent cells manifest glucose metabolic properties distinct from normal and cancer cells.
a-g. Analysis of gas chromatography-mass spectrometry (GC–MS) to determine isotope labeling of individual specific metabolites. Retrieved data comprised mass intensities for the lightest isotopomer (without any heavy isotopes, M0) and isotopomers with increasing unit mass (up to M6) relative to M0. Mass distributions normalized by dividing by the sum of M0 to M6 and corrected for the natural abundance of heavy isotopes of the elements H, N, O, Si and C, with matrix-based probabilistic methods as described in Methods, and implemented in MATLAB. h. Statistic comparison of citrate M2 and pyruvate M3 in control and senescent cells induced by BLEO treatment. i. Extracellular acidification rate (ECAR) profile of stromal cells was determined using a Glycolysis Stress Test kit. j. Measurement of the glycolyic capacity of stromal cells. Data derived from ECAR assays and presented in mpH/min. k. Assessment of the glycolytic reserve of stromal cells. Data derived from ECAR assays and presented in mpH/min. l. Principal component analysis (PCA) of global metabolites assayed by metabolite profiling approaches. m. Quantitative RT-PCR to examine expression of glucose uptake and metabolism-associated genes after PSC27 cells were subject to individual treatment as indicated. n. Evaluation of cellular senescence of PSC27 cells by SA-β-Gal staining. Left, comparative statistics. Right, representative images. Scale bar, 100 μm. o. Immunoblot analysis of PDK4, CXCL8, IL6 expression in stromal cells expressing exogenous PDK4. Vector, control cells transduced with an empty vector. PDK4, cells transduced with a PDK4 construct. Data in all bar plots are shown as mean ± S.D. and represent 3-5 biological replicates. Data in o are representative of two independent experiments. P values were calculated by two-sided unpaired Student’s t-tests (a-h, j-k, m-n). ^, P > 0.05. * P < 0.05. ** P < 0.01. *** P < 0.001. **** P < 0.0001. Source data
Extended Data Fig. 4
Extended Data Fig. 4. Senescent stromal cells reprogram glucose metabolism via PDK4 expression.
a. Measurement of lactate production by comparing proliferating and senescent PSC27 cells as well as stromal and typical PCa lines (PC3 and DU145). b. OCR assessment of human stromal cells with XF24 extracellular flux analyzer. Oligo, oligomycin. FCCP, carbonyl cyanide 4-(trifluoromethoxy) phenylhydrazone. Rot, rotenone. Ant, antimycin. c. Examination of ATP upon bleomycin (BLEO)-induced senescence. d. Evaluation of basal respiration of indicated lines. e. Appraisal of maximal respiration of indicated lines. f. Assessment of non-mitochondrial oxygen consumption of indicated lines. g. Glucose uptake measurement of PSC27 cells transduced with a PDK4 construct or depleted of PDK4 via small hairpin RNA. OE, overexpression. C, scramble control. h. Lactate production assessment of PSC27 sublines as described in g. i. Relative TG production assay of PSC27 sublines as described in g. j. Determination of the pH of conditioned media of PSC27 sublines as described in g. k. Glucose uptake measurement of PSC27 cells upon BLEO-induced senescence (TIS) in the presence or absence of PDK4, the latter mediated by shRNA knockdown. l. Lactate production measurement of PSC27 cells as described in k. m. Relative TG production assay of PSC27 cells as described in k. n. Determination of the pH of conditioned media of PSC27 cells as described in k. o. Immunoblot assessment of PDK4 expression upon transduction of cells with constructs encoding shRNAs. C, scramble. LE, long exposure. p. Comparative RT-PCR assay of PDK4, CXCL8, glycolysis-related genes (Glut1, MCT4, HIF1α, PGK1 and PGI) as well as and TCA-related genes (CS, IDH2, IDH3A and IDH3B) expression in human stromal cells 7 d after treatments. Data in all bar plots are shown as mean ± S.D. and represent 3 (a, d, g-n, p) or 3-5 (b, c, e, f) biological replicates. Data in o are representative of two independent experiments. P values were calculated by two-sided unpaired Student’s t-tests (a-n, p) or one-way ANOVA (g-n). ^, P > 0.05. * P < 0.05. ** P < 0.01. *** P < 0.001. **** P < 0.0001. Source data
Extended Data Fig. 5
Extended Data Fig. 5. PDK4+ stromal cells induce substantial changes of PCa cell expression and malignancy.
a. Graphical visualization of pathways by GO profiling (pie chart depicting biological processes). Those significantly enriched genes in the upregulated list were sorted according to their fold change in DU145 cells exposed to the CM of PSC27-PDK4 stromal cells. b. Graphical visualization of pathways by GO profiling in a manner resembling that represented in a. Those significantly enriched genes in the upregulated list were sorted according to their fold change in M12 cells exposed to the CM of PSC27-PDK4 stromal cells. c. Appraisal of the proliferation capacity of PCa lines upon exposure to the CM of PSC27 stromal cells. PDK4 knockdown was performed through shRNA-encoding constructs. C, scramble control. d. Measurement of the migration ability of PCa lines upon exposure to the CM of PSC27 stromal cells. e. Examination of the invasiveness of PCa lines upon exposure to the CM of PSC27 stromal cells. f. Determination of the resistance of PCa lines to MIT upon exposure to the CM of PSC27 stromal cells. MIT, mitoxantrone, a chemotherapeutic agent applied at the IC50 concentration per cell line established prior to the assay. g. Dose-response curves (non-linear regression/curve fit) plotted from MIT-based viability assays of PC3 exposed to the CM of PSC27 stromal cells and treated by a range of concentrations of MIT. P values indicate the significance of difference between PDK4/shRNAC and PDK4/shRNAPDK4 groups. Data in all bar and curve plots (c-g) are shown as mean ± S.D. and represent 3 biological replicates. All P values were calculated by two-sided unpaired Student’s t-tests (c-f) or one-way ANOVA (c-g). ^, P > 0.05. *, P < 0.05. **, P < 0.01. ***, P < 0.001. ****, P < 0.0001. Source data
Extended Data Fig. 6
Extended Data Fig. 6. Metabolic landscape of cancer cells upon uptake of exogenous lactate.
a. Partial metabolic profiling (glycolysis) of recipient prostate cancer cells (PC3) exposed to exogenous lactate pre-labeled with a stable isotope tracer [U-13C6]. Results from gas chromatography-mass spectrometry (GC–MS) analysis of metabolites including lactate, pyruvate, alanine, citrate, glutamine, α-KG, succinate, fumarate, malate and aspartate are shown. Syrosingopine, a dual inhibitor of lactate transporters including MCT1 and MCT4. b. A partial metabolic profiling (glycolysis) of recipient breast cancer cells (MDA-MB-231) exposed to exogenous lactate pre-labeled with the stable isotope tracer [U-13C6]. Results derived from cell treatments and gas chromatography-mass spectrometry (GC–MS) analysis of metabolites as indicated in a. c. A landscape map showing overall profile of glucose metabolism-associated catabolic metabolites in PC3 and MDA-MB-231 cells upon uptake of [U-13C6]-labeled lactate in culture. d. Immunoblot assessment of MCT1 and MCT4 expression in PC3 cells upon exposure to [U-13C6]-labeled lactate in culture. β-actin, loading control. e. Immunoblot assessment of MCT1 and MCT4 expression in MDA-MB-231 cells upon exposure to [U-13C6]-labeled lactate in culture. β-actin, loading control. f. Measurement of ATP production by PC3 cells. After exposure to lactate (10 mM), syrosingopine (10 μM), or both, cells were subject to ATP production appraisal. ATP production was measured as (last rate measurement before oligomycin injection) minus (minimum rate measurement after oligomycin injection). L, lactate. S, syrosingopine. g. Measurement of PC3 cell proliferation. Cells treated as described in f before examination of proliferation in culture conditions. L, lactate. S, syrosingopine. Data in all bar plots are shown as mean ± S.D. Data in a-c, g represent 3 biological replicates, while those in f represent 5 biological replicates. Data in d-e are representative of two independent experiments. All P values were calculated by two-sided unpaired Student’s t-tests (a-c, f-g). *, P < 0.05. **, P < 0.01. ***, P < 0.001. ****, P < 0.0001. Source data
Extended Data Fig. 7
Extended Data Fig. 7. Schematic design of preclinical trial and comparative gene expression analysis.
a. Statistics of tumor volumes in mice carrying cancer cells (PC3) and stromal cells (PSC27) as indicated. Tumor volumes measured at end of an 8-week period. b. Statistics of tumor volumes before animal exposure to chemotherapeutic agent mitoxantrone for senescence induction. c. Experimental workflow. Human cells inoculated subcutaneously to NOD/SCID males 2 weeks before chemotherapy. Agents delivered on 1 st day of each week starting from 3 rd week, then given every other week, totally 3 doses. Animals sacrificed 8 weeks later, tumors measured and tissues assessed. d. Transcript expression profiling of indicated factors. Individual cell types isolated from tumor tissues via LCM. Data representative of 3 biological replicates (n = 10 animals per group). e. Statistics of tumor volumes. LNCaP cells xenografted together with PSC27 to the hind flank, with MIT and/or PDK4 inhibitor PDK4-IN delivered via intravenous injection in a manner resembling PC3/PSC27 regimen. f. Statistics of tumor volumes. 22Rv1 cells were xenografted together with PSC27 to the hind flank, with MIT and/or PDK4-IN delivered via intravenous injection in a manner resembling PC3/PSC27 regimen. g. Statistics of tumor volumes. MDA-MB-231 (MDA) cells were xenografted together with HBF1203 to the hind flank, with DOX and/or PDK4-IN delivered via intravenous injection in a manner resembling PC3/PSC27 regimen. h. Statistics of circulating lactate concentration in serum. Peripheral blood of mice subject to lactate measurement at the end of regimen. PC3 and/or PSC27 cells were exposed to MIT in culture for senescence induction before implantation. Data in a, b, d-h are shown as mean ± S.D. and represent 3 biological replicates. For box and whiskers graphs (d), the minima, maxima, median, 25th and 75th percentiles are shown, with whiskers indicating smallest and largest values. For each dataset, n = 10 per treatment arm. P values were calculated by two-sided unpaired Student’s t-tests (a-b, d-h) or one-way ANOVA (a-b). MIT, mitoxantrone. DOX, doxorubicin. ^, P > 0.05. *, P < 0.05. **, P < 0.01. ***, P < 0.001. ****, P < 0.0001. Source data
Extended Data Fig. 8
Extended Data Fig. 8. Impact of PDK4 targeting on SASP expression, ROS production and DNA damage intensity.
a. Transcript-based quantitative examination of typical SASP factors expressed by PSC27 cells upon treatment with the genotoxic agent BLEO and/or PDK4 inhibitor PDK4-IN (IN). Data normalized to CTRL group per factor. b. Measurement of ROS levels with DCFH-DA, a cell-permeable fluorescent probe sensitive to alterations in cellular redox state. PSC27 cells allowed to reach replicative exhaustion (RS), engineered to overexpress HRasG12V (OIS) or subject to genotoxic stress by doxorubicin (TIS). Scale bar, 10 μm. c. Relative quantification and statistical comparison of DCF signals in each sample as described in b. d. Comparative statistics of DDR intensity in PSC27 cells undergoing RS and/or treated by PDK4-IN. DDR classified into four sub-categories including 0 foci, 1-3 foci, 4-10 foci and >10 foci per cell. e. Comparative statistics of DDR intensity in PSC27 cells undergoing HRasG12V-induced OIS and/or treated by PDK4-IN. f. Comparative statistics of DDR intensity in PSC27 cells undergoing DOX-induced TIS and/or treated by PDK4-IN. g. Quantitative RT-PCR-based transcript assay of representative SASP factors expressed by PSC27 cells undergoing RS and/or upon treatment with PDK4-IN. h. Quantitative RT-PCR-based transcript assay of representative SASP factors expressed by PSC27 cells upon senescence induced by the oncogene HRasG12V and/or treatment with PDK4-IN. i. Quantitative RT-PCR-based transcript assay of representative SASP factors expressed by PSC27 cells upon senescence induced by the genotoxic agent DOX and/or treatment with PDK4-IN. Data in all bar plots are shown as mean ± S.D. and represent 3 biological replicates. All P values were calculated by two-sided unpaired Student’s t-tests (a, c, g-i) or two-way ANOVA (d-f). ^, P > 0.05, *, P < 0.05. **, P < 0.01. ***, P < 0.001. ****, P < 0.0001. Source data
Extended Data Fig. 9
Extended Data Fig. 9. Preclinical profiling of ROS generation, liver physiological index, genome-wide expression and physical function of aged mice.
a. Immunoblot analysis of NOX1 expression across organ types in young vs aged mice. Y, young. A, aged. Myo, myocardium. GAPDH, loading control. b. Measurement of ROS levels with DCFH-DA. Left, representative images. Right, statistical comparison. Scale bar, 20 μm. c. Heat map depicting expression pattern of genes significantly upregulated upon BLEO-induced senescence but subject to counteraction by PDK4-IN. Red stars, representative SASP factors. d. GSEA plot of a significant gene set in SASP spectrum. FDR, false discovery rate; NES, normalized enrichment score. e. The serum levels of alanine transaminase (ALT) from young mice and their aged counterparts that received biweekly treatment as indicated at 20 months of age for 4 consecutive months. f. The serum levels of aspartate transaminase (AST). g. The serum levels of lactate dehydrogenase (LDH). h. Measurement of body weights. i. Assessment of daily food intake. j. Whole-life survival curves of C57BL/6 J mice treated biweekly with vehicle (n = 68; 37 males, 31 females), PDK4-IN (n = 66; 33 males, 33 females) or PCC1 (n = 67; 35 males, 32 females) starting at 24-27 months of age. k-l. Maximal walking speed (k) and hanging endurance (l) averaged over the last 2 months of life. m. Appraisal of lifespan for the longest living mice (top 20) per group. Animals were adapted in 3 (young) or 4 (aged) independent cages. For in vitro experiments, n = 3 for b. For preclinical assays, n = 10/group for e-i and k-m. Data in b, e-i and k-m are shown as mean ± S.D. For box and whiskers graphs (h-i, k-l), the minima, maxima, median, 25th and 75th percentiles are shown, with whiskers indicating smallest and largest values. P values were calculated by two-sided unpaired Student’s t-tests (b, e, f, g, m), one-way ANOVA (h-i, k-l) or Log-rank (Mantel–Cox) tests (j). For data in d, P value was calculated by one-way ANOVA with Tukey’s post hoc comparison. ^, P > 0.05. *, P < 0.05. **, P < 0.01. ***, P < 0.001. ****, P < 0.0001. Source data
Extended Data Fig. 10
Extended Data Fig. 10. Late-life PDK4 targeting does not change death causes but restrains SASP and minimizes oxidative stress.
a-b. Pie charts profiling the ultimate causes of death of C57BL/6 J mice (males and females) that received vehicle (a) or PDK4-IN (b) biweekly treatment starting from 25–26 months of age. Note, there was no significant difference between vehicle- and PDK4-IN-treated groups upon analysis using either Chi-square or Fisher’s exact tests. c. Overall disease burden of mice at death. For both sexes, n = 50 per arm. For males (♂), n = 26 for vehicle, n = 25 for PDK4-IN and n = 26 for PCC1. For females (♀), n = 24 for vehicle, n = 25 for PDK4-IN and n = 24 for PCC1. d. Tumor burden of animals at death. For both sexes, n = 30 per arm. For males (♂), n = 15 for vehicle, n = 16 for PDK4-IN and n = 17 for PCC1. For females (♀), n = 15 for vehicle, n = 14 for PDK4-IN and n = 13 for PCC1. e. qRT-PCR profiling of the SASP and senescence marker expression in liver tissues of young (6-month-old, untreated), aged (25–26-month-old) vehicle-treated and aged (25–26-month-old) PDK4-IN-treated animals, respectively. f-h. Measurement of circulating levels of hallmark SASP factors IL6 (f), AREG (g) and CSF3 (h) in mouse serum by ELISA assays. i. Quantitative measurement of the SASP and senescence marker expression in CD3+ peripheral T cells of experimental mice described in e-h. j. Assessment of 4-hydroxynonenal (HNE) adducts, a marker of lipid peroxidation and oxidative stress by ELISA measurement with tissue lysates of the liver. k. Determination of the ratio of reduced (GSH) to oxidized (GSSG) glutathione measured as an index oxidative stress. Data in bar graphs are shown as mean ± S.D. and represent 3 biological replicates (n = 3 independent assays for e-k). P values were calculated by two-sided unpaired t-tests (e-k) or one-way ANOVA (c-d). ^, P > 0.05. *, P < 0.05. **, P < 0.01. ***, P < 0.001. ****, P < 0.0001. Source data

References

    1. Hayflick L, Moorhead PS. The serial cultivation of human diploid cell strains. Exp. Cell. Res. 1961;25:585–621. doi: 10.1016/0014-4827(61)90192-6. - DOI - PubMed
    1. Di Micco R, et al. Cellular senescence in ageing: from mechanisms to therapeutic opportunities. Nat. Rev. Mol. Cell Biol. 2021;22:75–95. doi: 10.1038/s41580-020-00314-w. - DOI - PMC - PubMed
    1. Wiley CD, Campisi J. From ancient pathways to aging cells-connecting metabolism and cellular senescence. Cell Metab. 2016;23:1013–1021. doi: 10.1016/j.cmet.2016.05.010. - DOI - PMC - PubMed
    1. Song S, et al. Senescent cells: emerging targets for human aging and age-related diseases. Trends Biochem. Sci. 2020;45:578–592. doi: 10.1016/j.tibs.2020.03.008. - DOI - PMC - PubMed
    1. Coppe JP, et al. Senescence-associated secretory phenotypes reveal cell-nonautonomous functions of oncogenic RAS and the p53 tumor suppressor. PLoS Biol. 2008;6:2853–2868. doi: 10.1371/journal.pbio.0060301. - DOI - PMC - PubMed