. 2023 Dec;30(12):1936-1946.
doi: 10.1038/s41594-023-01133-1. Epub 2023 Oct 30.

The molecular basis of drug selectivity for α5 subunit-containing GABAA receptors

Affiliations

The molecular basis of drug selectivity for α5 subunit-containing GABAA receptors

Vikram Babu Kasaragod et al. Nat Struct Mol Biol. 2023 Dec.

Abstract

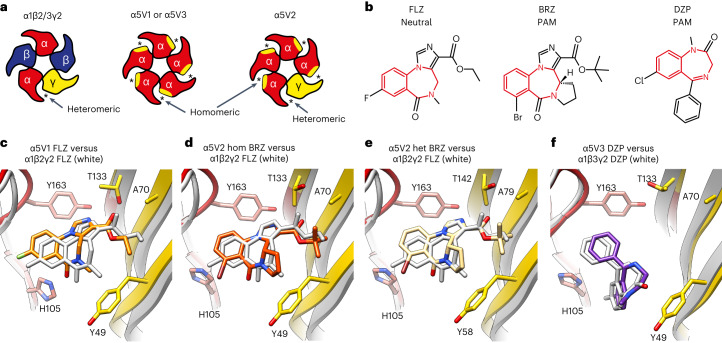
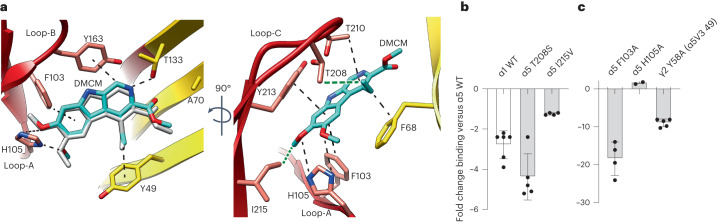
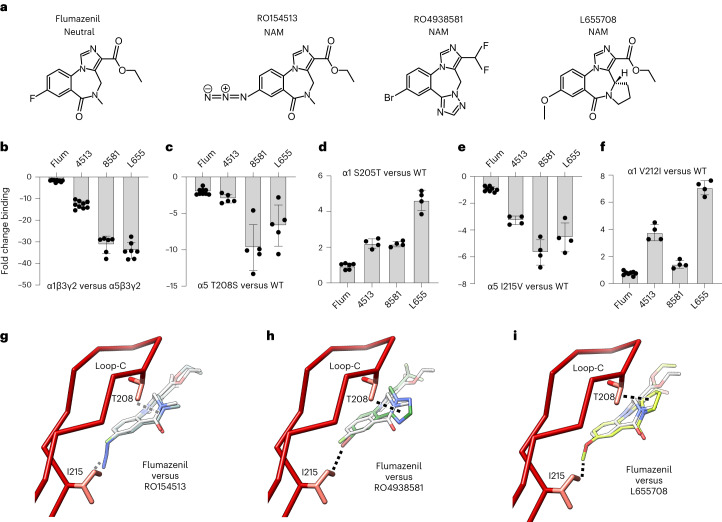
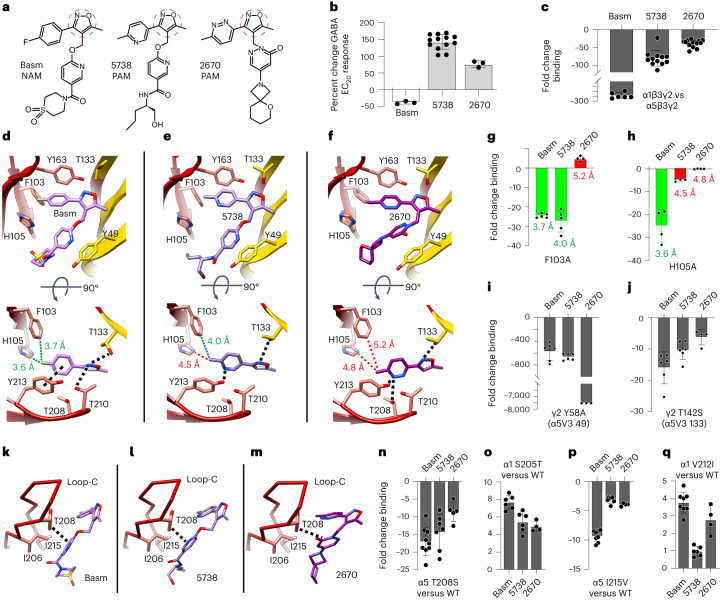
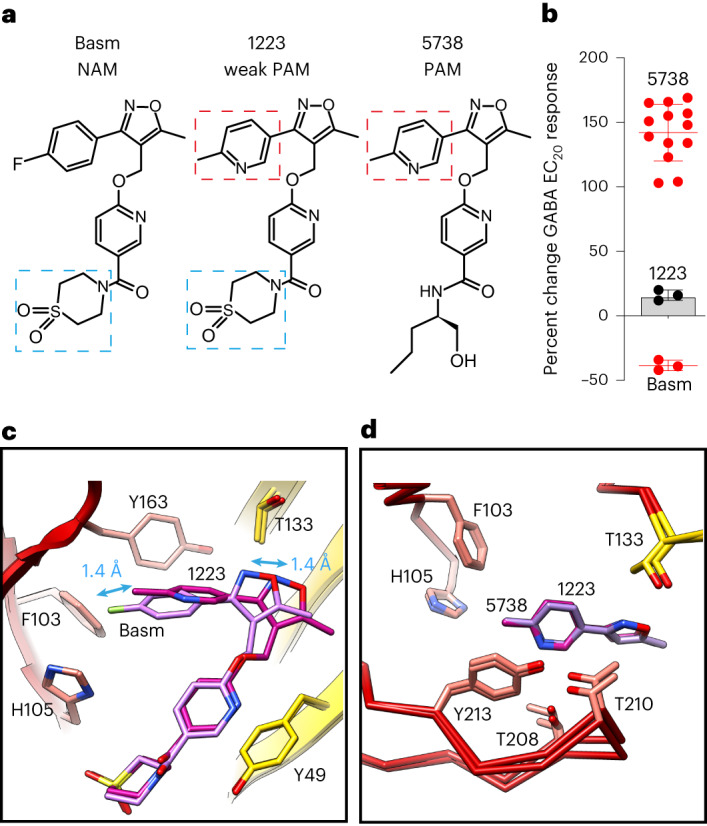
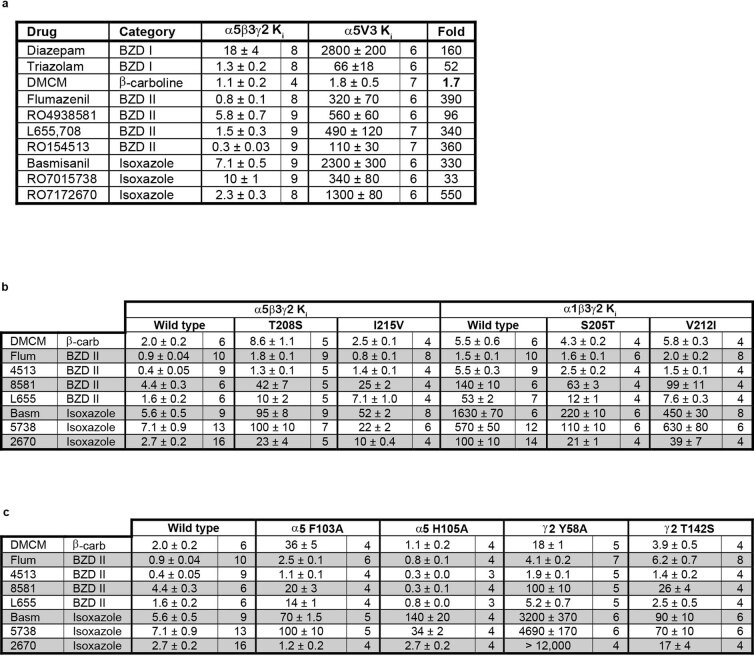
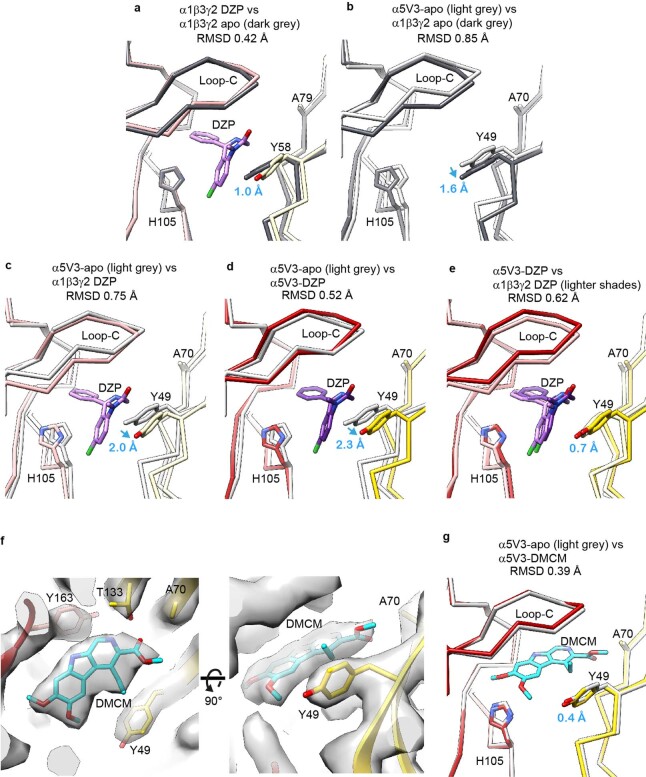
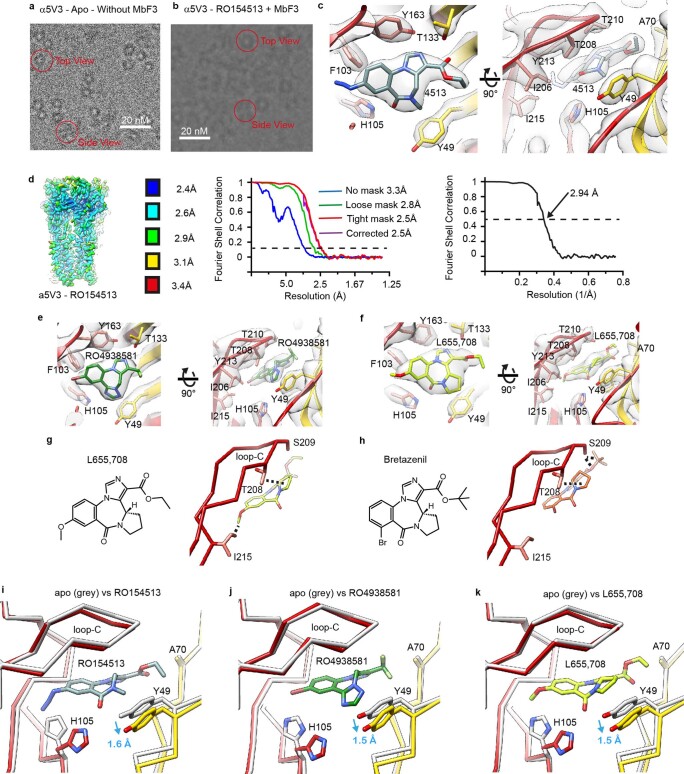
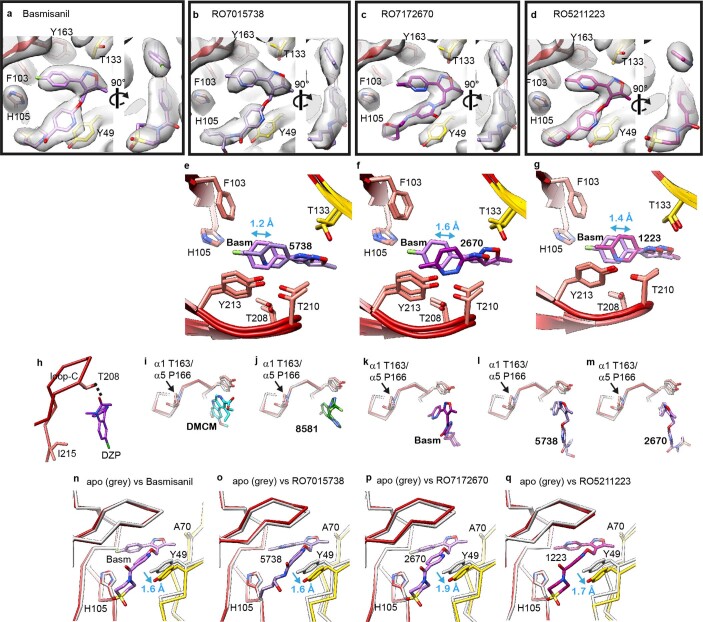
α5 subunit-containing γ-aminobutyric acid type A (GABAA) receptors represent a promising drug target for neurological and neuropsychiatric disorders. Altered expression and function contributes to neurodevelopmental disorders such as Dup15q and Angelman syndromes, developmental epilepsy and autism. Effective drug action without side effects is dependent on both α5-subtype selectivity and the strength of the positive or negative allosteric modulation (PAM or NAM). Here we solve structures of drugs bound to the α5 subunit. These define the molecular basis of binding and α5 selectivity of the β-carboline, methyl 6,7-dimethoxy-4-ethyl-β-carboline-3-carboxylate (DMCM), type II benzodiazepine NAMs, and a series of isoxazole NAMs and PAMs. For the isoxazole series, each molecule appears as an 'upper' and 'lower' moiety in the pocket. Structural data and radioligand binding data reveal a positional displacement of the upper moiety containing the isoxazole between the NAMs and PAMs. Using a hybrid molecule we directly measure the functional contribution of the upper moiety to NAM versus PAM activity. Overall, these structures provide a framework by which to understand distinct modulator binding modes and their basis of α5-subtype selectivity, appreciate structure-activity relationships, and empower future structure-based drug design campaigns.


Conflict of interest statement

Flumazenil, bretazenil, diazepam, RO4938581, basmisanil, RO7015738, RO7172670, RO154513 and RO5211223, are compounds developed by F. Hoffmann-La Roche Ltd. J.L., F.K., X.L., G.C. and M.-C.H. were employees of F. Hoffmann-La Roche Ltd at the time these studies were performed. A.A.W., W.-N.C. and P.S.M. performed consultancy work for F. Hoffmann-La Roche Ltd at the time these studies were performed. The remaining authors declare no competing interests.

Figures

Fig. 1
Fig. 1. α5 subunit engineering and structure validation.
a, Schematic top-down view of the subunit make-up of the full heteromeric α1β2/3γ2 receptor versus the engineered α5V1, α5V2 and α5V3. The homomer site is created between residues from the α5 principal face (red) and substituted γ2 residues introduced into the complementary face (yellow). Asterisk indicates site is occupied by drug in structure. b, Chemical structures of flumazenil (FLZ), bretazenil (BRZ) and diazepam (DZP), with benzodiazepine ring system colored red. cf, Structural model ribbon representations of drug binding modes for (c), FLZ bound to α5V1 (d), BRZ bound to α5V2 homomeric site (e), BRZ bound to α5V2 heteromeric site (f), DZP bound to α5V3 site, showing the α5V α5 principal face (red) and γ2 substituted complementary face (yellow). Bound drugs shown as sticks: oxygen, red; nitrogen, blue; fluorine, cyan; chlorine, green; bromine, brown. Superposed previously solved α1β2γ2 structure bound by flumazenil (PDB 6X3U) or α1β3γ2 bound by diazepam (PDB 6HUP) are shown in white. Loop-C, which binds over the pocket, like a cap, is not shown for clarity. For reference, equivalent complementary face residue numbering of α5V3 Y49, A70 and T133, in wild-type γ2 is Y58, A79 and T142, respectively.
Fig. 2
Fig. 2. Lack of DMCM selectivity.
a, Two alternative views of DMCM binding in the α5-γ2-like pocket of α5V3. α5-subunit principal face residues shown in red and substituted γ2 complementary face residues shown in yellow. DMCM shown as sticks (carbon, cyan; oxygen, red; nitrogen, blue). Loop-C, which binds over the pocket, like a cap, is not shown for clarity in lefthand panel. Superposed DMCM from previously solved α1β2γ2 structure (PDB 8DD3) shown in white in lefthand panel. Putative vdW, π-stacking, polar and H-bond interactions are indicated by dashed lines. Interactions coming from the two unique methyl groups of α5 T208 and I215 are shown by thick green dashes. For reference, equivalent complementary face residue numbering of α5V3 Y49, F68, A70 and T133 in wild-type (WT) γ2 is Y58, F77, A79 and T142 respectively. b,c, Impacts on DMCM affinity represented as fold changes of the Ki determined from radioligand displacement binding experiments of 3H-flumazenil: b, for wild-type α1β3γ2 receptors or α5β3γ2 receptors with α5 T208S or I215V mutations (n = 6, 5 and 4, respectively; c, for α5β3γ2 receptors with α5 F103A or H105A mutations or a γ2 Y58A mutation (n = 4, 4 and 5, respectively). Values are mean ± s.e.m. for n ≥ 3 separate experiments. For Ki values, see Extended Data Fig. 4b,c. Note: ±1-fold on the bar charts indicates no change. Source data
Fig. 3
Fig. 3. Molecular basis of α5-subtype selectivity of type II BZD NAMs.
a, Chemical structures of flumazenil, RO154513, RO4938581 and L655,708. bf, Impacts on ligand affinity represented as fold-changes of the Ki determined from radioligand displacement binding experiments of 3H-flumazenil: wild-type (WT) α1β3γ2 versus α5β3γ2 receptors (n = 10, 9, 6, 7) (b); α5 T208S mutation versus α5β3γ2 wild-type (n = 9, 5, 5, 5) (c); α1 S205T versus α1β3γ2 wild-type (n = 6, 4, 4, 4) (d); α5 I215V versus α5β3γ2 wild-type (n = 8, 4, 4, 4) (e); α1 V212I versus α1β3γ2 wild-type (n = 8, 4, 4, 4) (f). Values are mean ± s.e.m. for n ≥ 3 separate experiments. For Ki values, see Extended Data Fig. 4b. Note: ±1-fold on the bar charts indicates no change. gi, Cα stick representation of α5V3 loop-C showing the unique α5 residues T208 and I215 that increase ligand affinity due to the extra methyl groups they possess in contrast to Ser and Val residues, respectively, in other α subtypes. The extra stabilizing putative vdW interactions are shown as dashed lines between the side chain methyls and the ligands RO154513 (blue-gray) (g), RO4938581 (green) (h) and L655,708 (lime) (i). The α5V1 flumazenil (white) binding position is superposed showing its relative lack of interaction with the methyl groups and explaining its lack of α5 selectivity. Source data
Fig. 4
Fig. 4. Binding modes and basis of α5 selectivity of isoxazole compounds.
a, Chemical structures of basmisanil (Basm), RO7015738 (5738), and RO7172670 (2670). Isoxazole ring highlighted by red dashed circle. b, Percentage modulation of EC20 GABA responses by saturating concentrations of drugs recorded by voltage clamp of Xenopus laevis oocytes expressing α5β3γ2 GABAA receptors. Bars are mean ± s.e.m, n = 3 (Basm), 13 (5738) and 3 (2670) from separate experiments. c, Radioligand binding fold changes of the Ki determined from displacement of 3H-flumazenil, for wild-type α1β3γ2 versus α5β3γ2 receptors (n = 6, 12, 14). df, Binding modes of basmisanil (Basm) (d), RO7015738 (5738) (e) and RO7172670 (2670) (f), to α5V3 between α5 principal face (red) and γ2-residue substituted complementary face (yellow). Bound drugs shown as sticks: oxygen, red; nitrogen, blue; fluorine, green; sulfur, yellow. Loop-C, which binds over the pocket, like a cap, is not shown in the top panel side-on views for clarity, but is shown in the top-down bottom panels, which only show the isoxazole+aryl ring of each drug. Putative vdW, π-stacking, polar and H-bond interactions are indicated by dashed black or green lines. Distances from F103 and H105 are shown in green if below 4 Å supporting putative interactions, and shown in red if above 4 Å considered beyond the range of putative interactions. gj, Radioligand binding fold changes versus α5β3γ2 wild type (WT) for α5 F103A (n = 5, 5, 4) (g), α5 H105A (n = 4, 4, 4) (h), γ2 Y58A (n = 6, 6, 3) (i) and γ2 T142S mutations (n = 6, 6, 4) (j). For g and h, bars are shown in green or red for shorter versus longer distances from ligand (distance labels shown)—when the residue is further from the ligand the impact of the mutation (fold change in binding) is reduced. km, Basmisanil (k), RO7015738 (l) or RO7172670 (m) shown bound to α5V3 presented as Cα sticks displaying the unique α5 residues T208 and I215. The putative extra stabilizing vdW interaction from the T208 methyl to the ligand aromatic ring is highlighted. nq, Radioligand binding fold-changes for α5 T208S mutation versus α5β3γ2 (n = 8, 7, 5) (n), α1 S205T versus α1β3γ2 (n = 6, 6, 4) (o), α5 I215V versus α5β3γ2 (n = 8, 6, 4) (p) and α1 V212I versus α1β3γ2 (n = 8, 6, 4) (q). Values are mean ± s.e.m. for n ≥ 3 separate experiments. For Ki values, see Extended Data Fig. 4b,c. Note: ±1-fold on the bar charts indicates no change. Source data
Fig. 5
Fig. 5. Modulation and binding by a hybrid isoxazole compound.
a, Structural formula of basmisanil (Basm), the hybrid molecule RO5211223 (1223) and RO7015738 (5738). Methyl-pyridine highlighted by red dashed box. Thiomorpholine dioxide ring highlighted by blue dashed box. b, Percentage modulation by saturating concentrations of drugs of EC20 GABA responses recorded by voltage clamp of Xenopus laevis oocytes expressing cloned human α5β3γ2 GABAA receptors. Values are mean ± s.e.m. n = 3 (Basm), 3 (1223) and 13 (5738) from separate experiments. c,d, Superposition of two bound ligands: Basm versus 1223 showing the whole ligand side-on view with distinct positioning of the upper portion but not the lower portion (c); and 1223 versus 5738, top-down focused view on the conserved overlay of the upper isoxzole component only. α5 principal face (red) and γ2-residue substituted complementary face (yellow) (d). Bound drugs shown as sticks: oxygen, red; nitrogen, blue; fluorine, green; sulfur, yellow. Loop-C, which binds over the pocket, like a cap, is not shown in c, for clarity. Double-headed blue arrows in c indicate the size of displacement of the upper component. For reference, equivalent complementary face residue numbering of α5V3 Y49 and T133 in wild-type γ2 is Y58 and T142, respectively. Source data
Extended Data Fig. 1
Extended Data Fig. 1. Design of engineered GABAA receptor α5 constructs.
a, Top-down and side-on space filling representation of a GABAA receptor pentamer, one subunit shown in black for clarity. b-d, Single subunits viewed side-on from outside the pentamer, and rotated 180° to be viewed from inside the pentamer, for α5V1, α5V2 and α5V3 respectively. β3 subunit substitutions (blue) were incorporated to homomerise and stabilise α5 subunits, and γ2 subunit substitutions (yellow) were incorporated to create a homomeric α5-γ2 site. β3 substitutions are circled in three groups based on region, and marked on the alignment. e, Protein sequence alignment of α5, β3 and γ2 subunits (bold) versus the α5V1-3 constructs showing β3 and γ2 substitutions introduced (colour matched to their wild-type chains, bold, underlined). Numbering of α5V1-3 is maintained the same as Uniprot mature α5 subunit despite having less residues through M3-M4 loop deletion, for ease of comparison and to match PDB numbering. Residues of the three pocket binding loops A-C are also shown for α1 for comparison, with the two key differences versus α5 in loop-C boxed in green. α-subunit residues in the complementary (C)-face of the BZD site (β1-strand, loop D and loop E) conserved with γ2 are bold, red, underlined. f, Cα-stick representation of two subunits of α5V3, viewed from outside the pentamer, showing the positions as Cα spheres of the β3-mutations (blue) and γ2 mutations (gold); pink spheres are α5 residues that are the same in γ2 in order to create a complete γ2 binding face at the α-γ ECD pocket. g, Fluorescence size-exclusion (FSEC) profiles, overlaid, for purified protein of monoVenus-tagged GABAA receptor β3, α5 and α5N114G (β3 subunit Gly108) showing how mutating to remove a glycosylation site improves monodispersity and was essential for pentamerisation of α5 subunits.
Extended Data Fig. 2
Extended Data Fig. 2. BZD binding data for α5V1, α5V2, α5V3.
a, Omit electron density contoured at 3σ (blue/purple mesh), and Polder omit electron density contoured at 4σ (green and red mesh), associated with flumazenil in α5V1 between chains B:C. b, 2Fo-Fc map contoured at 1.6σ. c, and d, equivalent bretazenil maps for α5V2 at the heteromeric site, chains B:C. e, Schematic top-down rosettes of the subunit make-up of α5β3γ2, α5V1 or α5V3, α5V2, α5V2Δ. The homomer site is created between residues from the α5 principal face (red) and substituted γ2 residues from the complementary face (yellow). In α5V2Δ the γ2 substituted complementary face has not been created in the α5 subunits, leaving only a single heteromeric binding site between the α5 and γ2 domains – this construct was made to measure the affinity of the single heteromeric site in isolation. * indicates site is occupied by drug in structure. f, Saturation binding experiment with 3H-flunitrazepam. g, corresponding log plot to visually distinguish the two different affinity sites of α5V2. h, and i, Equivalent 3H-flumazenil experiment and log plot. j, Bretazenil binding competition experiment against 3H-flumazenil. Calculated inhibition constant (Ki) values are based on Kd values in h. Values are mean ± S.E.M. for n ≥ 3 separate experiments. Source data
Extended Data Fig. 3
Extended Data Fig. 3. Local resolution map, overall plotted resolutions, global map-model agreements, and diazepam binding mode.
a, For the structure, α5V3-DZP, a map on the left is coloured by local resolution (see Methods). Maps of Fourier shell correlation (FSC) (upper right panel) and map-model FSC (lower right panel) plots are also shown. b, Cryo-EM map and corresponding structural model of α5V3 bound to diazepam confirming ligand fit and orientation. The isosurface level of the protein and ligand are the same. Shown from two viewing angles. c, Overlay of binding site of α5V1 bound by flumazenil and α5V3 bound to diazepam. The ligands are white except for the phenyl ring in purple, and the diazepine ring in grey with nitrogens in cyan or blue, to emphasise the alternative “flipped” orientation of the benzodiazepine component between the Type I BZD diazepam and Type II BZD flumazenil. d, Equivalent image comparing α1β2γ2 bound by flumazenil (PDB 6X3U) and α1β3γ2 bound by diazepam (PDB 6HUP). For reference, equivalent complementary face residue numbering of α5V3 Y49, A70, T133, in wild type γ2 is Y58, A79, T142 respectively. Loop-C, which binds over the pocket, like a cap, is not shown for clarity.
Extended Data Fig. 4
Extended Data Fig. 4. Radioligand binding affinities for GABAA receptors.
a, Ligand affinities (nM) for wild type α5β3γ2 receptors versus α5V3 receptors, measured by competition against [3H]-flumazenil. b, Ligand affinities (nM) for wild type α1-containing and α5-containing receptors and receptors with α1/α5 residue swaps at α1-S205/α5-T208 or α1-V212I/α5-I215V in the α-subunit loop-C, measured by competition against [3H]-flumazenil. c, Ligand affinities (nM) for wild type α5β3γ2 receptors versus receptors containing mutations in the ligand binding pocket, measured by competition against [3H]-flumazenil.
Extended Data Fig. 5
Extended Data Fig. 5. α5V3 pocket versus α1β3γ2 receptors and diazepam and DMCM binding impact.
a, Overlays of the α1β3γ2 receptor at the α1-γ2 binding pocket for apo (dark grey) versus diazepam-bound (DZP; α1 principal face in pink and γ2 complementary face in pale yellow), showing that the pocket is highly similar. b, Equivalent view, but overlay of α1γ2-apo (dark grey) versus α5V3-apo (light grey), showing that pocket is also highly similar. The relative upward position of α5V3-apo Y49 versus α1γ2-apo Y58 is indicated (blue arrow). c, Overlay of α1γ2-DZP (pink/pale yellow) versus α5V3-apo (light grey), with the relative upward position of α5V3-apo Y49 versus α1γ2-DZP Y58 indicated (blue arrow). d, Overlay of α5V3-DZP (red/yellow) versus α5V3-apo (light grey), showing that the pocket is highly similar but binding of diazepam has caused displacement of Y49 by 2.3 Å (blue arrow). e, Overlay of α1γ2-DZP (pink/pale yellow) versus α5V3-DZP (red/yellow), showing that the downward displacement by DZP on Y49 means it now matches the position of Y58 in the α1-γ2-DZP pocket. f, Cryo-EM map of α5V3-DMCM showing the fit of the DMCM molecule into the density. The isosurface level of the protein and ligand are the same. Shown from two viewing angles. g, Structural model overlay of α5V3-apo (grey) versus α5V3-DMCM showing that Y49 does not need to move to accommodate DMCM binding. Note: The structural model of the α1-γ2-apo pocket is from the α1β3γ2 receptor bound by antagonist bicuculline, PDB 6HUK; α1γ2-DZP is from α1β3γ2 receptor bound by GABA and diazepam, PDB 6HUP. For reference, equivalent complementary face residue numbering of α5V3 Y49, A70, T133, in wild type γ2 is Y58, A79, T142 respectively.
Extended Data Fig. 6
Extended Data Fig. 6. Cryo-EM processing workflow for α5V3.
Image processing workflow in cryoSPARC from micrographs through 2D classes and 3D ab initio model to final model after refinement rounds with global map resolution shown, applicable to any α5V3 protein but shown here specifically for α5V3-apo.
Extended Data Fig. 7
Extended Data Fig. 7. α5V3 conformation.
a-d, Structural models represented as ribbon diagrams looking down on the upper portions of subunit extracellular domains. Overlay comparing the superposition of the β3 and α1 subunits in α1β3γ2 inhibited by bicuculline, a, show that the α1 subunit is twisted into the activated conformation relative to the β3 subunit, whereas in the presence of GABA, b, the β3-subunit becomes activated and rotates to assume the same twisted arrangement as the α1 subunit. c-d, Overlays of the α1 subunit versus α5V3, show that the α5V3-apo, c, and α5V3-DZP, d, subunits match the activated twisted α1 subunit arrangement observed in inhibited and GABA-bound α1β3γ2 receptors. e-h, Comparisons of the same subunit pairings, but this time from the perspective of the position of the M2-M3 loop in Cα stick representation relative to the pore. Overlay comparing the superposition of the β3 and α1 subunit M2-M3 loops in α1β3γ2 inhibited by bicuculline, e, show that the α1 subunit is retracted from the pore relative to the β3 subunit, whereas in the presence of GABA, f, the β3-subunit also retracts. g-h, Overlays of the α1 subunit versus α5V3, show that the α5V3-apo, g, and α5V3-DZP, h, are also retracted. i, Cross sections of the pore showing positions of hydrophobic activation gate 9’ leucines and pore diameters showing that inhibited α1β3γ2 is closed, GABA-bound α1β3γ2 is open, and the β3 homomer and α5V3 are even more open. j, Pore radius plots. Inhibited α1β3γ2 receptor (bound by antagonist bicuculline) is PDB 6HUK; GABA-bound α1β3γ2 receptor (also bound by diazepam) is PDB 6HUP; β3-homomer is PDB 4COF.
Extended Data Fig. 8
Extended Data Fig. 8. Type II BZD binding modes and impacts.
a, Micrograph showing particle distribution for α5V3-apo, being mostly views, versus, b, for α5V3-RO154513 bound by megabody MbF3, which binds nanodisc MSP2N2, giving mostly side views. Each sample set-up once for data collection. c, Cryo-EM map electron density and fitted protein model of α5V3-RO154513. Shown from two viewing angles. Protein and ligand contour level are the same. d, α5V3-RO154513 map coloured by local resolution (see Methods). Fourier shell correlation (FSC) (upper right panel) and map-model FSC (lower right panel) plots are also shown. Relevant statistics are presented in Data Table 2. e, f, Cryo-EM map electron density and fitted protein models of α5V3-RO154513 and α5V3-L655,708 respectively. Shown from two viewing angles. Protein and ligand contour level are the same. g,h, Structural formula of L655,708 and bretazenil respectively along with Cα stick representation of α5V3 loop-C showing the unique α5 residues T208 and I215 and putative vdW interactions (dashed lines). For bretazenil, h, it does not interact with the unique α5 I215 methyl, and has additional putative interactions with S209 (versus L655,708) due to its larger trimethyl head that could compensate for loss of the unique α5 T208 methyl, to explain why bretazenil is non-selective. i-k, Structural model overlays of α5V3-apo (grey) versus, i, α5V3-RO154513, j, α5V3-RO4938581, and k, α5V3-L655,708, showing that Y49 moves to accommodate binding. An energetic requirement for this structural motion could contribute to RO154513, RO4938581 and L655,708 having 360-fold, 100-fold and 340-fold lower binding affinity respectively for α5V3 versus α5β3γ2 (Extended Data Fig. 4a). For reference, equivalent complementary face residue numbering of α5V3 Y49, A70, T133, in wild type γ2 is Y58, A79, T142 respectively.
Extended Data Fig. 9
Extended Data Fig. 9. Isoxazole drug binding modes and impacts.
a-d, Cryo-EM maps of α5V3 bound by basmisanil, RO7015738, RO7172670 and RO5211223 respectively, showing ligand fit into the electron density and surrounding protein model fit into the density. The contour level of the protein and ligand are the same. e-g, Superposition of two bound ligands, top-down focused view on the conserved overlay of the upper isoxzole component only, for, e, Basm versus 5738, f, Basm versus 2670, g, Basm versus 1223. α5 principal face (red) and γ2-residue substituted complementary face (yellow). Bound drugs shown as sticks: oxygen, red; nitrogen, blue; fluorine, green; sulphur, yellow. Double-headed blue arrows indicate the size of displacement of isoxazole component versus basmisanil for each drug. For reference, equivalent complementary face residue numbering of α5V3 Y49, T133, in wild type γ2 is Y58, T142 respectively. h, Diazepam is not α5-selective and does not form putative interactions with the T208 methyl group. i-m, Ligands, i, DMCM, j, RO4938581, k, Basm, l, 5738, m, 2670, bound to α5V3 showing relative position to α5 P166, which is α1 T163, showing that the peptide backbone in this binding loop-C region is the same in α5V3 and α1β3γ2 (PDB:6HUO) and that this residue is > 6 Å from the ligands, too far to impact binding. n-q, Structural model overlays of α5V3-apo (grey) versus α5V3 bound by n, basmisanil, o, RO7015738, p, RO7172670, and q, RO5211223, showing that Y49 moves to accommodate binding. An energetic requirement for this structural motion could contribute to these ligands having 30- to 600-fold lower binding affinity for α5V3 versus α5β3γ2 in which Y49 naturally assumes the shifted position (Extended Data Fig. 4a). For reference, equivalent complementary face residue numbering of α5V3 Y49, A70, T133, in wild type γ2 is Y58, A79, T142 respectively.

References

    1. Nemecz A, Prevost MS, Menny A, Corringer PJ. Emerging molecular mechanisms of signal transduction in pentameric ligand-gated ion channels. Neuron. 2016;90:452–470. doi: 10.1016/j.neuron.2016.03.032. - DOI - PubMed
    1. Nys M, Kesters D, Ulens C. Structural insights into Cys-loop receptor function and ligand recognition. Biochem. Pharmacol. 2013;86:1042–1053. doi: 10.1016/j.bcp.2013.07.001. - DOI - PubMed
    1. Fritschy JM, Panzanelli P. GABAA receptors and plasticity of inhibitory neurotransmission in the central nervous system. Eur. J. Neurosci. 2014;39:1845–1865. doi: 10.1111/ejn.12534. - DOI - PubMed
    1. Zhu S, et al. Structure of a human synaptic GABAA receptor. Nature. 2018;559:67–72. doi: 10.1038/s41586-018-0255-3. - DOI - PMC - PubMed
    1. Masiulis S, et al. GABAA receptor signalling mechanisms revealed by structural pharmacology. Nature. 2019;565:454–459. doi: 10.1038/s41586-018-0832-5. - DOI - PMC - PubMed

MeSH terms