. 2023 Dec;9(12):2095-2109.
doi: 10.1038/s41477-023-01544-4. Epub 2023 Oct 30.

Time series single-cell transcriptional atlases reveal cell fate differentiation driven by light in Arabidopsis seedlings

Affiliations

Time series single-cell transcriptional atlases reveal cell fate differentiation driven by light in Arabidopsis seedlings

Xue Han et al. Nat Plants. 2023 Dec.

Abstract

Light serves as the energy source for plants as well as a signal for growth and development during their whole life cycle. Seedling de-etiolation is the most dramatic manifestation of light-regulated plant development processes, as massive reprogramming of the plant transcriptome occurs at this time. Although several studies have reported about organ-specific development and expression induced by light, a systematic analysis of cell-type-specific differentiation and the associated transcriptional regulation is still lacking. Here we obtained single-cell transcriptional atlases for etiolated, de-etiolating and light-grown Arabidopsis thaliana seedlings. Informative cells from shoot and root tissues were grouped into 48 different cell clusters and finely annotated using multiple markers. With the determination of comprehensive developmental trajectories, we demonstrate light modulation of cell fate determination during guard cell specialization and vasculature development. Comparison of expression atlases between wild type and the pifq mutant indicates that phytochrome-interacting factors (PIFs) are involved in distinct developmental processes in endodermal and stomatal lineage cells via controlling cell-type-specific expression of target genes. These results provide information concerning the light signalling networks at the cell-type resolution, improving our understanding of how light regulates plant development at the cell-type and genome-wide levels. The obtained information could serve as a valuable resource for comprehensively investigating the molecular mechanism of cell development and differentiation in response to light.


Conflict of interest statement

The authors declare no competing interests.

Figures
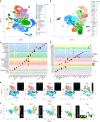
Fig. 1
Fig. 1. Cell atlases of de-etiolating seedlings.
a, Visualization of root cell types (states) via UMAP. The dots indicate individual cells, while the colours represent the respective cell types. Corresponding root cluster (rcluster) IDs are indicated on the right. b, Visualization of shoot cell types (states) via UMAP. The dots indicate individual cells, while the colours represent the respective cell types. Corresponding shoot cluster (scluster) IDs are indicated on the right. c, Expression patterns of representative marker genes for root cell types. The dot diameter indicates the proportion of cluster cells expressing a given gene and the colour indicates relative expression levels. d, Expression patterns of representative marker genes for shoot cell types. The dot diameter indicates the proportion of cluster cells expressing a given gene and the colour indicates relative expression levels. e, Time-series root cell atlas and phenotypes in different light radiation timepoints. Two replicates of Dark samples were merged. f, Time-series shoot cell atlas and phenotypes in different light radiation timepoints. Two replicates of Dark samples were merged.
Fig. 2
Fig. 2. Specific expression of marker genes for hypocotyl cell types and lateral root caps.
a, Expression of AT4G18970 in hypocotyl epidermal cells under dark and light conditions. The gene expression pattern was determined by AT4G18970 promoter-driven Histone2B-GFP (H2B-GFP, green) reporter. The cell outline (red) was visualized by FM4-64 staining in addition to DsRed2 reporter driven by a seedling-specific promoter (pAT2S3). b, Expression of AT3G05150 in hypocotyl cortical cells specifically in darkness. The gene expression pattern was determined using Histone2B-GFP (H2B-GFP, green) reporter driven by AT3G05150 promoter. The cell outline (red) was visualized by FM4-64 staining in addition to DsRed2 reporter driven by a seedling-specific promoter (pAT2S3). c, Expression of AT1G78450 in hypocotyl cortical cells specifically in light conditions. The gene expression pattern was determined by AT1G78450 promoter-driven Histone2B-GFP (H2B-GFP, green) reporter. The cell outline (red) was visualized by FM4-64 staining in addition to DsRed2 reporter driven by a seedling-specific promoter (pAT2S3). d, Expression of AT1G53708 in subtype LRC1 and LRC2 in dark and light conditions, respectively. The seedling cells (red) were labelled with the seedling-specific promoter AT2S3::DsRed2. e, Expression of AT4G13890 in a stable subtype LRC3 in dark and light conditions. The seedling cells (red) were labelled with the seedling-specific promoter AT2S3::DsRed2. The expression patterns of marker genes in cell atlases for Dark and Light samples are correspondingly illustrated on the right. Colour bar, normalized UMI counts; darker colours indicated higher expression. Scale bar, 100 μm. Each experiment was independently repeated three times.
Fig. 3
Fig. 3. Expression of spatiotemporal-specific genes.
a, Expression of the spatio-markers in each cell; each column represents a cell. The annotated colours for the columns indicate the respective cell types. b, Dynamic expression of spatio-markers during de-etiolation. c, Spatiotemporal co-expression networks for seven shoot cell types during de-etiolation. The annotated colours of the rows represent different patterns of co-expression modules and the annotated colours for columns represent de-etiolation times.
Fig. 4
Fig. 4. Light promotes phloem development but inhibits xylem development.
a, Visualization of vascular cells via UMAP during the de-etiolation process for merged data (top) and respective data of different radiation times (bottom). b, Transcript distribution of subtype markers. Colour bar, normalized UMI counts. c, Visualization of vascular system development along with pseudotime. d, Expression trends of candidate genes involved in light-induced vasculature development. Pr, procambium; DC, dividing Cell; Pa, parenchyma; PXy, protoxylem; Xy, xylem; SE, phloem sieve element; CC, phloem companion cell.
Fig. 5
Fig. 5. GC development networks under darkness and light.
a, RNA velocity inferred for SL cells of light-grown samples. The colours indicate different subtypes. b, RNA velocity inferred for SL cells of dark-grown samples. The colours indicate different subtypes. c, Cell atlases for SL of Light samples. Transcript distributions of development factors in SL cells are highlighted by different colours. d, Cell atlases for SL of Dark samples. Two replicates of Dark samples are merged. Transcript distributions of development factors in SL cells are highlighted by different colours. e, Visualization of SL cells during the de-etiolation process. The orange and black arrows indicate canonical and dark-specific trajectories, respectively, for GC development. f, Latent time inferred for SL cells during the de-etiolation process; a darker colour represents earlier development stages. g, Expression trends of candidate regulators involved in SL development in dark and light conditions along the inferred pseudotime. h, Regulatory models for GC development. The black dots represent the respective cell clusters (0–9). Cells belonged to different clusters were coloured in respective colours: dark-grown precursors: 0, 4, 6; de-etiolating precursors: 1, 3; light-grown precursors: 2, 5; light-grown pavement cell: 9; light-grown GC: 8; dark-grown and de-etiolating GC: 7. The black edges between the black dots represent probabilities for cell state transitions. The size of the edges corresponds to the approval rate (the frequency of occurence for edges). The candidate genes involved in the respective trajectories are listed.
Fig. 6
Fig. 6. Cell-type-specific function of PIFs.
a, Visualization of shoot cell types via UMAP for dark-grown WT. Cell types are colour coded. Annotations for each cell type are indicated. b, Visualization of shoot cell types via UMAP for dark-grown pifq mutant. Cell types are colour coded. Annotations for each cell type are indicated. c,d, Visualization of shoot cell types via UMAP by integration of WT and pifq atlas with Dark sample in the de-etiolating shoot atlas after batch-effect correction. Cell types are annotated for WT and pifq. The corresponding cell types are set in the same column. e, Correlation analyses for different cell types in WT and pifq with whole-genome expression patterns. The expression ratio (the number of cells where the gene is transcribed/the total number of cells) for each gene in each cell type was calculated and used for Pearson correlation analyses. Cell-type pairs highly correlated in two samples are indicated by green squares. Cell-type clusters without highly correlated pairs are indicated by purple and blue squares. f,g, GO enrichment results for down- (f) and upregulated (g) genes in cell type clusters surrounded by the blue square. h, The expression patterns of PIF direct target genes in different cell types of dark-grown WT and pifq shoot tissues. A cluster of targets with similar patterns in most cell types but highly expressed in endodermal cells are enclosed in blue rectangles. i,j, The development trajectory of epidermal cells for dark-grown WT and the pifq mutant. Corresponding samples (i) and pseudotime inferred by expression (j) are indicated by different colours. k, The expression of PIF direct target genes during guard cell development. PIF direct target genes with significant expression difference during guard cell development are identified. Relative expression levels of these genes for cells sorted by pseudotime are illustrated. The values of log2(fold change) (expression in the pifq mutant/expression in WT) calculated with bulk RNA-seq data are supplied on the right.

Similar articles

Cited by

References

    1. Von Arnim A, Deng XW. Light control of seedling development. Annu. Rev. Plant Physiol. Plant Mol. Biol. 1996;47:215–243. - PubMed
    1. Chory J, Peto C, Feinbaum R, Pratt L, Ausubel F. Arabidopsis thaliana mutant that develops as a light-grown plant in the absence of light. Cell. 1989;58:991–999. - PubMed
    1. Neff MM, Van Volkenburgh E. Light-stimulated cotyledon expansion in Arabidopsis seedlings (The role of phytochrome B) Plant Physiol. 1994;104:1027–1032. - PMC - PubMed
    1. Wei H, Kong D, Yang J, Wang H. Light regulation of stomatal development and patterning: shifting the paradigm from Arabidopsis to grasses. Plant Commun. 2020;1:100030. - PMC - PubMed
    1. Wang S, et al. Light regulates stomatal development by modulating paracrine signaling from inner tissues. Nat. Commun. 2021;12:3403. - PMC - PubMed

Publication types