. 2023 Dec;30(12):2477-2490.
doi: 10.1038/s41418-023-01234-w. Epub 2023 Oct 30.

YTHDC1 as a tumor progression suppressor through modulating FSP1-dependent ferroptosis suppression in lung cancer

Affiliations

YTHDC1 as a tumor progression suppressor through modulating FSP1-dependent ferroptosis suppression in lung cancer

Shuai Yuan et al. Cell Death Differ. 2023 Dec.

Abstract

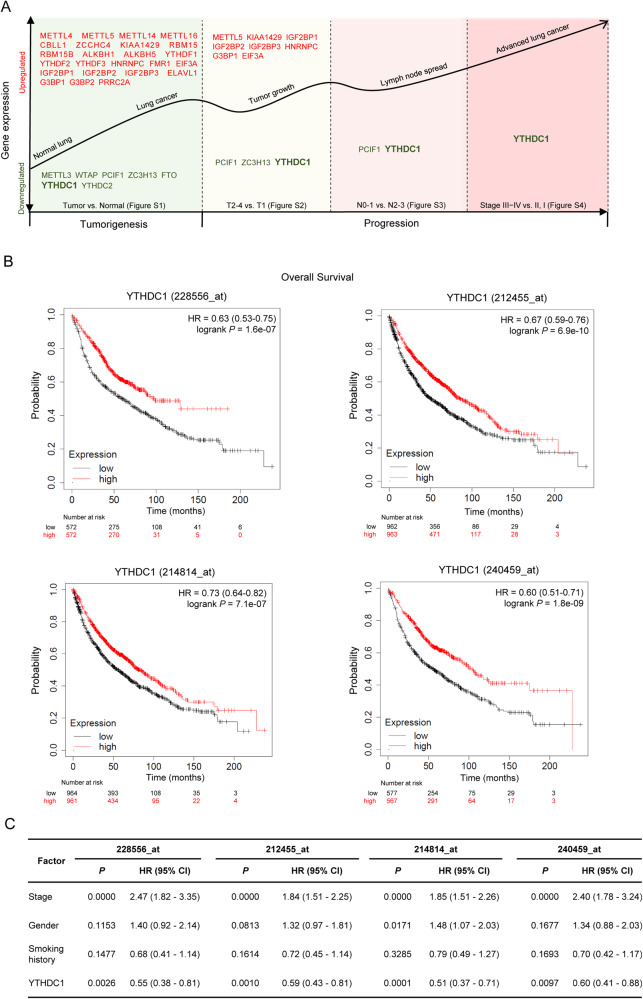
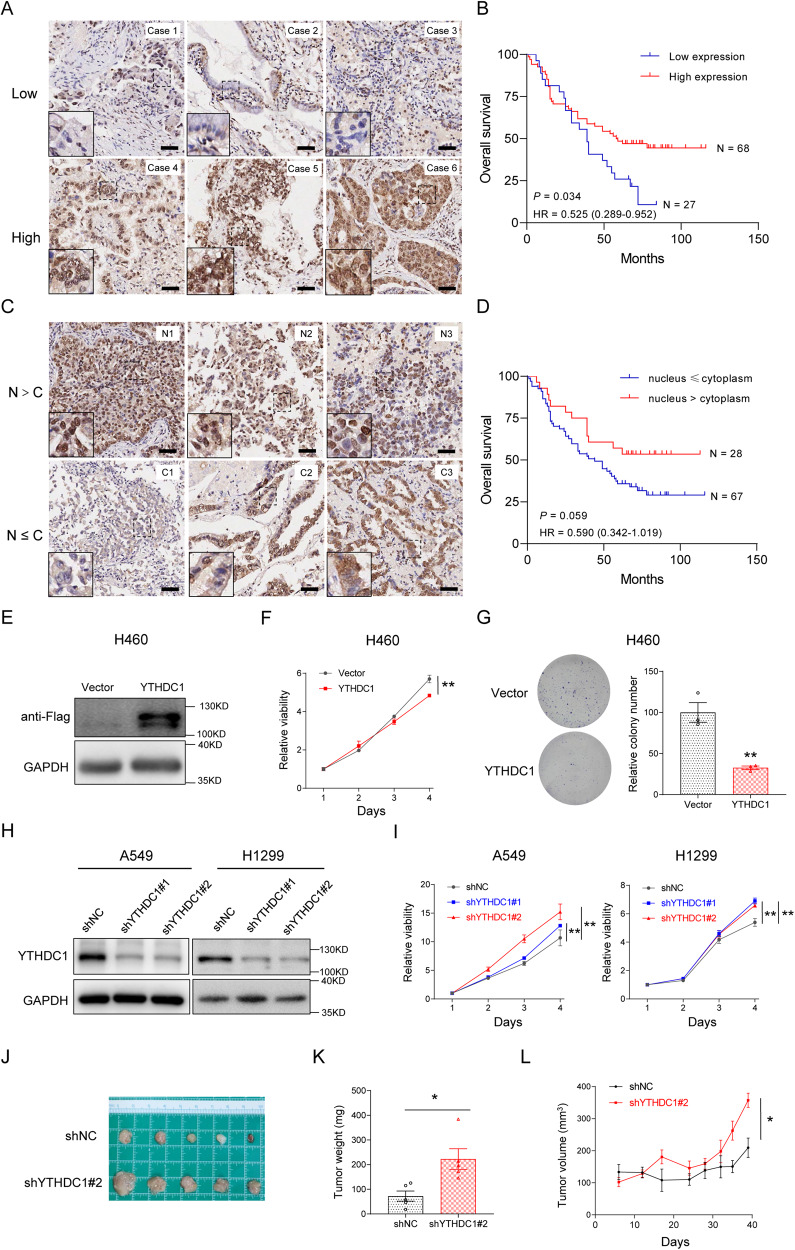
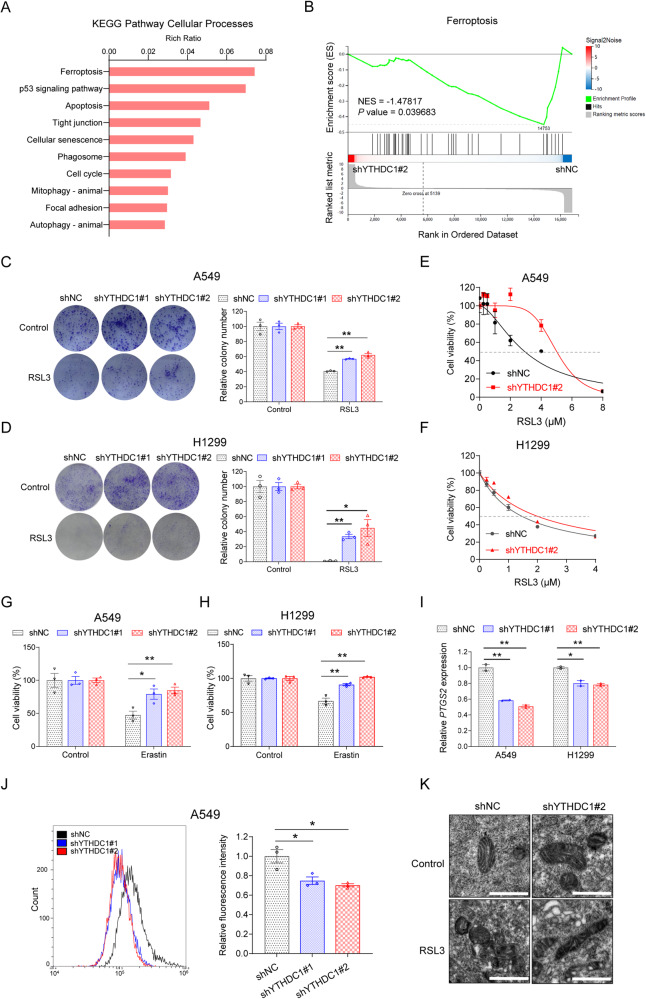
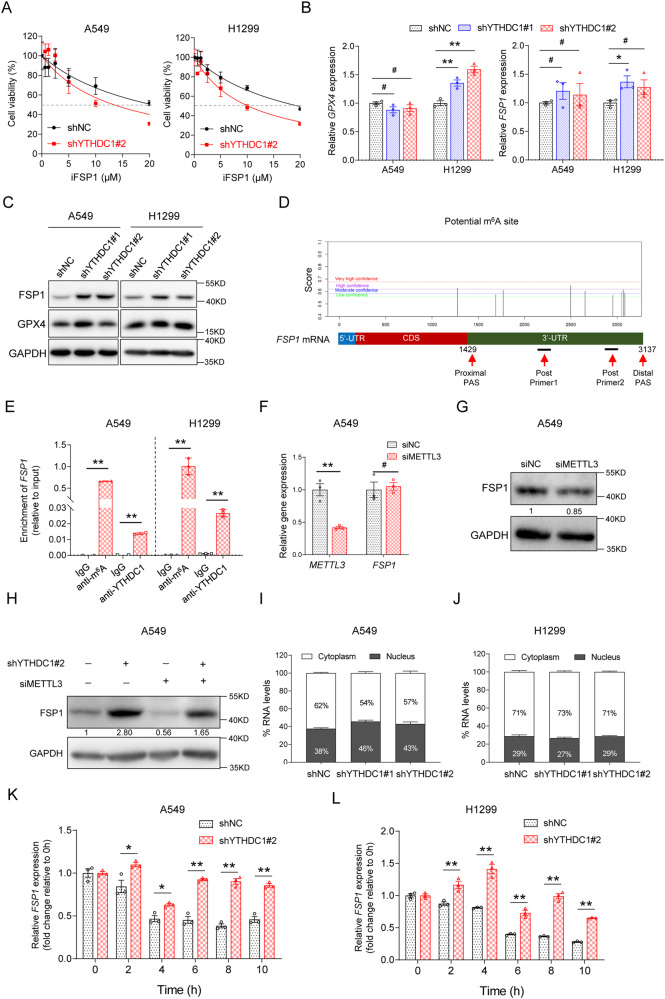
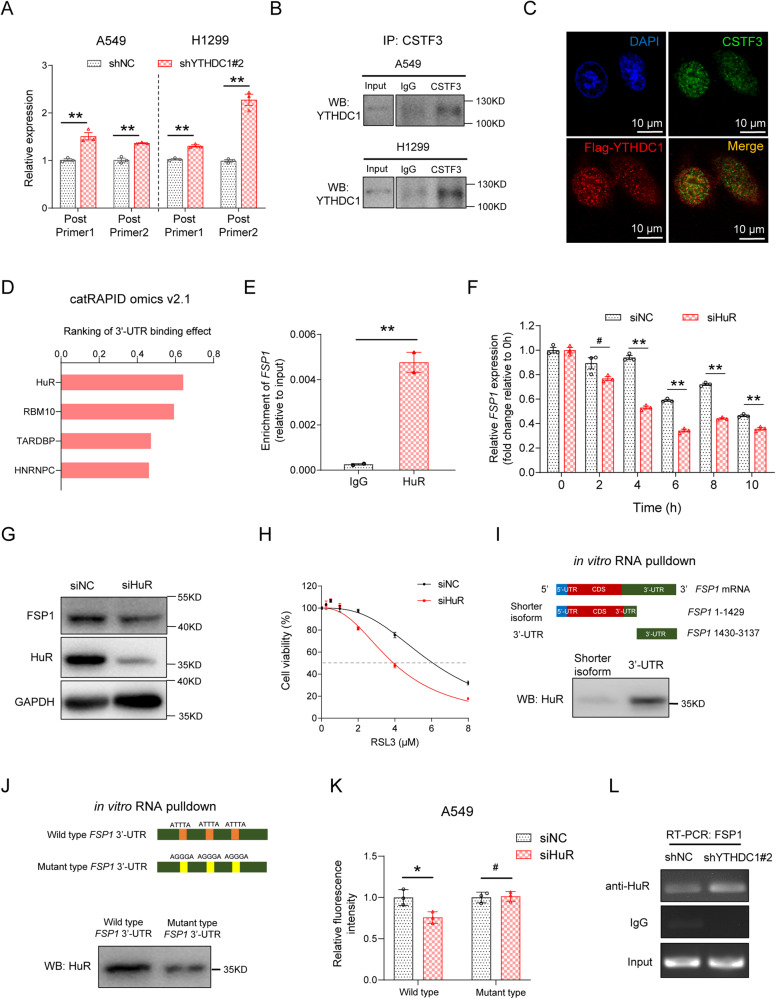
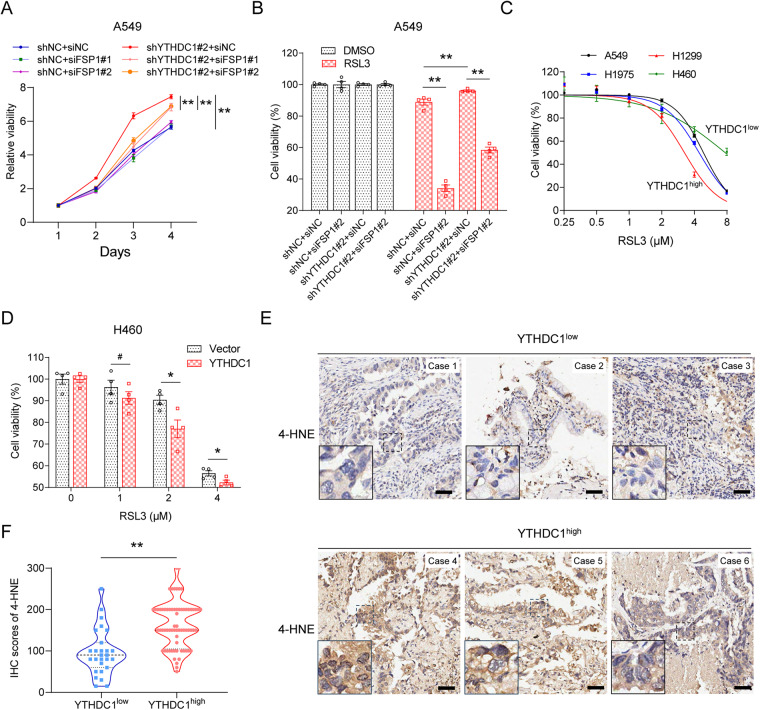
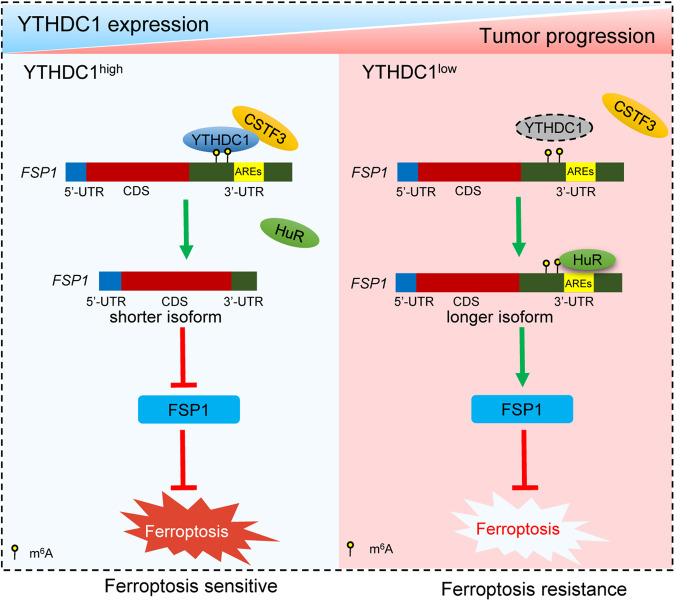
Ferroptosis is a regulated cell death process initiated by iron-dependent phospholipid peroxidation and is mainly suppressed by GPX4-dependent and FSP1-dependent surveillance mechanisms. However, how the ferroptosis surveillance system is regulated during cancer development remains largely unknown. Here, we report that the YTHDC1-mediated m6A epigenetic regulation of FSP1 alleviates the FSP1-dependent ferroptosis suppression that partially contributes to the tumor suppressive role of YTHDC1 in lung cancer progression. YTHDC1 knockdown promoted the lung tumor progression and upregulated FSP1 protein level that resulted in ferroptosis resistance of lung cancer cells. Silencing FSP1 abrogated YTHDC1 knockdown-induced proliferation increase and ferroptosis resistance. Mechanistically, YTHDC1 binding to the m6A sites in the FSP1 3'-UTR recruited the alternative polyadenylation regulator CSTF3 to generate a less stable shorter 3'-UTR contained FSP1 mRNA, whereas YTHDC1 downregulation generated the longer 3'-UTR contained FSP1 mRNA that is stabilized by RNA binding protein HuR and thus led to the enhanced FSP1 protein level. Therefore, our findings identify YTHDC1 as a tumor progression suppressor in lung cancer and a ferroptosis regulator through modulating the FSP1 mRNA stability and thus suggest a ferroptosis-related therapeutic option for YTHDC1high lung cancer.


Conflict of interest statement

The authors declare no competing interests.

Figures

Fig. 1
Fig. 1. YTHDC1 is negatively correlated with the progression of lung cancer.
A The expression patterns of m6A “writers” (METTL3, METTL4, METTL5, METTL14, METTL16, WTAP, KIAA1429, RBM15, RBM15B, ZC3H13, CBLL1, ZCCHC4, and PCIF1), “erasers” (ALKBH1, ALKBH5, and FTO) and “readers” (YTHDC1, YTHDC2, YTHDF1, YTHDF2, YTHDF3, HNRNPA2B1, HNRNPC, FMR1, EIF3A, IGF2BP1, IGF2BP2, IGF2BP3, ELAVL1, G3BP1, G3BP2, and PRRC2A) along the tumor progression of lung cancer are analyzed using the GTEx Portal (version V8) and TCGA (version 2019-7-20) databases. B Kaplan–Meier curves for overall survival of lung cancer patients with high and low expression levels of YTHDC1 using the Kaplan–Meier Plotter (KMplot) program (www.kmplot.com, version 2022). The median gene expression values as the cutoff. Four probes (228556_at, 212455_at, 214814_at and 240459_at) targeting YTHDC1 are used. C The association between YTHDC1 with overall survival in lung cancer is analyzed using multivariate Cox proportional-hazards regression analysis after adjustment for tumor stage, gender, and smoking history. Four probes (228556_at, 212455_at, 214814_at and 240459_at) targeting YTHDC1 are used.
Fig. 2
Fig. 2. YTHDC1 suppresses lung cancer progression.
A Low and high protein levels of nuclear YTHDC1 in representative lung cancer tissues by immunohistochemical staining. Scale bars represent 50 μm. For each case, immunostaining score with a potential range of 0–300 is calculated as follows: Immunostaining score = [extent of positive cell staining (0–100%) × staining intensity (0–3)] × 100. High YTHDC1 protein level group contains the immunostaining score >75 patients. Low YTHDC1 protein level group contains the immunostaining score ≤75 patients. B Kaplan–Meier curves for overall survival of lung cancer patients (n = 95) with high and low protein levels of YTHDC1. C Representative immunohistochemical staining of lung cancer tissues with dominant nuclear (upper) or dominant cytoplasmic (lower) YTHDC1 level. Scale bars represent 50 μm. D Kaplan–Meier curves for overall survival of lung cancer patients (n = 95) with dominant nuclear and dominant cytoplasmic YTHDC1 level. E The protein levels of YTHDC1 are detected by WB using anti-Flag antibody in H460 cells after overexpression of Flag-tagged YTHDC1. F Cell proliferation is detected by CCK-8 assays after overexpression of YTHDC1 in H460 cells. The difference between cell proliferation curves is evaluated using repeated measures analysis of variance. G Colony formation assays are conducted after overexpression of YTHDC1 in H460 cells. H The knockdown effects of YTHDC1 by shRNA are detected using WB in A549 and H1299 cells. I Cell proliferation is detected by CCK-8 assays after stable knockdown of YTHDC1 in A549 and H1299 cells. The difference between cell proliferation curves is evaluated using repeated measures analysis of variance. J Subcutaneous xenograft tumors are dissected and photographed. K The tumor weight of A549 cells with stable knockdown of YTHDC1 or control. Results of tumor weight are evaluated using the two-tailed Student’s t-test. L The tumor growth curve of A549 cells with stable knockdown of YTHDC1 or control. The difference between tumor growths curves is evaluated using repeated measures analysis of variance. *P < 0.05; **P < 0.01.
Fig. 3
Fig. 3. YTHDC1 promotes ferroptosis activity.
A Genome-wide gene expressions are detected by RNA-seq in A549 cells with stable knockdown of YTHDC1 and Kyoto encyclopedia of genes and genomes (KEGG) pathway analysis is conducted using differentially expressed genes induced by stable knockdown of YTHDC1. B Gene set enrichment analysis (GSEA) shows that ferroptosis system is altered in YTHDC1 knockdown cells compared with control cells in A549 cells. C, D Colony formation assays are conducted to clarify the effect of YTHDC1 on the RSL3-induced ferroptosis in A549 and H1299 cells. Results are evaluated using the two-tailed Student’s t-test. E, F RSL3 treatment is conducted to clarify the effect of YTHDC1 on the ferroptosis in A549 and H1299 cells. Cell proliferation is detected by CCK-8 assays and IC50 curves are generated using Graphpad Prism 8.0. G, H CCK-8 assays are conducted to clarify the effect of YTHDC1 on the Erastin-induced ferroptosis in A549 and H1299 cells. Results are evaluated using the two-tailed Student’s t-test. I The expression levels of PTGS2 are detected in A549 and H1299 cells treated with RSL3 for 48 h. Results are evaluated using the two-tailed Student’s t-test. J ROS are detected by flow cytometry. A549 cells are treated with RSL3 (800 nM) for 24 h, followed by incubation with DHE for 60 min at 37 °C. Results are evaluated using the two-tailed Student’s t-test. K Morphological changes of ferroptosis are detected using transmission electron microscopy. Scale bars represent 1 μm. *P < 0.05; **P < 0.01.
Fig. 4
Fig. 4. YTHDC1 regulates FSP1 at the post-transcriptional level in an m6A-dependent manner.
A FSP1 inhibitor iFSP1 treatment is conducted to clarify the effect of YTHDC1 on the ferroptosis in A549 and H1299 cells. Cell proliferation is detected by CCK-8 assays and IC50 curves are generated using Graphpad Prism 8.0. B The expression levels of GPX4 and FSP1 mRNA are detected by qRT-PCR in A549 and H1299 cells after knockdown of YTHDC1. Results are evaluated using the two-tailed Student’s t-test. C The GPX4 and FSP1 protein levels are detected by WB in A549 and H1299 cells after knockdown of YTHDC1. D By using SRAMP prediction server (http://www.cuilab.cn/sramp), a mammalian m6A sites predictor, we identified most of the m6A sites are located in the 3’-UTR of FSP1 mRNA. A proximal polyadenylation site (PAS) and a distal PAS are found in the NCBI Gene (https://www.ncbi.nlm.nih.gov/gene). E The m6A RNA modification of FSP1 mRNA and the binding effects of YTHDC1 to FSP1 mRNA are detected by MeRIP and RIP assays in A549 and H1299 cells. F The expression levels of FSP1 mRNA are detected by qRT-PCR in A549 after knockdown of METTL3. G The FSP1 protein levels are detected by WB in A549 cells after knockdown of METTL3. The numbers represent the quantification results of the WB. H Rescue effect of siMETTL3 on the upregulation of FSP1 protein induced by YTHDC1 knockdown in A549 cells. The numbers represent the quantification results of the WB. I, J The nuclear and cytoplasmic fractions of FSP1 mRNA are detected by qRT-PCR after knockdown of YTHDC1 in A549 and H1299 cells. K, L Stability of FSP1 mRNA over 10 h is measured by qRT-PCR relative to time 0 h after blocking new RNA synthesis with Actinomycin D (5 μg/mL) in A549 and H1299 cells with stable knockdown of YTHDC1. Results are evaluated using the two-tailed Student’s t-test. #P > 0.05; *P < 0.05; **P < 0.01.
Fig. 5
Fig. 5. YTHDC1 knockdown regulates the alternative polyadenylation and increases the long isoform of FSP1 mRNA, which can be bound and stabilized by HuR protein.
A The longer isoform of FSP1 mRNA is detected using two primers targeting 3′-UTR of FSP1 mRNA in A549 and H1299 cells. The targeting sites of the primers are shown in Fig. 4D. B The binding effects of YTHDC1 and CSTF3 are detected by Co-IP assays in A549 and H1299 cells. C The co-localization of Flag-tagged YTHDC1 and CSTF3 are detected using a confocal microscopy in A549 cells. D The binding effect of FSP1 mRNA 3′-UTR (FSP1 mRNA region: 1430-3137) to the HuR, HNRNPC, TARDBP and RBM10 proteins are predicted using catRAPID omics v2.1. E The binding effect of FSP1 mRNA by HuR protein is detected by RIP assay in A549 cells. F Stability of FSP1 mRNA over 10 h is measured by qRT-PCR relative to time 0 h after blocking new RNA synthesis with Actinomycin D (5 μg/mL) in A549 cells after knockdown of HuR. G A549 cells are transfected with siRNAs targeting HuR, and FSP1 protein levels are detected using WB. H RSL3 treatment is conducted to clarify the effect of HuR on the ferroptosis in A549 cells. Cell proliferation is detected by CCK-8 assays and IC50 curves are generated using Graphpad Prism 8.0. I The binding region of FSP1 mRNA by HuR protein is detected by RNA pulldown assays in A549 cells. J The binding effects of wild type and mutant 3’-UTR of FSP1 mRNA to HuR protein are detected by RNA pulldown assays in A549 cells. K The binding effects of wild type and mutant 3’-UTR of FSP1 mRNA to HuR protein are detected by Luciferase reporter assays in A549 cells. L The binding effects of FSP1 mRNA by HuR protein are detected by RIP assays in A549 cells with stable knockdown of YTHDC1. Results are evaluated using the two-tailed Student’s t-test. #P > 0.05; *P < 0.05; **P < 0.01.
Fig. 6
Fig. 6. YTHDC1 provides a ferroptotic vulnerability for lung cancer treatment.
A Cell proliferation is detected by CCK-8 assays after transfection with siRNA targeting FSP1 in shNC and shYTHDC1 A549 cells. The difference between cell proliferation curves is evaluated using repeated measures analysis of variance. B RSL3 treatment is conducted to clarify the rescue effect of FSP1 on the ferroptosis resistance induced by YTHDC1 knockdown in A549 cells. Cell proliferation is detected by CCK-8 assays. Results are evaluated using the two-tailed Student’s t-test. C RSL3 treatment is conducted to compare the ferroptosis sensitivity in lung cancer cells with different YTHDC1 protein levels. Cell proliferation is detected by CCK-8 assays and IC50 curves are generated using Graphpad Prism 8.0. D RSL3 treatment is conducted to compare the ferroptosis sensitivity in H460 cells after overexpression of YTHDC1. E Immunohistochemical staining of lung cancer tissues with 4-HNE in the same lung tumor tissues as Fig. 2A. Scale bars represent 50 μm. F IHC scores of 4-HNE in YTHDC1low and YTHDC1high lung tumor tissues are compared using Wilcoxon rank-sum test. YTHDC1low and YTHDC1high lung tumor tissues are defined as Fig. 2A. #P > 0.05; *P < 0.05; **P < 0.01.
Fig. 7
Fig. 7. A working model shows how YTHDC1 induces ferroptosis by regulating FSP1 in lung cancer.
AREs AU-rich elements, UTR untranslated region.

References

    1. Dixon SJ, Lemberg KM, Lamprecht MR, Skouta R, Zaitsev EM, Gleason CE, et al. Ferroptosis: an iron-dependent form of nonapoptotic cell death. Cell. 2012;149:1060–72. - PMC - PubMed
    1. Chen X, Li J, Kang R, Klionsky DJ, Tang D. Ferroptosis: machinery and regulation. Autophagy. 2021;17:2054–81. - PMC - PubMed
    1. Stockwell BR. A powerful cell-protection system prevents cell death by ferroptosis. Nature. 2019;575:597–8. - PMC - PubMed
    1. Li D, Li Y. The interaction between ferroptosis and lipid metabolism in cancer. Signal Transduct Target Ther. 2020;5:108. - PMC - PubMed
    1. Wu M, Xu LG, Su T, Tian Y, Zhai Z, Shu HB. AMID is a p53-inducible gene downregulated in tumors. Oncogene. 2004;23:6815–9. - PubMed

Publication types