. 2024 Jan;8(1):43-62.
doi: 10.1038/s41562-023-01729-z. Epub 2023 Oct 30.

Self-regulating arousal via pupil-based biofeedback

Affiliations

Self-regulating arousal via pupil-based biofeedback

Sarah Nadine Meissner et al. Nat Hum Behav. 2024 Jan.

Abstract

The brain's arousal state is controlled by several neuromodulatory nuclei known to substantially influence cognition and mental well-being. Here we investigate whether human participants can gain volitional control of their arousal state using a pupil-based biofeedback approach. Our approach inverts a mechanism suggested by previous literature that links activity of the locus coeruleus, one of the key regulators of central arousal and pupil dynamics. We show that pupil-based biofeedback enables participants to acquire volitional control of pupil size. Applying pupil self-regulation systematically modulates activity of the locus coeruleus and other brainstem structures involved in arousal control. Furthermore, it modulates cardiovascular measures such as heart rate, and behavioural and psychophysiological responses during an oddball task. We provide evidence that pupil-based biofeedback makes the brain's arousal system accessible to volitional control, a finding that has tremendous potential for translation to behavioural and clinical applications across various domains, including stress-related and anxiety disorders.


Conflict of interest statement

S.N.M., M.B. and N.W. are founders and shareholders of an ETH spin-off called ‘MindMetrix’ that aims to commercialize pupil-based biofeedback, and have a patent application related to the method of pupil-based biofeedback (patent applicant: ETH Zurich; inventors: M.B., S.N.M., N.W., pending patent applications EP21704565.7 and US17/800,455). All other authors declare no competing interests.

Figures

Fig. 1
Fig. 1. Pupil-BF training.
a, Participants apply mental strategies that are believed to modulate the brain’s arousal levels mediated by nuclei such as the LC. Pupil size was measured by an eye tracker and fed back to the participant via an isoluminant visual display. b, In experiment 1A, healthy volunteers were informed about potential mental strategies of arousal regulation and then participated in 3 days (D1, D2, D3) of upregulation and downregulation trainings (30 trials each) while receiving either veridical pupil feedback (Ver FB) (pupil-BF group) or visually matched input/yoked feedback (Yoked FB) (control groups I and II). At the end of day 3, all participants performed 20 Up and 20 Down trials without receiving any feedback and were debriefed on which strategies they have used. c, Example trial of the experiment. Each trial consisted of (1) 7 s baseline measurements, (2) 15 s modulation phase where the pupil-BF group sees a circle that dynamically changes its diameter as a function of pupil size (veridical feedback), (3) 2 s of colour-coded post-trial performance feedback (green, average circle size during modulation; black, maximum (Up) or minimum (Down) circle size during modulation) and (4) 5 s break. The upper panel shows an example of what participants would see on their screen, while the red line in the lower panel indicates measured pupil size. Note that the control groups I and II see a circle that changes independently of pupil size but resembles that for a participant in the pupil-BF group.
Fig. 2
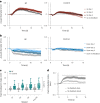
Fig. 2. Pupil-BF training results.
a,b, Average changes in pupil size during 15 s upregulation (a) and downregulation (b) are shown for the pupil-BF (n = 27) and initial control group (n = 27) for training sessions on days 1, 2 and 3, and for the no-feedback post-training session of experiment 1A. c, The pupil modulation index reflects the difference between the average pupil size during the two conditions (Up–Down) and is shown for each session (days 1, 2 and 3, and for the no-feedback post-training session) and group (initial control group vs pupil-BF group of experiment 1A; dots and squares represent individual participants). Pupil modulation indices were generally higher in the pupil-BF group (n = 27) compared with the initial control group (n = 27; robust ANOVA, main effect of group: F(1,21.58) = 21.49; P = 0.001, ηp2 = 0.50; other main effects/interaction P ≥ 0.07) d, Time series of pupil modulation index measured during the no-feedback session before (pre, light grey) and after pupil-BF training (post, dark grey) in experiment 1B (independent cohort, n = 25). Solid black line at the top indicates clusters of significantly higher modulation indices after training compared with before (SPM1D repeated-measures ANOVA; main effect session; z* = 11.84; largest cluster P = 0.037; smallest cluster P = 0). Shaded areas indicate s.e.m. Boxplots indicate median (centre line), 25th and 75th percentiles (box), and maximum and minimum values (whiskers). For a replication of results in control group II, see Supplementary Fig. 3. All post-hoc tests were two-tailed and corrected for multiple comparisons. For more detailed information on statistical parameters, see Supplementary Table 5.
Fig. 3
Fig. 3. Brainstem fMRI results.
a, Pupil size changes averaged across participants for Up and Down trials showing successful pupil size self-regulation during brainstem fMRI recording. The solid black line at the bottom indicates a cluster of significantly higher baseline-corrected pupil sizes during Up than during Down trials (two-tailed SPM1D paired-samples t-test; P = 0; z* = 3.45). b, Activity during Up versus Down phases of pupil self-regulation in the different ROIs. Statistical comparisons (n = 22) revealed significant effects (Up > Down) in the LC and the SN/VTA but not in the SC and DRN (two-tailed paired-samples t-test). Results for the NBM (two-tailed Wilcoxon signed-rank test) did not survive multiple comparison correction. c, Correlation between continuous pupil size changes and BOLD response changes shown as z-values for the different ROIs. Statistical comparison (against 0; two-tailed; n = 22) revealed significant effects for the LC, SN/VTA, NBM and DRN (one-sample t-test) but not for the SC (Wilcoxon signed-rank test). All ROI analyses in b and c were sequential Bonferroni-corrected for multiple comparison. Squares represent individual data d, Top: correlation analysis revealed that LC BOLD activity covaries significantly with continuous changes in pupil diameter (GLM; cluster-corrected for multiple comparisons at z = 2.3; P < 0.05). Bottom: brainstem areas other than the LC exhibited a significant correlation between changes in pupil diameter and BOLD activity (GLM; cluster-corrected for multiple comparisons at z = 2.3; P < 0.05). For a complete overview of regions, see Supplementary Table 2b. White outlines in d indicate different brainstem and basal forebrain regions. e, A-priori-defined ROIs in the brainstem and basal forebrain in MNI space. Boxplots indicate median (centre), 25th and 75th percentiles (box), maximum and minimum values (whiskers). Shaded areas and error bars indicate s.e.m. Post-hoc comparisons were corrected for multiple comparisons. For detailed information on statistical parameters, see Supplementary Table 5.
Fig. 4
Fig. 4. Whole-brain fMRI results.
a, Changes in pupil size averaged across all participants for Up (red) and Down (blue) trials showing successful self-regulation of pupil size during whole-brain fMRI recordings. The solid black line at the bottom indicates a cluster of significantly higher baseline-corrected pupil sizes during Up than during Down trials (two-tailed SPM1D paired-samples t-test; P = 0; z* = 3.38). b, Whole-brain maps showing brain regions where BOLD activity correlates with pupil size changes throughout the fMRI runs (GLM). c, Whole-brain maps depicting brain regions that showed significant activation during Up (as compared to Down) trials (GLM). All activation maps in b and c are thresholded at z > 3.1 and FWE-corrected for multiple comparisons using a cluster significance level of P < 0.05. d, Estimated BOLD response represented by z-values for Up vs rest and Down vs rest extracted from the peak voxel of each significant cluster shown in c (n = 24). Boxplots indicate median (centre line), 25th and 75th percentiles (box), and maximum and minimum values (whiskers). Squares indicate individual participants (n = 24). Shaded areas indicate s.e.m.
Fig. 5
Fig. 5. Effects of pupil self-regulation on cardiovascular parameters.
a,b, Heart rate (a) and heart rate variability (HRV) (b) averaged for Up and Down trials across all participants for pupil-BF training (left; n = 14) and fMRI sessions (right; n = 24). HRV was estimated as the root mean square of successive differences (RMSSD). Self-regulation of pupil size systematically modulated heart rate with an increasingly larger difference between Up and Down trials over training sessions (repeated-measures ANOVA: ‘condition × session’ interaction: F(2.34, 30.37) = 3.37, P = 0.04, ηp2 = 0.21; Greenhouse–Geisser-corrected), which remained stable after training during fMRI (repeated-measures ANOVA; main effect ‘condition’; F(1,22) = 72.25, P < 0.001, ηp2 = 0.77). Self-regulation did not significantly modulate HRV during training (robust ANOVA: P = 0.90). After training during fMRI, HRV was descriptively higher during Down than during Up, but statistical comparisons did not reach significance (two-tailed Wilcoxon signed-rank test; brainstem session: P = 0.086; whole-brain session: P = 0.056; not corrected for multiple comparisons). c,d, Individual differences in heart rate (Up–Down differences) and RMSSD (Down–Up differences) for training (left; n = 14) and fMRI sessions (right; n = 24). The thick solid line represents the group average, thin lines represent individual data. e, Spearman rho correlation coefficients (two-tailed, sequential Bonferroni-corrected) between pupil modulation indices (that is, the difference between pupil diameter changes in the two conditions, Up–Down) and differences in heart rate (Up–Down) revealing a significant link following (right; during fMRI) but not before pupil-BF training (left). f, Non-significant Spearman rho correlation coefficients (two-tailed) between pupil modulation indices (Up–Down) and RMSSD differences (Down–Up) before (left) and after pupil-BF training during fMRI (right). Boxplots indicate median (centre line), 25th and 75th percentiles (box), and maximum and minimum values (whiskers). Error bars in c and d indicate s.e.m. BS, brainstem fMRI; WB, whole-brain fMRI. For more detailed information on statistical parameters, see Supplementary Table 5.
Fig. 6
Fig. 6. Pupil self-regulation combined with an oddball task.
a, Schematic depiction of an example trial (Up) of experiment 3. Participants reacted to targets (black sound-icon) by button press and ignored standards (grey sound-icon) while simultaneously upregulating, downregulating pupil size or counting backwards in steps of seven (control). b, Pupil size changes averaged across participants for Up, Down and control trials showing 1 s of the baseline and the 18 s modulation phase. c, Pupil size changes from baseline during modulation averaged across the respective condition showing significantly lower values in Down than in control and Up trials (robust repeated-measures ANOVA; n = 20; F(1.52,16.67) = 9.33, P = 0.003, ηp2 = 0.46; Down vs Up: ψ^=0.23;P=0.001; Down vs control: ψ^=0.14;P=0.005; for Up vs control: ψˆ = 0.10; P = 0.06; two-tailed post-hoc tests; corrected for multiple comparisons using Hochberg’s method). d, Baseline-corrected pupil dilation evoked by targets (left) and standards (right) for Up, Down and control trials. Solid lines indicate time windows of significantly smaller responses to targets in Up than in Down and control trials (left) and significantly larger responses to standards in Up and control than in Down trials (right; two-tailed post-hoc tests of SPM1D repeated-measures ANOVA; largest P = 0.017; smallest P = 0; Bonferroni-corrected). e, Left: behavioural performance of 21 participants depicting faster responses to targets during Down than during Up trials (repeated-measures ANOVA: F(2,40) = 35.97, P < 0.001, ηp2 = 0.64, Down vs Up: t(20) = −2.87, P = 0.009, d = 0.63) and control trials (Down vs control: t(20) = −7.19, P < 0.001, d = 1.57; Up vs control: t(20) = −6.04, P < 0.001, d = 1.32). Right: responses were also less variable in Down than in control trials (t(20) = −3.01, P = 0.02, d = 0.66; post-hoc tests of repeated-measures ANOVA on reaction time and s.d. of reaction times were two-tailed and sequential Bonferroni-corrected). Squares in c and e represent individual data. Boxplots indicate median (centre), 25th and 75th percentiles (box), maximum and minimum values (whiskers). Shaded areas indicate s.e.m.
Fig. 7
Fig. 7. Link between pupil data and behavioural performance during the auditory oddball task.
a,b, Single-trial analyses linking baseline pupil size (500 ms before target onset) with (a) relative pupil dilation responses (pupildilationresponsepeakbaselinepupilsize; two-tailed one-sample t-test: t(19) = −10.42, P < .001) and (b) reaction times towards targets. Left: two-tailed repeated-measures correlations for raw values: rrm = 0.14; P = 1.33 × 10−15. Right: for detrended values: rrm = 0.16; P = 1.16 × 10−20.

Similar articles

Cited by

References

    1. Jones BE. Activity, modulation and role of basal forebrain cholinergic neurons innervating the cerebral cortex. Prog. Brain Res. 2004;145:157–169. doi: 10.1016/S0079-6123(03)45011-5. - DOI - PubMed
    1. Jones BE. Arousal systems. Front. Biosci. 2003;8:s438–s451. doi: 10.2741/1074. - DOI - PubMed
    1. Hasselmo ME, Sarter M. Modes and models of forebrain cholinergic neuromodulation of cognition. Neuropsychopharmacology. 2011;36:52–73. doi: 10.1038/npp.2010.104. - DOI - PMC - PubMed
    1. Aston-Jones G, Cohen JD. An integrative theory of locus coeruleus-norepinephrine function: adaptive gain and optimal performance. Annu. Rev. Neurosci. 2005;28:403–450. doi: 10.1146/annurev.neuro.28.061604.135709. - DOI - PubMed
    1. Cazettes, F., Reato, D., Morais, J. P., Renart, A. & Mainen, Z. F. Phasic activation of dorsal raphe serotonergic neurons increases pupil size. Curr. Biol. 31, 192–197.e4 (2020). - PMC - PubMed