Clinical Trial
. 2024 Jan;5(1):47-65.
doi: 10.1038/s43018-023-00653-5. Epub 2023 Oct 30.

Imetelstat-mediated alterations in fatty acid metabolism to induce ferroptosis as a therapeutic strategy for acute myeloid leukemia

Affiliations
Clinical Trial

Imetelstat-mediated alterations in fatty acid metabolism to induce ferroptosis as a therapeutic strategy for acute myeloid leukemia

Claudia Bruedigam et al. Nat Cancer. 2024 Jan.

Abstract

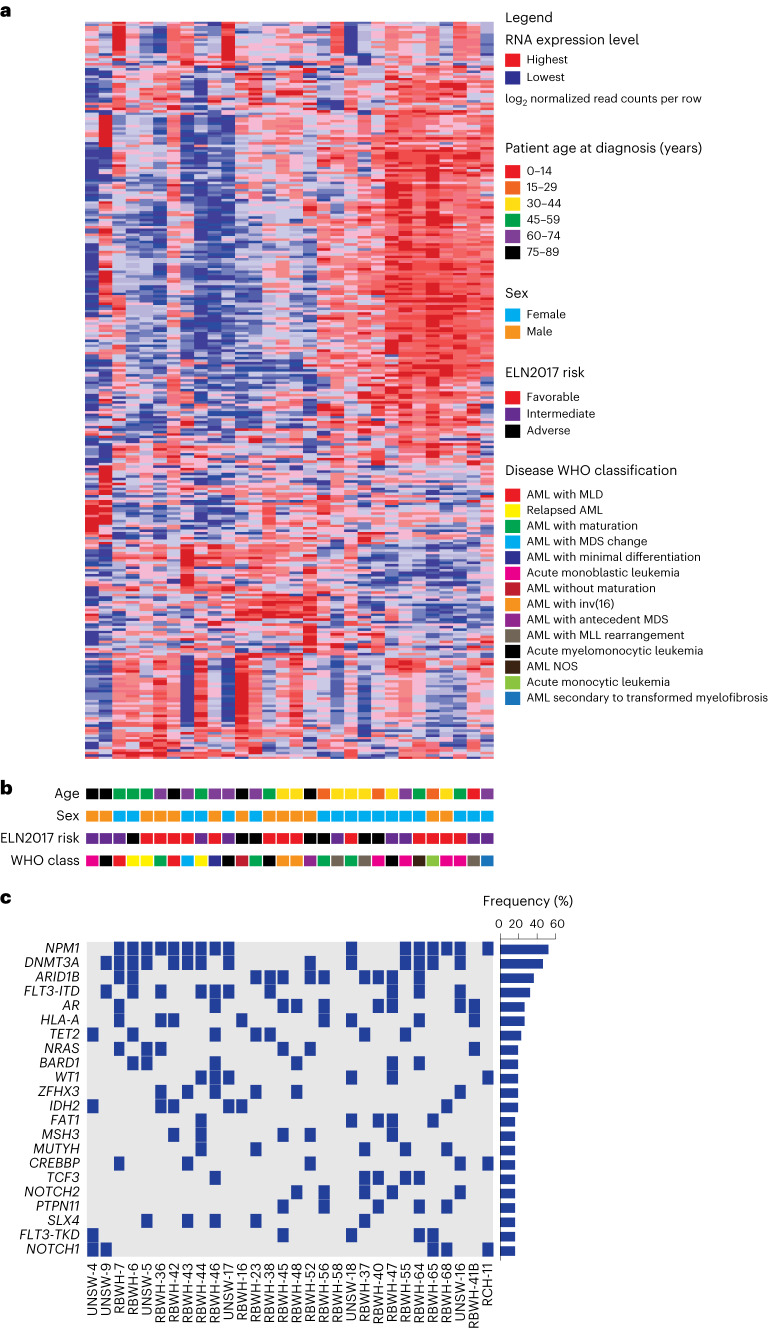
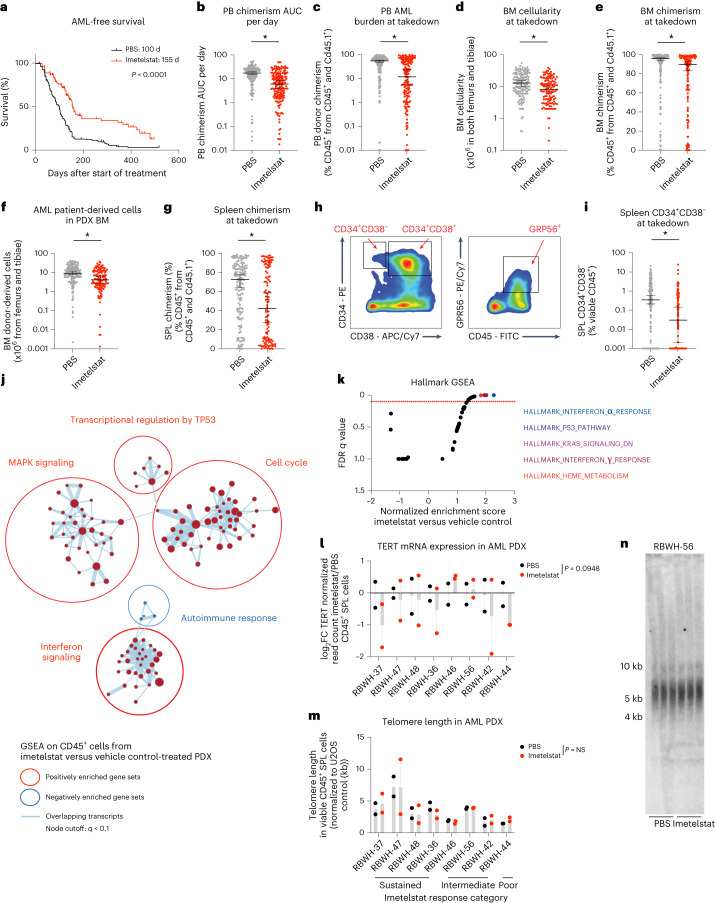
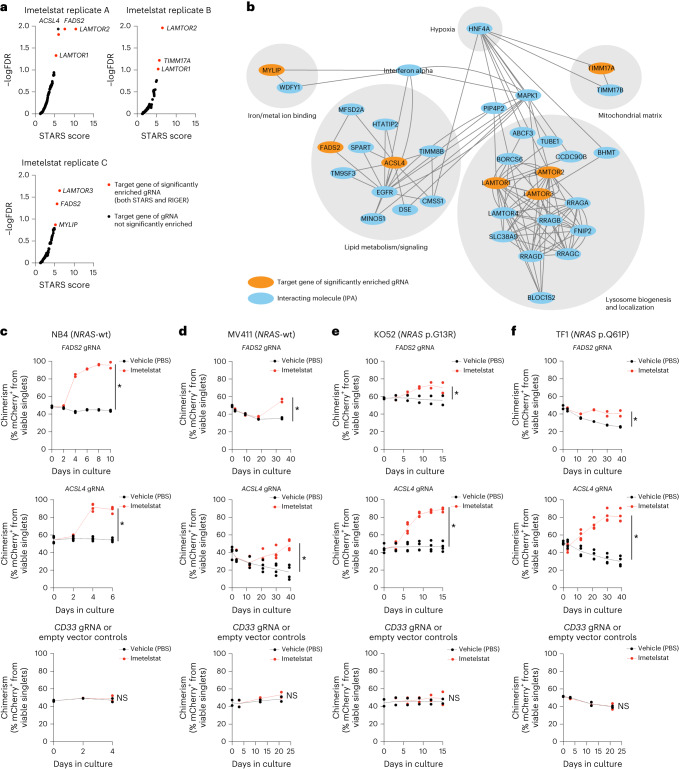
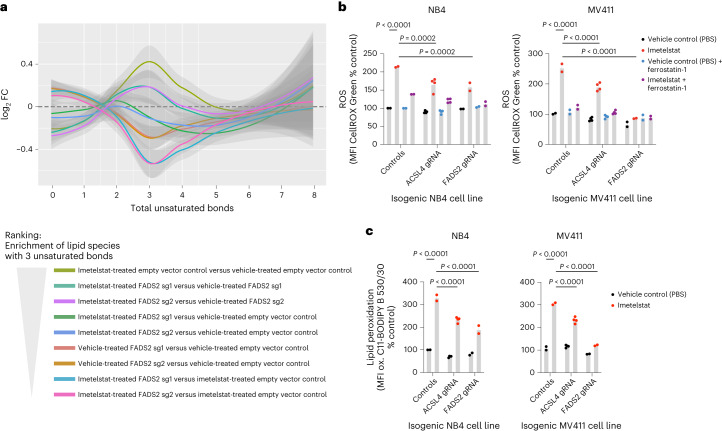
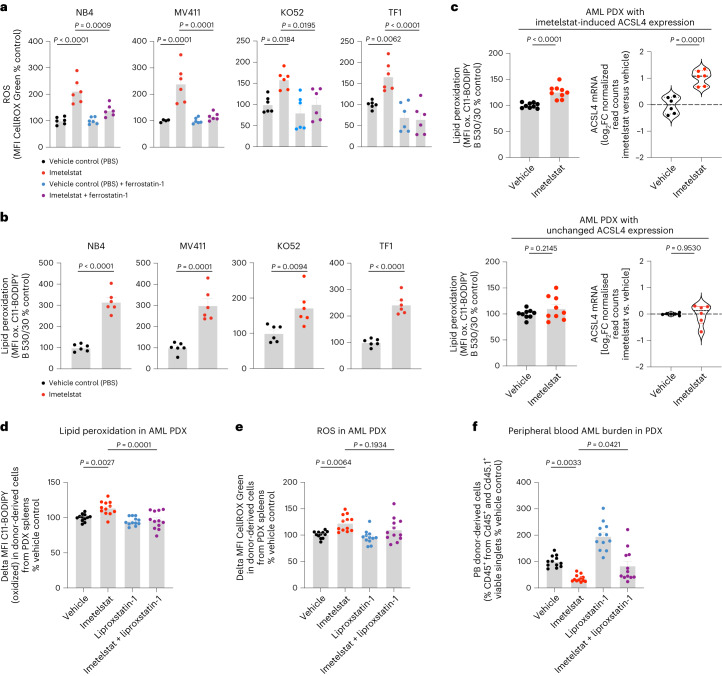
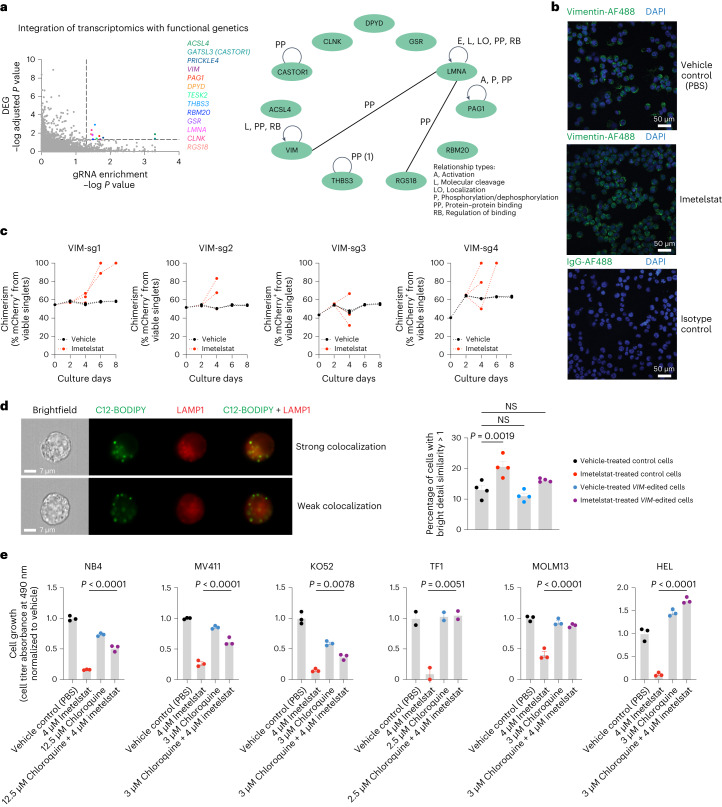
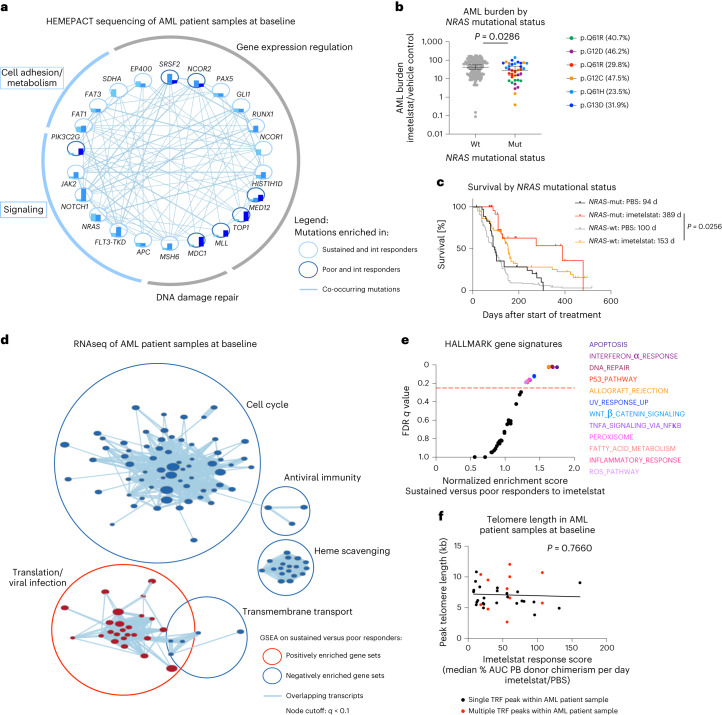
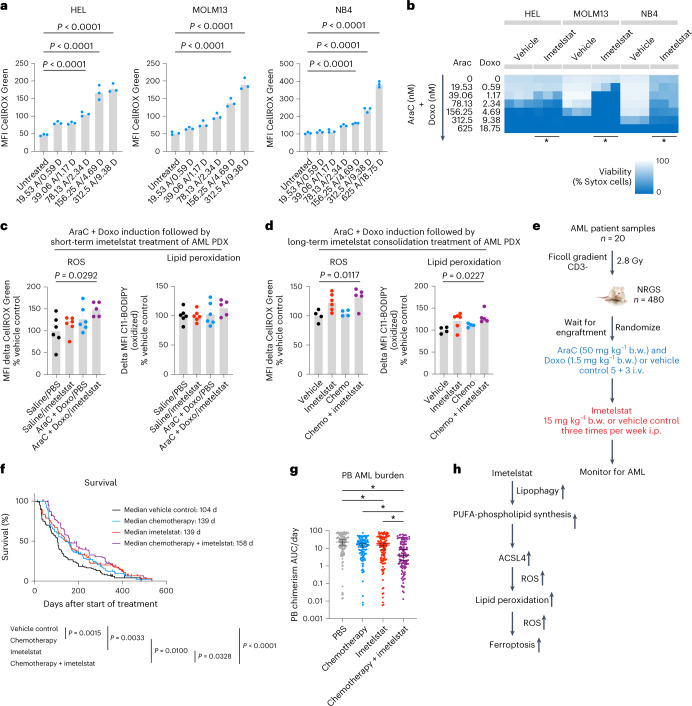
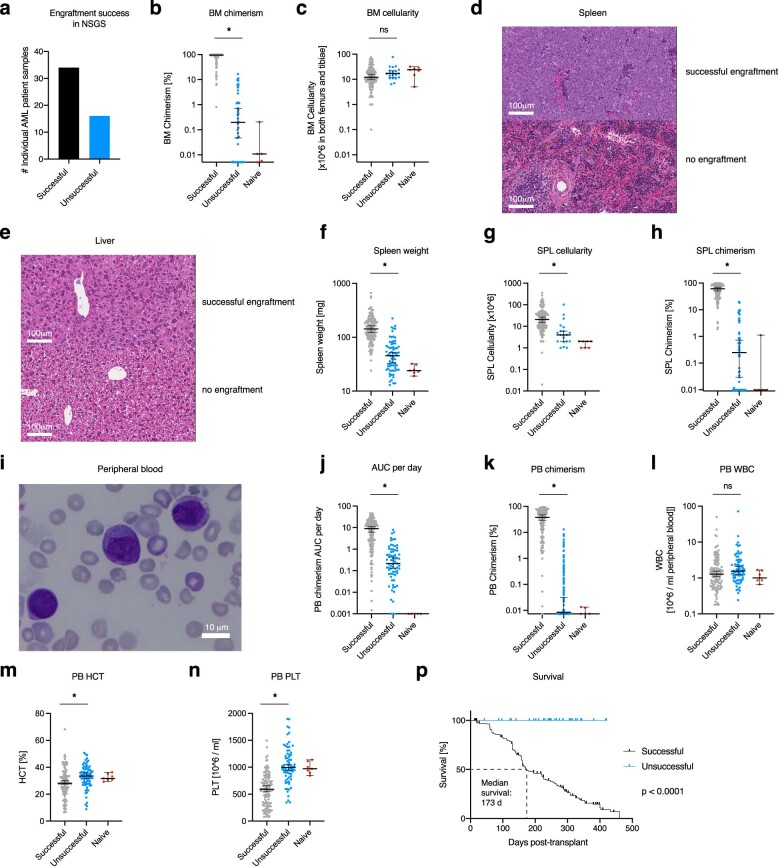
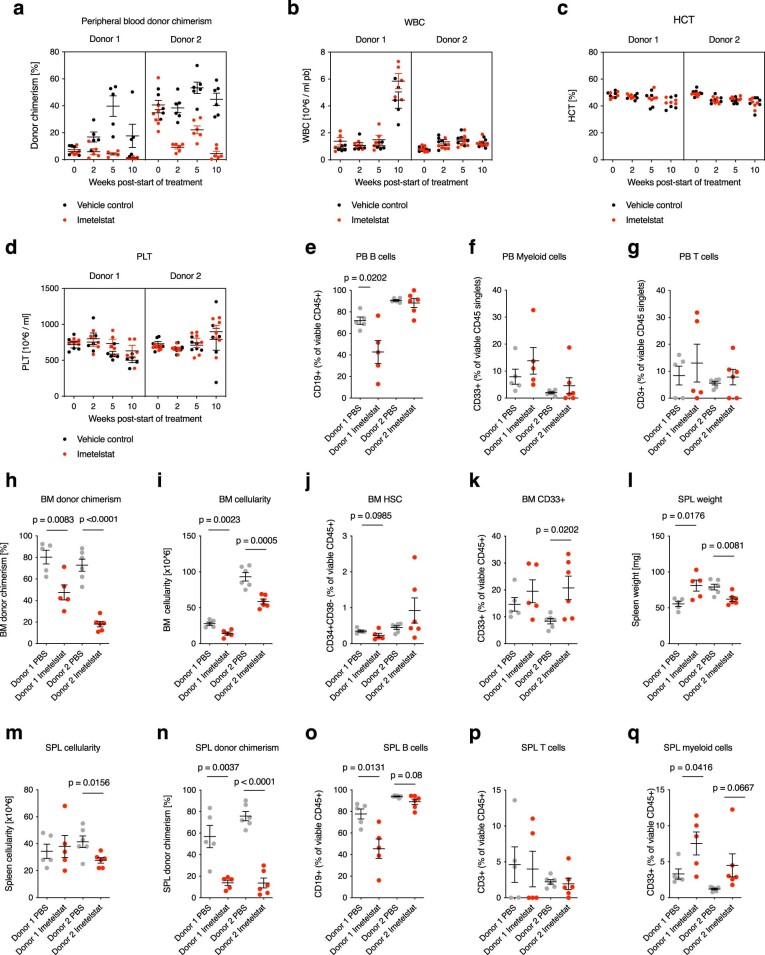
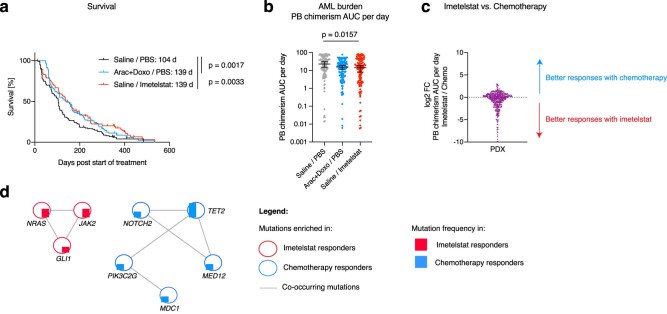
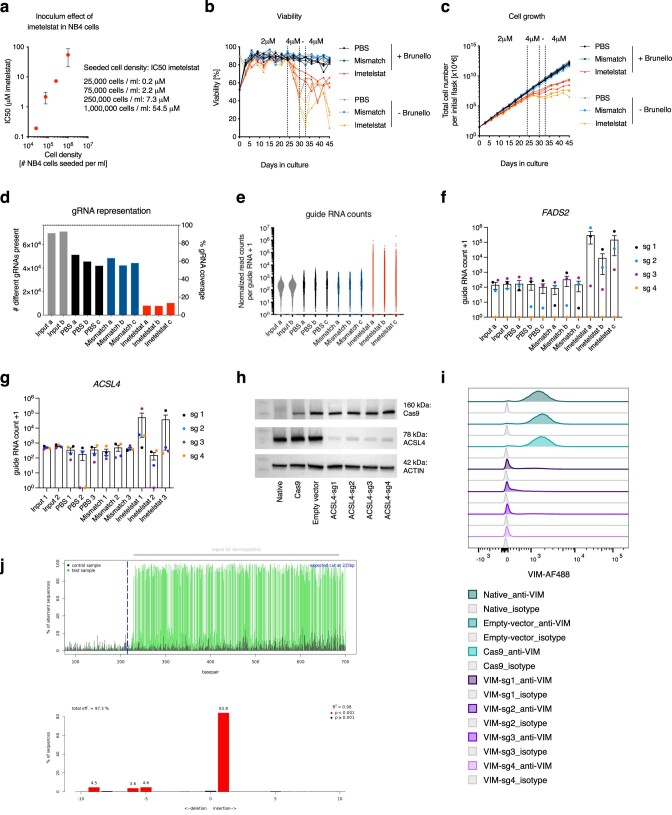
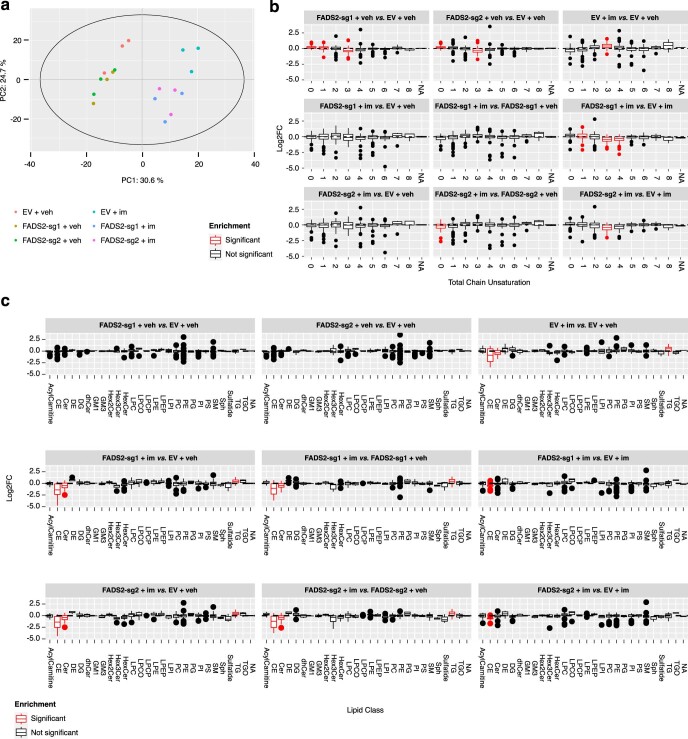
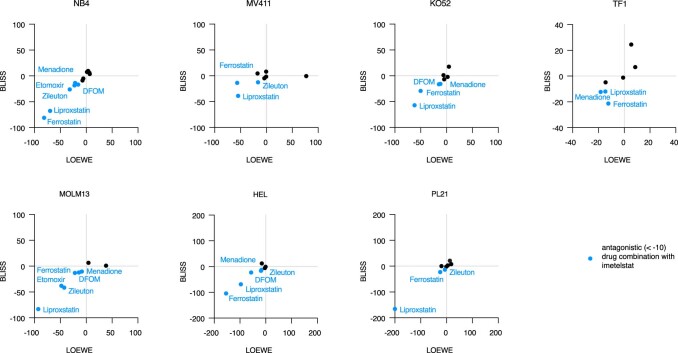
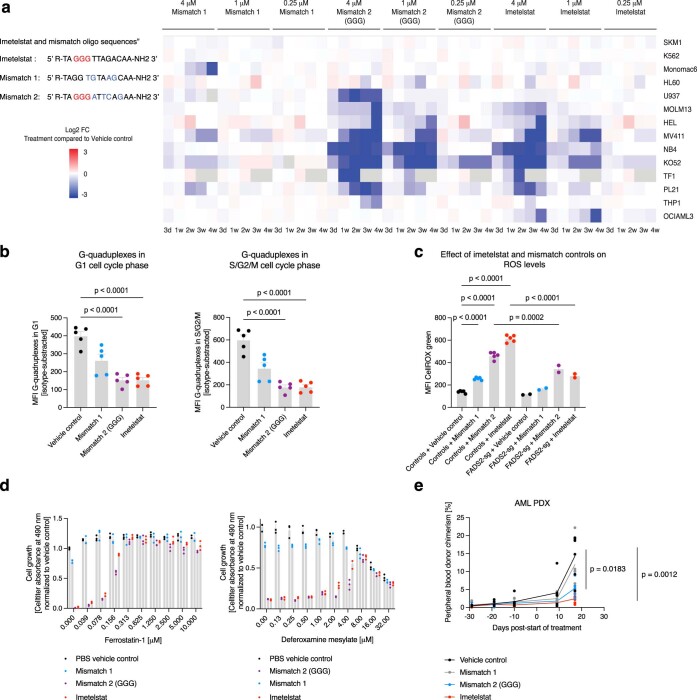
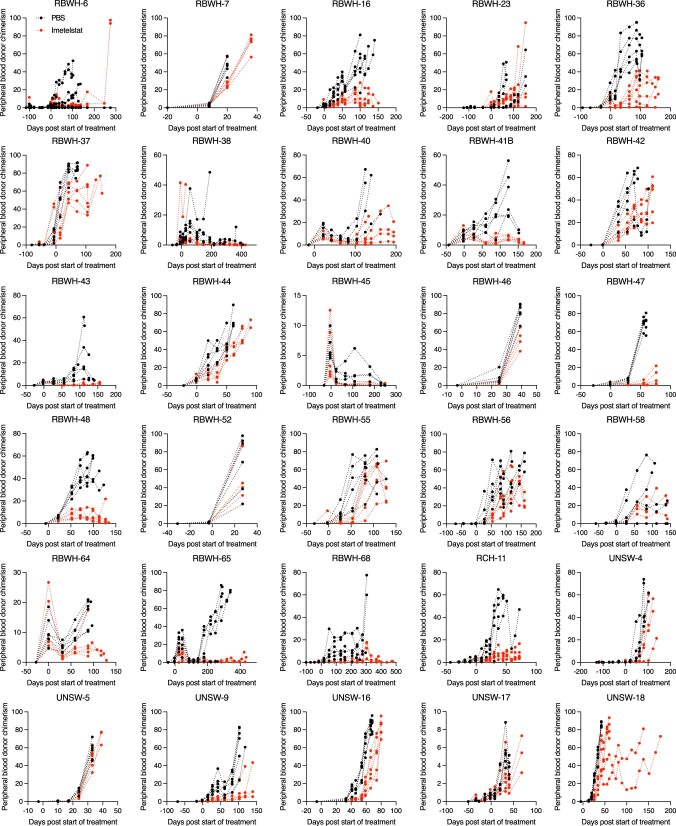
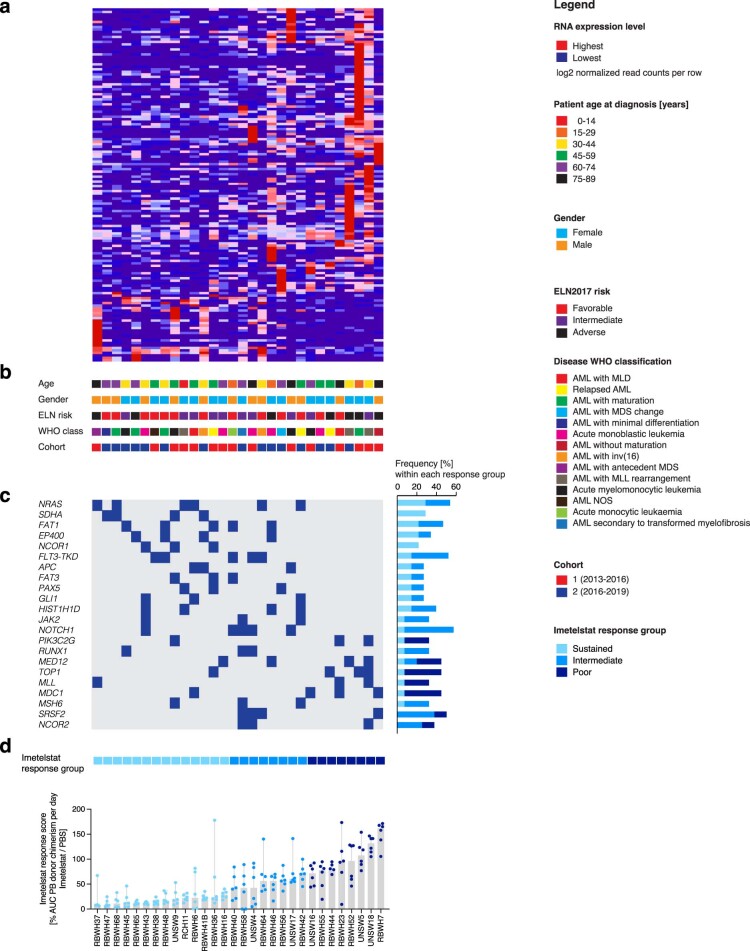
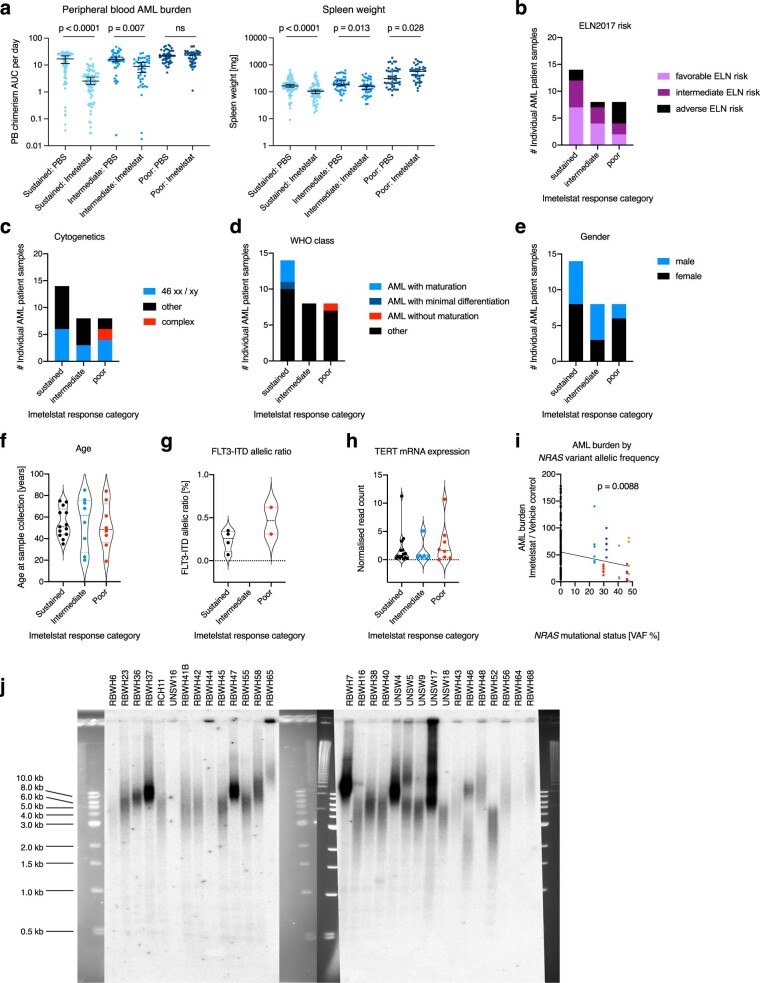
Telomerase enables replicative immortality in most cancers including acute myeloid leukemia (AML). Imetelstat is a first-in-class telomerase inhibitor with clinical efficacy in myelofibrosis and myelodysplastic syndromes. Here, we develop an AML patient-derived xenograft resource and perform integrated genomics, transcriptomics and lipidomics analyses combined with functional genetics to identify key mediators of imetelstat efficacy. In a randomized phase II-like preclinical trial in patient-derived xenografts, imetelstat effectively diminishes AML burden and preferentially targets subgroups containing mutant NRAS and oxidative stress-associated gene expression signatures. Unbiased, genome-wide CRISPR/Cas9 editing identifies ferroptosis regulators as key mediators of imetelstat efficacy. Imetelstat promotes the formation of polyunsaturated fatty acid-containing phospholipids, causing excessive levels of lipid peroxidation and oxidative stress. Pharmacological inhibition of ferroptosis diminishes imetelstat efficacy. We leverage these mechanistic insights to develop an optimized therapeutic strategy using oxidative stress-inducing chemotherapy to sensitize patient samples to imetelstat causing substantial disease control in AML.


Conflict of interest statement

S.W.L. has received research funding from Janssen related to imetelstat (2016–2018). For research beyond this study, S.W.L. has received funding from Celgene/Bristol Myers Squibb (2019–2022), consultancy from Abbvie (2021–2023) and advisory board fees from Abbvie and Astellas (2020–2021). The remaining authors declare no competing interests.

Figures

Fig. 1
Fig. 1. Integrative analysis of samples from patients with AML.
a, Unsupervised hierarchical clustering analysis on the expression of 300 transcripts with the greatest variance-to-mean ratios among 30 individual AMLs from our repository that can successfully generate AML PDX. MLD, multi-lineage dysplasia; MDS, myelodysplastic syndromes; MLL, mixed-lineage leukemia; NOS, not otherwise specified. b, Key clinical characteristics of patients from whom AML samples were derived including age at diagnosis, sex, ELN2017 prognostic risk group and WHO class of disease. c, OncoPrint of the most frequently detected mutations in AMLs by targeted next-generation sequencing of 585 genes associated with hematological malignancies (the MSKCC HemePACT assay). Source data
Fig. 2
Fig. 2. The efficacy of imetelstat in a randomized phase II-like preclinical trial in AML PDX.
a, Two-tailed Kaplan–Meier survival analysis of vehicle control (PBS; n = 180) or imetelstat-treated (n = 180) AML PDX. P < 1 × 10−4 according to Gehan–Breslow–Wilcoxon. bg, Analysis of AML disease parameters. Peripheral blood (PB) donor chimerism area under the curve (AUC) per day (b), end point PB donor chimerism (c), bone-marrow (BM) cellularity (d), BM chimerism (e), the number of AML donor-derived cells in PDX BM (f) and splenic (SPL) donor chimerism (g). h,i, Flow cytometric analysis of AML surface marker expression CD34, CD38 and GPR56. Gating strategy (h). The percentage of CD34+CD38 viable CD45+ SPL singlets (i). Data are presented as median ± 95% confidence interval (CI) (bg,i). Statistical analysis was performed on log-transformed data using an unpaired two-sided t-test, considering detection limits at 1 × 10−3. P = 2.21 × 10−10 (b), P = 7.79 × 10−8 (c), P = 1.37 × 10−4 (d), P = 7.32 × 10−3 (e), P = 8.82 × 10−5 (f), P = 1.83 × 10−3 (g), P = 7.44 × 10−5 (i). Asterisks (*) denote statistically significant comparisons with P < 5 × 10−2. j,k, GSEA on RNA-seq data from sorted viable hCD45+ cells collected from imetelstat or PBS-treated AML PDXs. n = 16 AML PDXs per treatment group. Cytoscape nodes represent gene sets with a cutoff of q < 0.1 (j); GSEA on hallmark signatures with the top five enriched signatures highlighted in color (k). ln, TERT messenger RNA (mRNA) expression results obtained from RNA-seq analysis described as above (l). FC, fold change. Telomere length in viable CD45+ SPL cells from imetelstat versus PBS-treated AML PDXs measured by qPCR (m) and confirmed by telomeric restriction fragment analysis (n). Statistical analysis (l,m) was based on paired two-tailed t-tests comparing AML PDXs treated with imetelstat (n = 16) or PBS (n = 16). P = 9.48 × 10−2 (l), P > 5 × 10−2 (m). Data are presented as mean ± s.e.m. NS, not significant. Source data
Fig. 3
Fig. 3. Identification of key mediators of imetelstat efficacy using genome-wide CRISPR/Cas9 editing.
Brunello CRISPR/Cas9 positive enrichment screen in NB4 cells. a, gRNA enrichment analysis using STARS and RIGER gene-ranking algorithms in n = 3 independent imetelstat-treated biological replicates. Red circles indicate significantly enriched targets (STARS false discovery rate (FDR) < 0.15 and RIGER score >2.0). b, Cytoscape visualization of the ingenuity pathway analysis (IPA)-derived interaction network connecting the identified significantly enriched gRNA targets. cf, Competition assays of imetelstat- (red) versus vehicle control (PBS; black)-treated Cas9-expressing NB4 (c), MV411 (d), KO52 (e) and TF1 (f) cultures transduced with n = 2 independent sgRNAs targeting FADS2 (top), n = 4 independent sgRNAs targeting ACSL4 (middle) and n = 2 controls (empty vector and gRNA targeting CD33). Three technical replicates per condition from two independent experiments were pooled. Asterisks (*) denote statistically significant comparisons based on distinct 95% CI on mCherry chimerism AUC between imetelstat and PBS-treated cultures. 95% CI (lower limit, upper limit): NB4 FADS2 PBS (444.4, 456.7) versus imetelstat (771.9, 795.9); ACSL4 PBS (320.1, 344.4) versus imetelstat (428.3, 459.6); editing controls PBS (186.0, 197.8) versus imetelstat (185.4, 203.4) (c). MV411 FADS2 PBS (1,253, 1,302) versus imetelstat (1,421, 1,525); ACSL4 PBS (847.8, 1,160) versus imetelstat (1,262, 1,564); editing controls PBS (896.2, 1,030) versus imetelstat (943.8, 1,073) (d). KO52 FADS2 PBS (812.3, 907.0) versus imetelstat (949.8, 1,023); ACSL4 PBS (648.9, 743.3) versus imetelstat (1,020, 1,095); editing controls PBS (635.3, 727.6) versus imetelstat (654.9, 760) (e). TF1 FADS2 PBS (1,280, 1,325) versus imetelstat (1,585, 1,721); ACSL4 PBS (1,381, 1,644) versus imetelstat (2,486, 2,788); editing controls PBS (905.9, 982.8) versus imetelstat (888.2, 993.3) (f). Source data
Fig. 4
Fig. 4. Imetelstat is a potent inducer of ferroptosis.
a, Lipid desaturation analysis of FADS2-edited (FADS2-sg1 and FADS2-sg2) or non-edited (empty vector control) NB4 cells treated with imetelstat (4 μM at a seeding density of 2.5 × 105 cells per ml culture) or vehicle control (PBS) for 24 h. The graph depicts the median log2FC of the number of total unsaturated bonds in lipid species in the respective comparisons outlined in the legend. Shading represents the 95% CI. n = 3 replicates from distinct cell passages and independent experiments. b,c, CellROX Green (b) and C11-BODIPY (c) analysis in ACSL4-edited (n = 4 independent gRNAs), FADS2-edited (n = 2 independent gRNAs) or non-edited (n = 2 independent replicates, Cas9, empty vector) NB4 or MV411 cell lines treated with imetelstat (4 μM) or PBS. Time points of analysis were 24 h (NB4) and day 4 (MV411). Three technical replicates per condition were pooled. Data are presented as mean ± s.e.m. One-way analysis of variance (ANOVA) was used and adjusted for multiple comparisons. NB4, P < 1 × 10−4 (non-edited + PBS versus non-edited + imetelstat), P = 2 × 10−4 (non-edited + imetelstat versus ACSL4-edited + imetelstat), P = 2 × 10−4 (non-edited + imetelstat versus FAD2S-edited + imetelstat); MV411, P < 1 × 10−4 (non-edited + PBS versus non-edited + imetelstat), P < 1 × 10−4 (non-edited + imetelstat versus ACSL4-edited + imetelstat), P < 1 × 104 (non-edited + imetelstat versus FADS2-edited + imetelstat) (b). NB4, P < 1 × 10−4 (non-edited + PBS versus non-edited + imetelstat), P < 1 × 10−4 (non-edited + imetelstat versus ACSL4-edited + imetelstat), P < 1 × 10−4 (non-edited + imetelstat versus FADS2-edited + imetelstat); MV411, P < 1 × 10−4 (non-edited + PBS versus non-edited + imetelstat), P < 1 × 10−4 (non-edited + imetelstat versus ACSL4-edited + imetelstat), P < 1 × 10−4 (non-edited + imetelstat versus FADS2-edited + imetelstat) (c). A repeat experiment was performed that replicated the results. Source data
Fig. 5
Fig. 5. Lipid ROS scavenging diminishes imetelstat efficacy.
a,b, CellROX Green (a) and C11-BODIPY (b) flow cytometry on NB4, MV411, KO52 and TF1 treated with imetelstat (4 μM) or vehicle control (PBS). n = 6 replicates pooled from two experiments. Time points of analysis were 24 h (NB4) and day 4 (MV411), day 8 (KO52) and day 5 (TF1). Data are presented as mean ± s.e.m. a, One-way ANOVA was used and adjusted for multiple comparisons. NB4, P < 1 × 10−4 (NB4 PBS versus imetelstat), P = 9 × 10−4 (imetelstat versus imetelstat + ferrostatin); MV411, P = 1 × 10−4 (PBS versus imetelstat), P = 1 × 10−4 (imetelstat versus imetelstat + ferrostatin); KO52, P = 1.84 × 102 (PBS versus imetelstat), P = 1.95 × 10−2 (imetelstat versus imetelstat + ferrostatin); TF1, P = 6.2 × 10−3 (PBS versus imetelstat), P < 1 × 10−4 (imetelstat versus imetelstat + ferrostatin). b, An unpaired two-sided t-test was used. NB4, P < 1 × 10−4; MV411, P = 1 × 10−4; KO52, P = 9.4 × 10−3; TF1, P < 1 × 10−4. c, C11-BODIPY and ACSL4 messenger RNA (mRNA) analysis on sorted viable CD45+ splenic cells from imetelstat- compared to PBS-treated PDXs from the preclinical trial presented in Fig. 2. C11-BODIPY data (n = 9 PDXs from three individual AML samples with three PDXs per patient sample) are presented as mean ± s.e.m. ACSL4 mRNA data (n = 6 PDXs from the same three individual AML samples with two PDXs per patient sample) are presented as violin plots. Statistics are based on an unpaired two-sided t-test: P < 1 × 10−4 (MFI C11-BODIPY, top), P = 2.145 × 10−1 (MFI C11-BODIPY, bottom); P = 1 × 10−4 (ACSL4, top), P = 9.53 × 10−1 (ACSL4, bottom). df, AML PDX treated with vehicle, liproxstatin-1, imetelstat or a combination of liproxstatin-1 with imetelstat for 2 weeks. n = 12 PDX per treatment group. C11-BODIPY (d) and CellROX (e) flow cytometry on splenic CD45+ singlets. PB chimerism (f) at the end of treatment. Data are presented as mean ± s.e.m. (df). One-way ANOVA was used and adjusted for multiple comparisons. P = 2.7 × 10−3 (vehicle versus imetelstat), P = 1 × 10−3 (imetelstat versus imetelstat + liproxstatin-1) (d). P = 6.4 × 10−3 (vehicle versus imetelstat), P = 1.934 × 10−1 (imetelstat versus imetelstat + liproxstatin-1) (e). P = 3.3 × 10−3 (vehicle versus imetelstat), P = 4.21 × 10−2 (imetelstat versus imetelstat + liproxstatin-1) (f). Source data
Fig. 6
Fig. 6. Integrative analysis of transcriptomics and functional genetics.
a, Integration of RNA-seq and CRISPR screen data using relaxed cutoffs (differential gene expression analysis-derived adjusted P < 0.05 and gRNA enrichment analysis-derived RIGER P < 0.05). Thirteen genes (colored dots) passed these cutoff criteria, of which 11 were annotated in ingenuity pathway analysis (IPA) (right). A common regulatory module for VIM, LMNA and RGS18 is highlighted through connecting lines. DEG, differentially expressed gene. b, Confocal microscopy of VIM protein in NB4 cells treated with vehicle control (PBS) or imetelstat for 24 h. Representative images of n = 6 biological replicates. DAPI, 4,6-diamidino-2-phenylindole. c, VIM-editing in NB4 using n = 4 independent sgRNAs. Competition assays of mCherry+ VIM-edited cells grown in the presence of mCherry-unedited control NB4 cells, treated with imetelstat (red) or vehicle (PBS) control (black). Plots show data from one representative experiment. Two independent repeats were performed. d, Imaging flow cytometry of lipophagy using C12-BODIPY and LAMP1 in n = 4 independent VIM-edited (VIM-sg1, VIM-sg2, VIM-sg3 and VIM-sg4) or n = 4 independent editing-control (native, Cas9, empty vector or CD33-sg2) NB4 cell lines. Recovery examples of cells showing strong colocalization of C12-BODIPY and LAMP1 indicative of lipophagy activity (top) or cells with weak colocalization indicating insignificant lipophagic flux. Quantification of the percentages of cells with strong colocalization defined as bright detail similarity score >1. Data are presented as mean ± s.e.m. Statistics are based on a one-way ANOVA adjusted for multiple comparisons to PBS-treated editing controls. Editing controls + PBS versus editing controls + imetelstat, P = 1.9 × 10−3; editing controls + PBS versus VIM-edited + PBS, P = 4.955 × 10−1; editing controls + PBS versus VIM-edited + imetelstat, P = 2.128 × 10−1. Comparisons were considered NS when P > 5 × 10−2. Data are from one experiment representative of four independent experiments. This experiment was repeated three times with similar results. e, Chloroquine and imetelstat combination treatments in AML cell lines. Data are presented as mean ± s.e.m. One-way ANOVA was used and adjusted for multiple comparisons. NB4 (n = 3 replicates), P < 1 × 10−4; MV411 (n = 3 replicates), P < 1 × 10−4; KO52 (n = 3 replicates), P = 8 × 10−3; TF1 (n = 2 replicates), P = 5.1 × 10−3; MOLM13 (n = 3 replicates), P < 1 × 10−4; HEL (n = 3 replicates), P < 1 × 10−4. Each experiment was repeated once with similar results. Source data
Fig. 7
Fig. 7. Mutant NRAS and oxidative stress gene expression signatures associate with sustained responses to imetelstat.
Segregation of samples from patients with AML into sustained, intermediate and poor imetelstat response groups based on PB AML burden with n = 14 (sustained), n = 8 (intermediate) and n = 8 (poor). a, Cytoscape visualization of the frequencies of genes with oncogenic mutations (based on the COSMIC database) in sustained (turquoise), intermediate (light blue) and poor (dark blue) responders to imetelstat. Connecting lines represent co-occurring mutations within the same AML patient sample. b, AML burden in imetelstat-treated normalized to vehicle control-treated PDXs in relation to NRAS mutational status. NRAS wild-type (wt; n = 144 PDXs) and mutant NRAS (mut; n = 36 PDXs). Statistics were conducted according to a two-sided t-test on log-transformed data: P = 2.86 × 10−2. c, Two-tailed survival analysis of PBS and imetelstat-treated AML PDXs divided into groups based on their NRAS mutation status. Median survival was 94 (PBS-treated NRAS-mut; n = 36 PDXs), 389 (imetelstat-treated NRAS-mut; n = 36 PDXs), 100 (PBS-treated NRAS-wt; n = 144) and 153 (imetelstat-treated NRAS-wt; n = 144) days from start of treatment. P = 2.56 × 10−2 comparing imetelstat-treated NRAS-mut to imetelstat-treated NRAS-wt PDX according to Gehan–Breslow–Wilcoxon. d, Cytoscape visualization of GSEA results on RNA-seq data from individual AML patient samples at baseline comparing sustained with poor responders to imetelstat (n = 14 sustained responders; n = 8 poor responders; node cutoff, q < 0.1). Red circles represent gene sets positively enriched in sustained versus poor responders to imetelstat. Blue circles represent negatively enriched gene sets in sustained versus poor responders to imetelstat. e, Hallmark GSEA on RNA-seq data comparing sustained versus poor responders to imetelstat at baseline. The red dotted line represents the cutoff considered for significant enrichment at FDR = 0.25. f, Simple linear regression analysis of baseline telomere length versus imetelstat response in PDXs. n = 30 AML patient samples. P = 7.66 × 10−1; F = 8.998 × 10−1; degrees of freedom numerator, degrees of freedom denominator = 1, 34; slope 95% CI (−2.219 × 10−1, 1.648 × 10−1); y intercept 95% CI (6.023, 8.449); x intercept 95% CI (367.9, +infinity). R2 = 2.639 × 10−3. Source data
Fig. 8
Fig. 8. Oxidative stress induction with standard chemotherapy to sensitize AML cells to imetelstat.
a, CellROX flow cytometry on AML cells treated with various concentrations of AraC + Doxo after 3 d in culture. n = 3 replicates from a representative experiment that was repeated independently showing similar results. Data are presented as mean MFI ± s.e.m. One-way ANOVA adjusted for multiple comparisons, P < 1 × 10−4 (HEL); P < 1 × 10−4 (MOLM13); P < 1 × 10−4 (NB4). AraC, cytarabine; Doxo, doxorubicin. b, Sytox flow cytometry on cultures after switching to imetelstat (4 μM). Heat maps represent viabilities (Sytox cell percentages). Asterisks (*) denote statistically significant differences (P < 5 × 10−2) between imetelstat-treated cells pretreated with 1.17 nM AraC + 39.06 nM Doxo (n = 3) versus imetelstat-treated controls that were not pretreated (n = 3) according to an unpaired two-sided t-test, P = 1.47 × 10−2 (HEL); P = 8.43 × 10⁻⁶ (MOLM13); P = 1.22 × 10−6 (NB4). c,d, C11-BODIPY and CellROX analysis on splenic CD45+ cells from PDXs (RBWH-44). Data are presented as mean ± s.e.m. One-way ANOVA adjusted for multiple comparisons. c, PDX received one dose of AraC + Doxo on day 1 followed by one dose of imetelstat on day 2 and were analyzed on day 3. AraC + Doxo + imetelstat (n = 5) versus vehicle (n = 6), P = 2.92 × 10−2 (MFI CellROX). d, PDX received a 5 + 3 AraC + Doxo cycle followed by imetelstat consolidation and were analyzed after 3 months. AraC + Doxo + imetelstat (n = 5) versus vehicle (n = 4), P = 1.117 × 10−2 (CellROX), P = 2.27 × 10−2 (C11-BODIPY). eg, PDX trial on imetelstat consolidation following induction chemotherapy. Experimental scheme (e), survival (f) and PB AML burden (g). n = 120 PDXs per treatment group. i.v., intravenous; i.p., intraperitoneal; b.w., body weight. f, Two-tailed Kaplan–Meier analysis according to Gehan–Breslow–Wilcoxon, P = 1.5 × 10−3 (vehicle versus AraC + Doxo); P = 3.3 × 10−3 (vehicle versus imetelstat), P = 1 × 10−2 (AraC + Doxo versus AraC + Doxo + imetelstat); P = 3.28 × 10−2 (imetelstat versus imetelstat + AraC + Doxo); P < 1 × 10−4 (vehicle versus AraC + Doxo + imetelstat). g, One-way ANOVA adjusted for multiple comparisons on log-transformed data. Asterisks (*) denote statistically significant differences, P = 2.3 × 10−2 (vehicle versus imetelstat); P = 2.2 × 10−3 (AraC + Doxo versus chemotherapy + imetelstat); P = 4.14 × 10−2 (imetelstat versus AraC + Doxo + imetelstat), P < 1 × 10−4 (vehicle versus AraC + Doxo + imetelstat). h, Model demonstrating the working hypothesis on imetelstat-induced ferroptosis in AML derived from this study. Source data
Extended Data Fig. 1
Extended Data Fig. 1. Generation of a comprehensive AML PDX Resource.
a, The number of AML patient samples that either successfully (gray) or unsuccessfully (blue) generated AML PDX using NSGS recipients. N = 50 patient samples were tested for engraftment in total. b-n, AML disease parameters in successfully (n = 196) or unsuccessfully (n = 73) transplanted NSGS. Bone marrow donor chimerism (b) and cellularity (×10^6 harvested from both femurs and tibiae; c). Histologic analysis of spleen (d) and liver (e) morphology in all individual AML PDX models (n = 30). Additional images are provided in the supplement. Spleen weight (f), spleen cellularity (g), and splenic donor chimerism (h). Peripheral blood blast morphology analysis at takedown using Wright-Giemsa staining (i), donor chimerism area under the curve (AUC) per day (j), donor chimerism at takedown (k), and white blood cell counts at takedown (l). Hematocrit percentage (m) and platelets (x10^6/mL; n) from peripheral blood at takedown. Data from n = 7 naïve NSGS (40 weeks old) are displayed as reference. Data are presented as median ± 95% Confidence Interval [CI]. Statistical analyses were performed on log-transformed data using unpaired two-sided t-test. P = 5.79 × 10−63 (b), P = 1.13 × 10⁻¹ (c), P = 9.18 × 10⁻³¹ (f), P = 3.59 × 10⁻⁶ (g), P = 7.98 × 10−60 (h), P = 1.65 × 10⁻²⁷ (j), P = 1.34E × 10−72 (k), P = 7.19 × 10−02 (l), P = 2.16 × 10−03 (m), P = 3.18 × 10⁻¹⁴ (n). Asterisks (*) denote statistically significant comparisons with P < 5 × 10⁻². p, AML-related survival analysis of successfully versus unsuccessfully generated AML PDX. Median survival was 173 days post-transplant in successfully generated AML PDX versus not reached for unsuccessfully generated AML PDX (follow-up > 365 days). Two-tailed P < 1 × 10⁻⁴ according to Gehan–Breslow-Wilcoxon; n = 196 (successfully), n = 73 (unsuccessfully) transplanted NSGS. Source data
Extended Data Fig. 2
Extended Data Fig. 2. The effect of imetelstat on normal hematopoiesis.
Humanized in vivo models of hematopoiesis were generated by transplanting viable CD34+ mononuclear cells isolated from cord blood samples from two independent donors into NSG recipients (donor 1: 56,000 cells per NSG, n = 5 NSG per treatment group; donor 2: 212,500 cells per NSG, n = 6 NSG per treatment group). Recipients were treated for 10 weeks with imetelstat (15 mg/kg body weight) or vehicle control three times per week starting one month after transplantation. a-d, Peripheral blood time course analysis of donor chimerism (a), white blood cell counts (WBC; b), hematocrit (HCT, c), and platelet levels (PLT; d). e-g, Flow cytometry analysis of peripheral blood for B cell surface marker expression (CD19; e), myeloid surface marker expression (CD33; f), and T cell surface marker expression (CD3; g) at 10 weeks post-start of treatment. h-k, Bone marrow analysis of cord blood recipients at 10 weeks post-start of treatment: donor chimerism (h), cellularity (i), hematopoietic stem cell population percentage (CD34+CD38- %; j), and myeloid population percentage (CD33+; k). l-q, Analysis of cord blood recipient’s spleens at 10 weeks post-start of treatment: spleen weight (l), cellularity (m), donor chimerism (n), B cell population (CD19+ %; o), T cell population (CD3+ %; p), and myeloid cell population (CD33+ %; q). a-q, Data are presented as mean±SEM. e-q, Statistics based on unpaired two-sided t-test comparing imetelstat with PBS-treated groups within each donor: P = 2.02 × 10⁻² (donor 1; e), P = 8.3 × 10⁻³ (donor 1; h), P < 1 × 10⁻³ (donor 2; h), P = 2.3 × 10⁻³ (donor 1; i), P = 5 × 10⁻⁴ (donor 2; i), P = 9 × 10⁻² (donor 1; j), P = 2.02 × 10⁻² (donor 2; k), P = 1.76 × 10⁻² (donor 1; l), P = 8.1 × 10⁻³ (donor 2; l), P = 1.56 × 10⁻² (donor 2; m), P = 3.7 × 10⁻³ (donor 1; n), P < 1 × 10⁻⁴ (donor 2; n), P = 1.31 × 10⁻² (donor 1; o), P = 8 × 10⁻² (donor 2; o), P = 4.16 × 10⁻² (donor 1; q), P = 6.67 × 10⁻² (donor 2; q). Source data
Extended Data Fig. 3
Extended Data Fig. 3. Comparative analysis of AML PDX responses to imetelstat versus standard induction chemotherapy.
a, Median survival was 104 (vehicle control (Saline / PBS) – treated PDX; black; n = 120 PDX) versus 139 (chemotherapy-treated PDX; Arac+Doxo; blue; P = 1.7 × 10⁻³; n = 120 PDX) and 139 (imetelstat-treated PDX; Saline / Imetelstat; red; P = 3.3 × 10⁻³; n = 120 PDX) according to Gehan–Breslow-Wilcoxon (two-sided Kaplan–Meier analysis). b, AML burden quantified as peripheral blood donor chimerism per day. Statistics based on ordinary One-way-ANOVA adjusted for multiple comparisons. N = 120 PDX per treatment group. P = 1.57 × 10⁻² (vehicle versus imetelstat). c, Imetelstat versus chemotherapy response calculation as log2FC of peripheral blood chimerism area under the curve per day in AML PDX. The red arrow indicates samples defined as preferential imetelstat responders, and conversely, the blue arrow indicates PDX defined as preferential chemotherapy responders. d, Cytoscape visualization of genes with mutations identified exclusively in preferential imetelstat responders (red) or chemotherapy responders (blue) at baseline. Source data
Extended Data Fig. 4
Extended Data Fig. 4. Identification of key mediators of imetelstat efficacy using a genome-wide CRISPR/Cas9 screen.
a, Identification of an imetelstat inoculum effect by quantification of IC50 values in NB4 cultures seeded at different densities: IC50 = 0.2 microM (25,000 cells per ml); IC50 = 1.5 microM (75,000 cells per ml); IC50 = 7.2 microM (250,000 cells / ml); IC50 = 31.3 microM (1,000,000 cells / ml). Dots represent mean IC50 values ± SEM from n = 2 independent experiments. b,c, Viability (b) and cell growth analysis (c) of Brunello-library-transduced NB4 cells cultured in the presence of vehicle control (PBS), mismatch control (MM1), or imetelstat compared to non-transduced NB4 cells over a time course of 45 days. The respective concentrations are indicated in the panel. N = 3 independent biological replicates per genotype and treatment condition. d,e, Next generation sequencing of DNA isolated from Brunello library-transduced NB4 cells harvested at day 45 in culture treated with vehicle control (PBS; black bars), mismatch control (MM1; blue bars), or imetelstat (red bars), and compared to DNA isolated from Brunello library-transduced NB4 cells before treatment as input control (gray bars): d, The number of different guide RNAs present (left y-axis) and percentage of guide RNA coverage (right y-axis); e, the read counts obtained from each guide RNA. f,g, Read counts obtained from n = 4 independent FADS2 (f) or n = 4 independent ACSL4 (g) targeting guide RNAs in the input, vehicle (PBS), mismatch (MM1) or imetelstat-treated Brunello-transduced NB4 cultures. Data are presented as mean ± SEM. h-j, Confirmation of efficient CRISPR/Cas9 - generated knockdowns in human AML cell lines by ACSL4 western blotting (h; additional biological replicates are provided as supplement), flow cytometric analysis of intracellular VIM expression (i), and FADS2 gene editing by tracking of indels by decomposition analysis using TIDE analysis tool (http://shinyapps.datacurators.nl/tide/) (j). Source data
Extended Data Fig. 5
Extended Data Fig. 5. Lipidomics analysis of imetelstat-treated FADS2-edited or non-edited NB4 cells.
Targeted lipidomics analysis on 593 lipid species and their desaturation levels. a, PCA plot on normalized peak areas of lipid species in FADS2-edited (FADS2-sg1, FADS2-sg2) or non-edited (empty-vector control) NB4 cultures supplemented for 24h with either 4 microM imetelstat or vehicle control. b,c, Differential enrichment analysis using lipidR tool of unsaturated bonds in all measured lipid species (b), and lipid species according to lipid classes (c). Red box plots denote significantly different comparisons with P < 5 × 10⁻³. N = 3 independent replicates per condition from distinct cell passages. Lipid classes: Acylcarnitines (AcylCarnitine), Cholesteryl ester (CE), Ceramide (Cer), Desmosterol (DE), Diacylglycerol (DG), Dihydroceramide (dhCer), GM1 ganglioside (GM1), GM3 ganglioside (GM3), Dihexosylceramide (Hex2Cer), Trihexosylcermide (Hex3Cer), Monohexosylceramide (HexCer), Lysophosphatidylcholine (LPC), Lysoalkylphosphatidylcholine (LPCO), Lysoalkenylphosphatidylcholine (LPCP), Lysophosphatidylethanolamine (LPE), Lysoalkenylphosphatidylethanolamine (LPEP), Lysophosphatidylinositol (LPI), Phosphatidylcholine (PC), Phosphatidylethanolamine (PE), Phosphatidylglycerol (PG), Phosphatidylinositol (PI), Phosphatidylserine (PS), Sphingomyelin (SM), Sphingosine (Sph), Sulfatide (Sulfatide), Triacylglycerol (TG), Alkyldiacylglycerol (TGO). NA: Molecules which could not be parsed by lipidr (for example ubiquinone, free cholesterol). Source data
Extended Data Fig. 6
Extended Data Fig. 6. The effect of chemical perturbation of ferroptosis on imetelstat efficacy.
Celltiter-based cell growth analysis in a panel of n = 7 imetelstat-sensitive cell lines NB4, MV411, KO52, TF1, MOLM13, HEL or PL21 that were supplemented with different concentrations of imetelstat combined with various pharmacological modulators of ferroptosis (that is ferrostatin-1, liproxstatin-1, DFOM, zileuton, menadione, etomoxir, RSL3, erastin). Synergism was estimated using the Synergyfinder 2.0 algorithm (http://synergyfinder.fimm.fi) on the viability data pooled from n = 2 independent experiments. BLISS and LOEWE synergy scores are plotted for each drug combination and cell line. Ferroptosis modulators highlighted in blue represent predicted antagonistic combinations with imetelstat with LOEWE AND BLISS scores < 10. Source data
Extended Data Fig. 7
Extended Data Fig. 7. The effect of imetelstat’s triple G-containing mismatch control on AML.
a, Oligonucleotide sequences of imetelstat, mismatch 1 (MM1), and mismatch 2 (GGG; MM2). Celltiter analysis of 14 human hematopoietic cell lines treated with different concentrations (0.25 microM, 1 microM, 4 microM) of MM1, MM2, or imetelstat over a 4-week period. Data pooled from three technical replicates per condition from n = 2 independent experiments. Log2 fold changes of cell growth (celltiter-assay) of drug-treated conditions compared to vehicle controls are presented as heatmap. b, Median fluorescent intensities of anti-DNA G-quadruplex antibody (1H6) in editing-control (n = 5 biological replicates, that is native, Cas9, empty vector, CD33-sg1, CD33-sg2) NB4 cell lines treated with PBS, MM1, MM2, or imetelstat, and gated on G1 (left), or S/G2/M cell cycle phases (right). Each dot represents the mean of three technical replicates from one representative out of three independent experiments. c, CellROX measurement of n = 5 editing controls or n = 2 FADS2-edited (FADS2-sg1, FADS2-sg2) NB4 treated with PBS, MM1, MM2, or imetelstat. Each dot represents the mean of three technical replicates per cell line from one representative out of four independent experiments. b,c, One-way-ANOVA analysis adjusted for multiple comparisons: P < 1 × 10⁻⁴ (PBS versus MM2 in G1 and S/G2/M; b), P < 1 × 10⁻⁴ (PBS versus imetelstat in G1 and S/G2/M; b), P < 1 × 10⁻⁴ (editing controls+ PBS versus MM1; c), P < 1 × 10⁻⁴ (editing controls + PBS versus MM2; c), P < 1 × 10⁻⁴ (editing controls + PBS versus imetelstat; c), P = 2 × 10⁻⁴ (MM2-treated editing controls versus FADS2-edited cells; c), P < 1 × 10⁻⁴ (imetelstat-treated editing controls versus FADS2-edited cells; c). d, Celltiter analysis on NB4 treated with PBS, MM1, MM2 or imetelstat, and in combination with ferrostatin-1 (left) or DFOM (right). N = 3 technical replicates per condition from one representative out of two independent experiments in total. One-way-ANOVA adjusted for multiple comparisons: P < 1 × 10⁻⁴ (PBS versus MM2), P < 1 × 10⁻⁴ (PBS versus imetelstat). e, Peripheral blood AML burden in AML PDX (RCH-11) treated with PBS (n = 6), MM1, (n = 5), MM2 (n = 5), or imetelstat (n = 6). One-way-ANOVA adjusted for multiple comparisons on day 17: P = 1.83 × 10⁻² (PBS versus MM2), P = 1.2 × 10⁻³ (PBS versus imetelstat). Source data
Extended Data Fig. 8
Extended Data Fig. 8. Individual AML PDX responses to imetelstat.
Peripheral blood AML donor chimerism in the thirty individual PDX models. N = 6 NSGS per treatment group per individual AML patient sample. Kinetics are presented from each individual replicate. Source data
Extended Data Fig. 9
Extended Data Fig. 9. The molecular landscapes underlying imetelstat responses in AML PDX.
a, Unsupervised hierarchical clustering analysis on the expression of differentially expressed transcripts in sustained versus poor responders to imetelstat determined using glmFit function (R) with a cutoff of adjusted P value < 0.25 among 30 individual AMLs from our PDX repository. b, Key clinical characteristics of patients from whom AML samples were derived including age at diagnosis, gender, ELN2017 prognostic risk group, and WHO class of disease. c, OncoPrint of differentially detected mutations in AMLs from sutained versus poor responders to imetelstat at baseline by targeted next generation sequencing of 585 genes associated with hematologic malignancies (the MSKCC HemePACT assay). d, Imetelstat response classification: AML burden quantified as area under the curve of peripheral blood donor chimerism per day of imetelstat / vehicle (PBS)-treated AML PDX generated from each individual AML patient sample. N = 30 AML patient samples with n = 6 PDX per treatment group. Source data
Extended Data Fig. 10
Extended Data Fig. 10. Imetelstat response classification in AML PDX.
a, Imetelstat response classification: AML burden quantified as peripheral blood donor chimerism per day and spleen weights from imetelstat vs. vehicle control-treated PDX by imetelstat response group. N = 84 (sustained responders per treatment group each); n = 48 (intermediate or poor responders per treatment group each). Solid lines represent the median from each group ± 95% confidence interval. Statistics based on unpaired two-sided t-test on log-transformed data: P = 1.32 × 10⁻¹¹ (PB AML burden in sustained responders: PBS vs. imetelstat), P = 6.68 × 10⁻³ (PB AML burden in intermediate responders: PBS vs. imetelstat), P = 8.82 × 10⁻⁵ (spleen weight in sustained responders: PBS vs. imetelstat), P = 1.34 × 10⁻² (spleen weight in interdediate responders: PBS vs. imetelstat), P = 2.8 × 10⁻² (spleen weight in poor responders: PBS vs. imetelstat). b-h, Representation of clinical and molecular parameters in AML patient samples either characterized as sustained, intermediate, or poor responders to imetelstat: ELN2017 risk (b), cytogenetics (c), WHO disease classification (d), gender (e), AML patient age at sampling (f), FLT3-ITD allelic ratio (g), and TERT mRNA expression levels at baseline from RNA-seq analysis (h). Results were not statistically different (that is according to two-tailed Fisher’s exact test for b-e; one-way-ANOVA for f-h). N = 14 sustained, n = 8 intermediate, n = 8 poor responders to imetelstat. i, AML burden in imetelstat-treated normalized to vehicle control-treated PDX in relation to NRAS mutational status: NRAS wild-type (wt; n = 144), mutant NRAS (mut; n = 36). Simple linear regression indicates the slope being significantly different from 0 with p = 8.8 × 10⁻³. j, Telomeric restriction fragment analysis of genomic DNA isolated from viable AML patient cells at baseline from all 30 individual AML patient samples included in the preclinical trial of imetelstat in AML PDX. Source data

References

    1. Dohner H, et al. Diagnosis and management of AML in adults: 2017 ELN recommendations from an international expert panel. Blood. 2017;129:424–447. doi: 10.1182/blood-2016-08-733196. - DOI - PMC - PubMed
    1. Papaemmanuil E, et al. Genomic classification and prognosis in acute myeloid leukemia. N. Engl. J. Med. 2016;374:2209–2221. doi: 10.1056/NEJMoa1516192. - DOI - PMC - PubMed
    1. Cucchi DGJ, et al. Two decades of targeted therapies in acute myeloid leukemia. Leukemia. 2021;35:651–660. doi: 10.1038/s41375-021-01164-x. - DOI - PubMed
    1. Bruedigam C, et al. Telomerase inhibition effectively targets mouse and human AML stem cells and delays relapse following chemotherapy. Cell Stem Cell. 2014;15:775–790. doi: 10.1016/j.stem.2014.11.010. - DOI - PMC - PubMed
    1. Herbert BS, et al. Lipid modification of GRN163, an N3′->P5′ thio-phosphoramidate oligonucleotide, enhances the potency of telomerase inhibition. Oncogene. 2005;24:5262–5268. doi: 10.1038/sj.onc.1208760. - DOI - PubMed

Publication types