. 2024 Jan;38(1):67-81.
doi: 10.1038/s41375-023-02076-8. Epub 2023 Oct 30.

ATP1A1/BCL2L1 predicts the response of myelomonocytic and monocytic acute myeloid leukemia to cardiac glycosides

Affiliations

ATP1A1/BCL2L1 predicts the response of myelomonocytic and monocytic acute myeloid leukemia to cardiac glycosides

Claudia Cerella et al. Leukemia. 2024 Jan.

Abstract

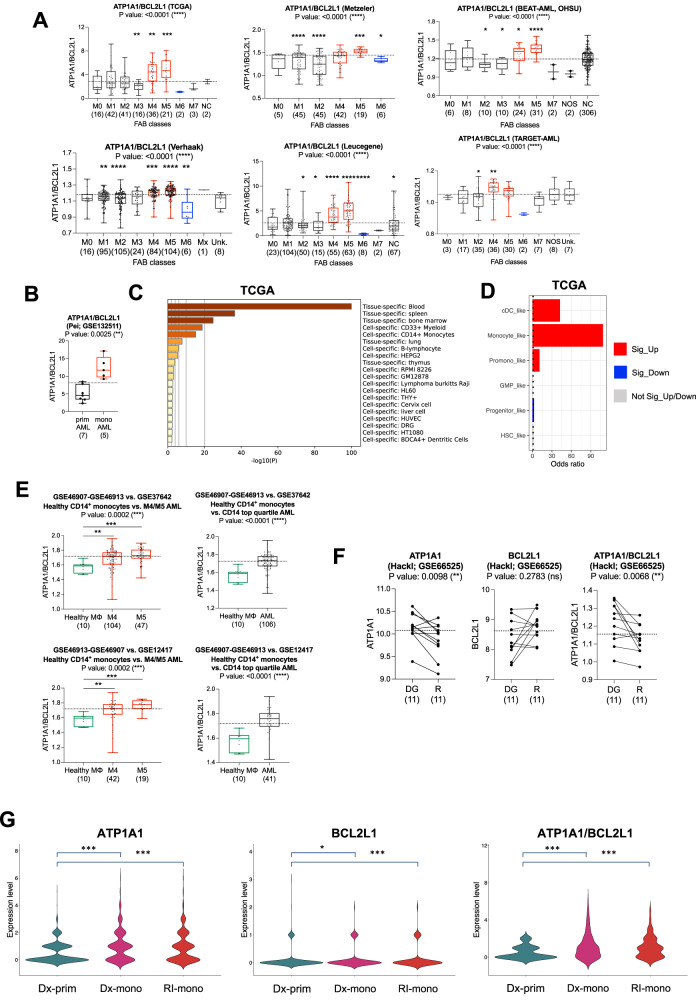
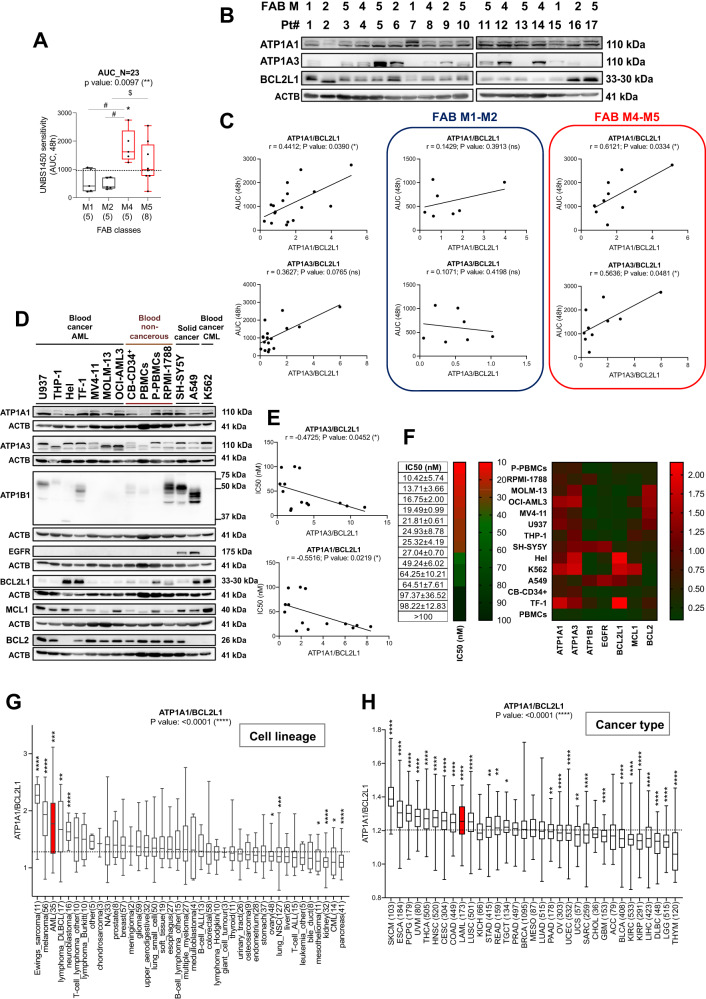
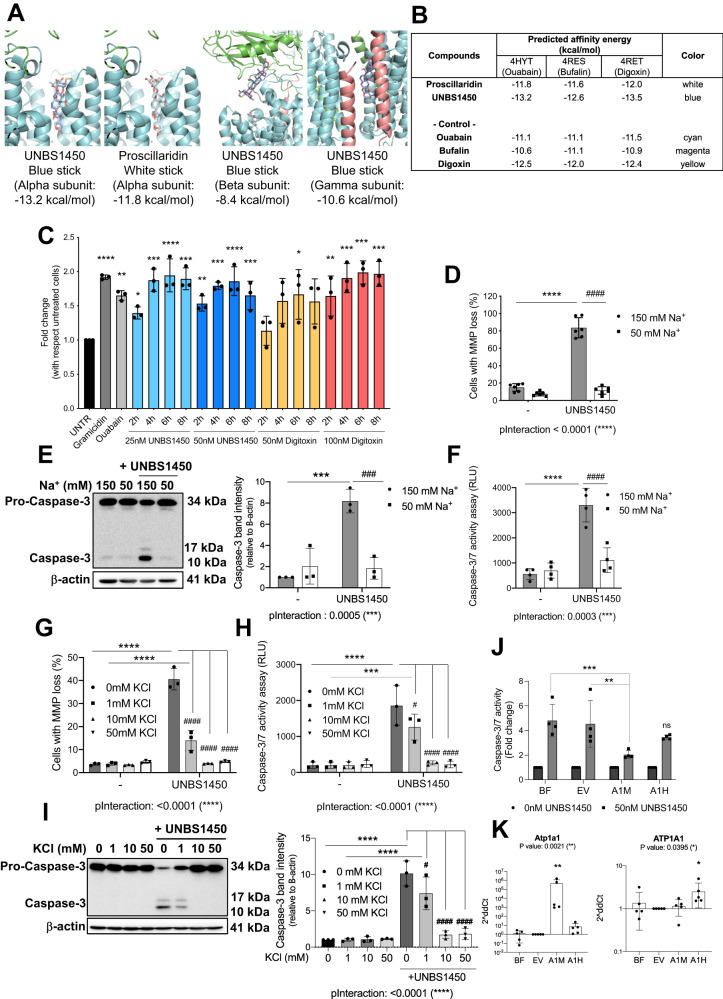
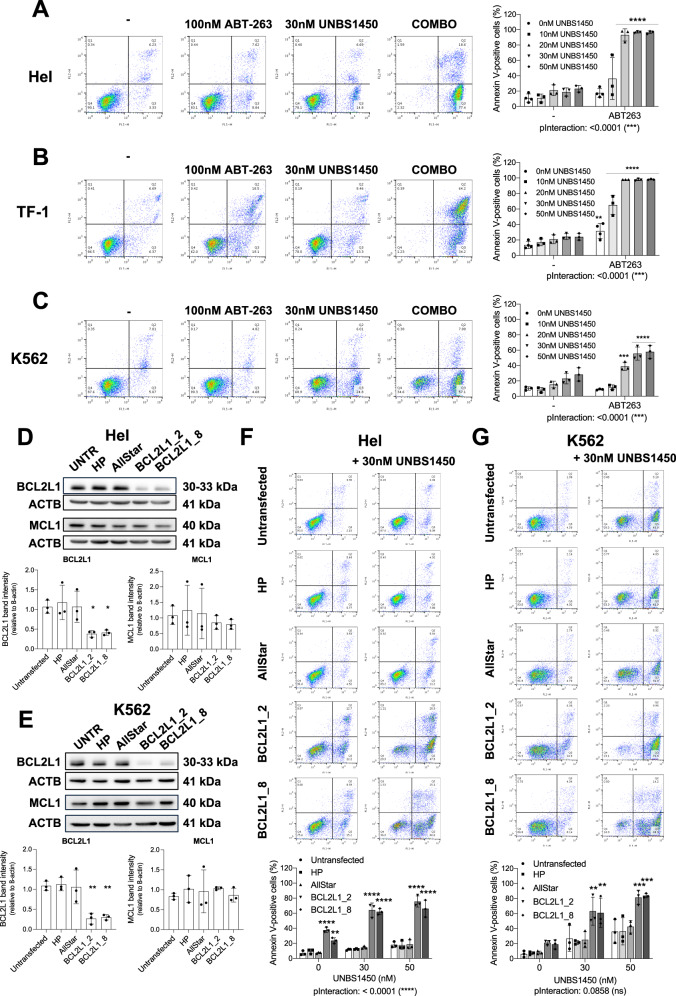
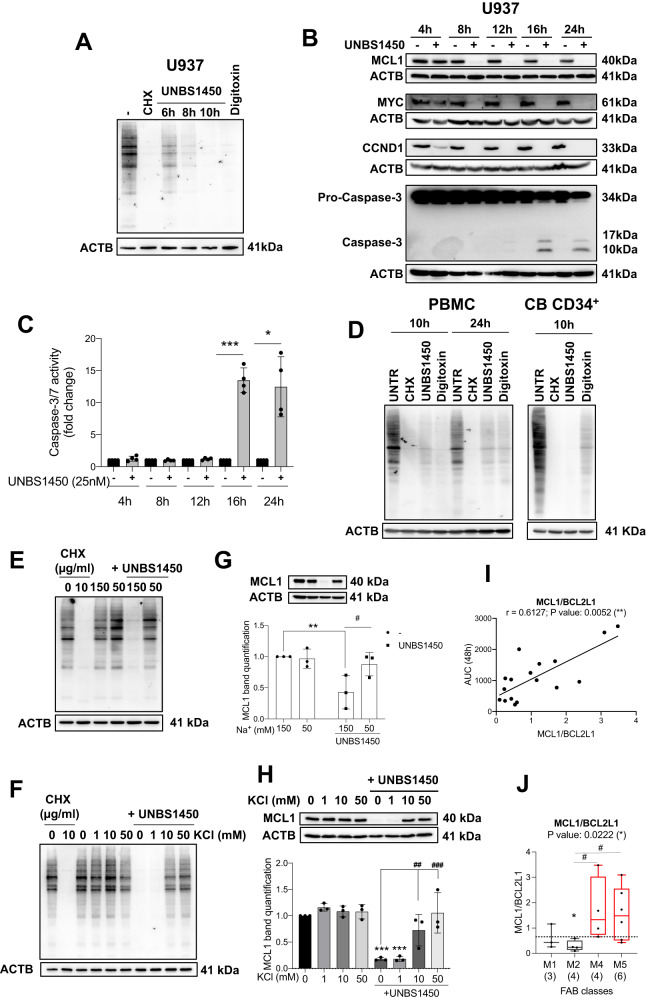
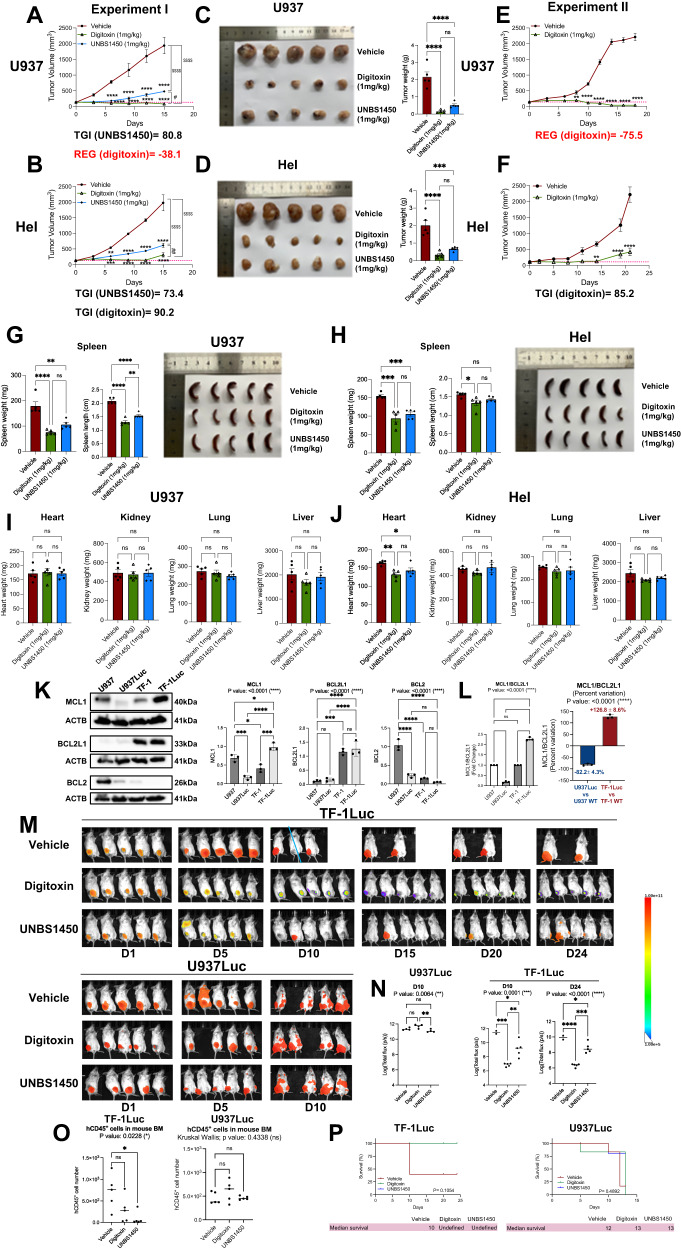
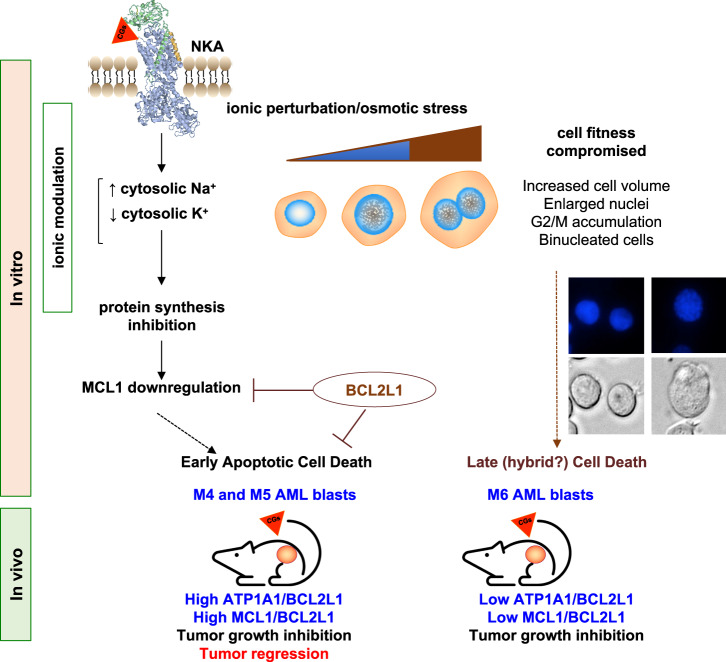
Myelomonocytic and monocytic acute myeloid leukemia (AML) subtypes are intrinsically resistant to venetoclax-based regimens. Identifying targetable vulnerabilities would limit resistance and relapse. We previously documented the synergism of venetoclax and cardiac glycoside (CG) combination in AML. Despite preclinical evidence, the repurposing of cardiac glycosides (CGs) in cancer therapy remained unsuccessful due to a lack of predictive biomarkers. We report that the ex vivo response of AML patient blasts and the in vitro sensitivity of established cell lines to the hemi-synthetic CG UNBS1450 correlates with the ATPase Na+/K+ transporting subunit alpha 1 (ATP1A1)/BCL2 like 1 (BCL2L1) expression ratio. Publicly available AML datasets identify myelomonocytic/monocytic differentiation as the most robust prognostic feature, along with core-binding factor subunit beta (CBFB), lysine methyltransferase 2A (KMT2A) rearrangements, and missense Fms-related receptor tyrosine kinase 3 (FLT3) mutations. Mechanistically, BCL2L1 protects from cell death commitment induced by the CG-mediated stepwise triggering of ionic perturbation, protein synthesis inhibition, and MCL1 downregulation. In vivo, CGs showed an overall tolerable profile while impacting tumor growth with an effect ranging from tumor growth inhibition to regression. These findings suggest a predictive marker for CG repurposing in specific AML subtypes.


Conflict of interest statement

The authors declare no competing interests.

Figures

Fig. 1
Fig. 1. Myelomonocytic and monocytic AML express higher ATP1A1/BCL2L1 levels.
ATP1A1/BCL2L1 in AML with different maturation states, determined by A FAB classification; B immunophenotyping. C Enriched tissue/cell-specific gene patterns in the upregulated gene list of ATP1A1/BCL2L1high TCGA (≥median). D Odds plot of the cell type enrichment in ATP1A1/BCL2L1high TCGA patients. Genes in: red: significantly upregulated; blue: significantly downregulated; gray: not significant (up or downregulated). E ATP1A1/BCL2L1 levels in CD14+ monocytes from healthy individuals (N = 10) vs. M4/M5 (N = 151 and N = 61) or CD14 top quartile AML patient blasts (N = 106 and N = 41). F 11 diagnostic/relapse paired AML specimens after conventional chemotherapy [50]. G phenotypically primitive vs. monocytic de novo AML at the diagnosis vs. the relapsed clones in AML patient 12 (Pei et al. [1]). Kruskal–Wallis test to compare medians; Mann–Whitney test for comparisons between the median of each subgroup and the overall median (dashed line), or between two groups; P values: *<0.05, **<0.01, ***<0.001, ****<0.0001.
Fig. 2
Fig. 2. UNBS1450 sensitivity correlates with ATP1A1/BCL2L1 expression.
A Ex vivo response of 23 de novo AML patient blasts to UNBS1450 according to their FAB subtype (AUC, area under the curve), and B western blot analysis of the indicated proteins [17]. The same membrane was probed for ATP1A1, ATP1A3, and BCL2L1. C Correlation analysis between UNBS1450 AUC values and ATP1A1/BCL2L1 and ATP1A3/BCL2L1 ratios estimated for the overall AML blast cohort (N = 17; non-parametric one-sided Spearman) or FAB M1-M2 (N = 6) vs. FAB M4-M5 subgroups (N = 11). D Western blot analysis of a panel of proteins on 14 cell models [45, 51]. Data are representative of three independent blots. E Correlation analysis between UNBS1450 IC50 mean values and ATP1A1/BCL2L1 and ATP1A3/BCL2L1 ratios in the selected cell models (non-parametric one-sided Spearman). F UNBS1450 IC50 values of the 14 cell models (mean of at least three independent experiments ±SD); heatmap visualization of the protein expression level (right). ATP1A1/BCL2L1 levels across (G) 40 cancer cell lineages (CCLE; log2(RPKM) and (H) 33 primary cancer types (TCGA pan-cancer; log2(FPKM)–uq+1). Kruskal–Wallis test; comparisons between the median of each subgroup and the overall median (dashed line): Mann–Whitney test (P values: *<0.05, **<0.01, ***<0.001, ****<0.0001.
Fig. 3
Fig. 3. The cytotoxic potential of UNBS1450 is mediated by an ionic perturbation and is the consequence of an ON-target effect.
A Docking orientation of UNBS1450 and proscillaridin on the crystal structure of the ATP1A1 (alpha) subunit and UNBS1450 in the crystal structure of ATP1B1 and ATP1C1 (beta and gamma) subunits of the NKA (PDB ID: 4HYT, 4RES, 4RET). B The predicted affinity energy (kcal/mol) of each CG. C Kinetic analysis of the intracellular Na+ levels in U937 cells treated with UNBS1450 (25 and 50 nM) or digitoxin (50 and 100 nM). Positive controls: Na+ ionophore gramicidin (10 µM) and ouabain (500 nM). Mean of N = 3 ± SD. One-way ANOVA, post-hoc: Dunnett; P values: *<0.05, **<0.01, ***<0.001, ****<0.0001; comparisons of each condition to the untreated sample. The cytotoxic potential of UNBS1450 (18 h) in U937 cells cultivated one h before treatment in salt-balanced modified media containing 150 or 50 mM Na+ on: D MMP loss (N = 6); E the caspase-3 (CASP-3) cleavage and quantification of the cleaved band intensity (right; N = 3); F the caspase-3/7 activity assay (N = 4). Significant statistical differences between untreated vs. UNBS1450-treated cells in the same type of medium (*) and UNBS1450-treated U937 cells in 150 mM vs. 50 mM medium (#): two-way ANOVA; post-hoc: Sidak; P values: */# < 0.05, **/## < 0.01, ***/### < 0.001, ****/#### < 0.0001). Same analyses on cell death modulation in U937 cells supplemented with 1, 10, or 50 mM KCl 30 min before adding UNBS1450: G MMP loss (N = 3); H caspase-3/7 activity (N = 3), and I CASP-3 cleavage with relative quantification of the cleaved band intensity (right; N = 3). Two-way ANOVA; post-hoc: Dunnett; P values: */# < 0.05, **/## < 0.01, ***/### < 0.001, ****/#### < 0.0001). K The Hel cell line was transfected with a plasmid bearing the cDNA of the murine Atp1a1 or the human ATP1A1. J The caspase-3/7 activity (24 h treatment) with 50 mM UNBS1450 (N = 4; Two-way ANOVA, post-hoc: Sidak); K Atp1a1 and ATP1A1 mRNA levels monitored by RT-PCR at 48 h post-transfection, corresponding to the t = 0 h of UNBS1450 treatment (N = 5; Kruskal–Wallis; post-hoc: Dunn).
Fig. 4
Fig. 4. BCL2L1 is a factor of resistance to the CG UNBS1450.
Analysis of apoptosis in BCL2L1-overexpressing FAB M6 A Hel and B TF-1, and C. CML K562 cells by Annexin-V/PI viability assay. Cells were treated with 30 nM UNBS1450 (18 h) alone or with 100 nM ABT-263. Genetic BCL2L1 silencing using 10 nM of two different siRNAs (BCL2L1_2 and BCL2L1_8). In parallel, cells were untransfected; transfected with the transfection buffer only (HP); or 10 nM of a control siRNA (AllStar). D, E Western blot analyses confirmed BCL2L1 downregulation without MCL1 level modulation in Hel and K562 cells. F, G Apoptosis induction by UNBS1450 in transfected cells (18 h, 30 nM). N = 3. Two-way ANOVA; post-hoc: Sidak; statistical significance: **<0.01, ***<0.001, ****<0.0001.
Fig. 5
Fig. 5. UNBS1450 inhibits the expression of short-lived proteins downstream to the ionic perturbation and via inhibition of protein synthesis.
A Protein synthesis assay monitored (N = 3) and B Kinetic western blot analysis of MCL1, MYC, and CCND1 in U937 cells (25 nM UNBS1450), paralleled by the analysis of caspase-3 (CASP-3) cleavage (N = 3) and C caspase-3/7 activity assay (N = 4; Two-way ANOVA; post-hoc: Sidak; P values: *<0.05, ***<0.001). Protein synthesis assay in D PBMCs, proliferating CB-CD34+ (N = 4), and in U937 cells upon E KCl supplementation or F cultivation in salt-balanced modified media containing 150 or 50 mM Na+ (N = 3). G and H Western blot analysis of MCL1 expression levels with relative band quantification in the same condition of panels E and F (N = 3). Statistical significance between UNBS1450-untread and treated cells (*) or between UNBS1450-treated samples without or with KCl supplementation (#): Two-way ANOVA; post-hoc: Sidak; P values: */#<0.05, **/##<0.01, ***/###<0.001). I Correlation between UNBS1450 AUC values and MCL1/BCL2L1. MCL1 expression values were retrieved from the previous study on the same specimens [17]. J MCL1/BCL2L1 ratio according to FAB subtype in AML patient blasts (N = 17). Kruskal–Wallis test for median comparison; Mann–Whitney test for comparisons between the median of each subgroup and the overall median (dashed line; *) or between specific subgroups (#); P values: */#<0.05).
Fig. 6
Fig. 6. The translational potential of CGs.
Tumor volume (mm3) changes in subcutaneously injected A M5 U937 and B M6 Hel xenografts treated with UNBS1450 or digitoxin (1.0 mg/Kg) or vehicle (N = 5 mice/group). C, D Tumor weights assessed in the same mice groups 24 h after the last treatment. E, F The same analysis as in A and B in experiment II (U937: N = 5 mice/group; Hel: N = 4 mice/group). Mouse spleen weight and length of each treatment group (experiment I) in G M5 U937 and H M6 Hel. Weight of the indicated organs for each treatment group (experiment I): J M5 U937 and K M6 Hel. Mean ± SEM. Dashed line: average of all the tumor volumes at T0. TGI tumor growth inhibition, REG tumor regression. K Western blot analysis and quantification of MCL1, BCL2L1, and BCL2 proteins in U937Luc and TF-1Luc cell lines compared to the parental WT cells used in this study (N = 3). L Fold change (left) and percent of the fold change variation (right) of MCL1/BCL2L1 protein ratio in luciferase reporter vs. parental cell lines. M Bioluminescence imaging and N quantification at the indicated times of TF-1Luc and U937Luc xenografts treated with UNBS1450 or digitoxin (0.5 mg/Kg) or vehicle (N = 5 mice/group). O Flow cytometric quantification of human CD45+ cells in the bone marrow from the right femur and tibia, harvested at the end of the experiment on the same mice (number of positive cells/ 10,000 events recorded). P Kaplan–Meier survival curves of vehicle vs. CG-treated TF-1Luc or U937Luc xenografted-mice (log-rank (Mantel–Cox) test). Statistical analysis: A, B, E, F One-Way ANOVA; post-hoc: Tukey (trend); Dunnett (comparison at the endpoint between groups). C, D, GL, left panel-N: One-way ANOVA; post-hoc: Tukey; Sydak (K-left panel-N). O Kruskal–Wallis (post-hoc Dunn’s). L (right panel): unpaired T-test (two-tailed). P values: */#<0.05, **/##<0.01, ***/<0.001, ****/$$$$<0.0001.
Fig. 7
Fig. 7. A mechanistic model for the action of UNBS1450.
The 3D NKA image is from FirstGlance, Jmol; https://www.bioinformatics.org/firstglance/fgij/fg.htm?mol=3kdp.

Similar articles

Cited by

References

    1. Pei S, Pollyea DA, Gustafson A, Stevens BM, Minhajuddin M, Fu R, et al. Monocytic subclones confer resistance to venetoclax-based therapy in patients with acute myeloid leukemia. Cancer Discov. 2020;10:536–51. - PMC - PubMed
    1. Zhang H, Nakauchi Y, Kohnke T, Stafford M, Bottomly D, Thomas R, et al. Integrated analysis of patient samples identifies biomarkers for venetoclax efficacy and combination strategies in acute myeloid leukemia. Nat Cancer. 2020;1:826–39. - PMC - PubMed
    1. Kuusanmaki H, Leppa AM, Polonen P, Kontro M, Dufva O, Deb D, et al. Phenotype-based drug screening reveals association between venetoclax response and differentiation stage in acute myeloid leukemia. Haematologica. 2020;105:708–20. - PMC - PubMed
    1. White BS, Khan SA, Mason MJ, Ammad-Ud-Din M, Potdar S, Malani D, et al. Bayesian multi-source regression and monocyte-associated gene expression predict BCL-2 inhibitor resistance in acute myeloid leukemia. NPJ Precis Oncol. 2021;5:71. - PMC - PubMed
    1. Kurtz SE, Eide CA, Kaempf A, Long N, Bottomly D, Nikolova O, et al. Associating drug sensitivity with differentiation status identifies effective combinations for acute myeloid leukemia. Blood Adv. 2022;6:3062–7. - PMC - PubMed

Publication types

MeSH terms