. 2023 Oct 31;21(1):412.
doi: 10.1186/s12916-023-03117-w.

Hypoxia enhances anti-fibrotic properties of extracellular vesicles derived from hiPSCs via the miR302b-3p/TGFβ/SMAD2 axis

Affiliations

Hypoxia enhances anti-fibrotic properties of extracellular vesicles derived from hiPSCs via the miR302b-3p/TGFβ/SMAD2 axis

Milena Paw et al. BMC Med. .

Abstract

Background: Cardiac fibrosis is one of the top killers among fibrotic diseases and continues to be a global unaddressed health problem. The lack of effective treatment combined with the considerable socioeconomic burden highlights the urgent need for innovative therapeutic options. Here, we evaluated the anti-fibrotic properties of extracellular vesicles (EVs) derived from human induced pluripotent stem cells (hiPSCs) that were cultured under various oxygen concentrations.

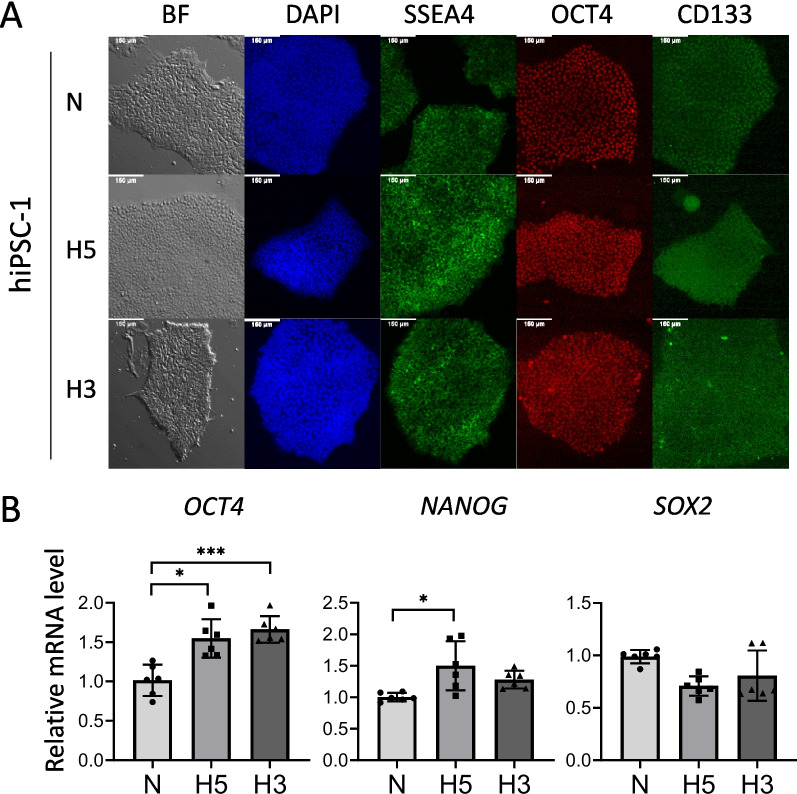
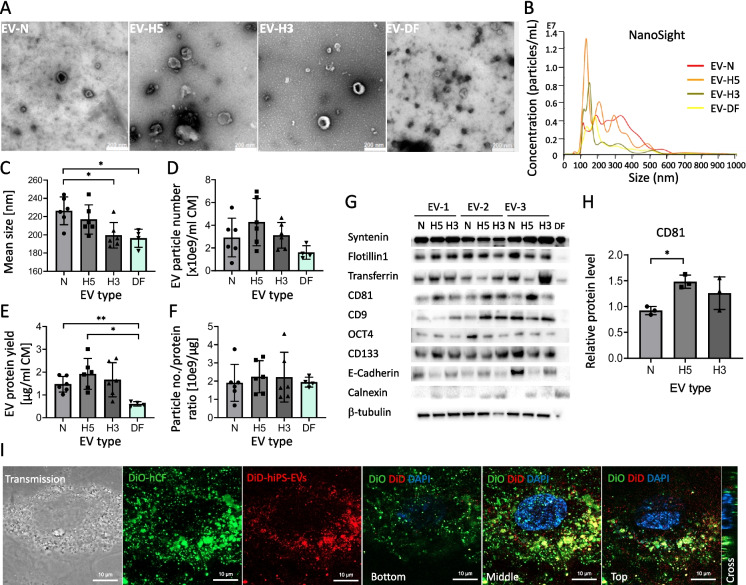
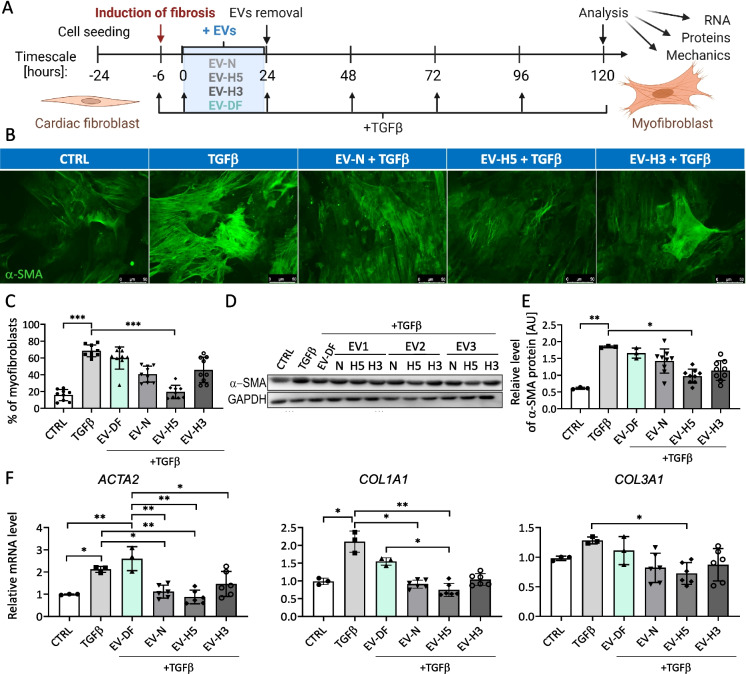
Methods: EVs were isolated from three hiPSC lines cultured under normoxia (21% O2; EV-N) or reduced oxygen concentration (hypoxia): 3% O2 (EV-H3) or 5% O2 (EV-H5). The anti-fibrotic activity of EVs was tested in an in vitro model of cardiac fibrosis, followed by a detailed investigation of the underlying molecular mechanisms. Sequencing of EV miRNAs combined with bioinformatics analysis was conducted and a selected miRNA was validated using a miRNA mimic and inhibitor. Finally, EVs were tested in a mouse model of angiotensin II-induced cardiac fibrosis.

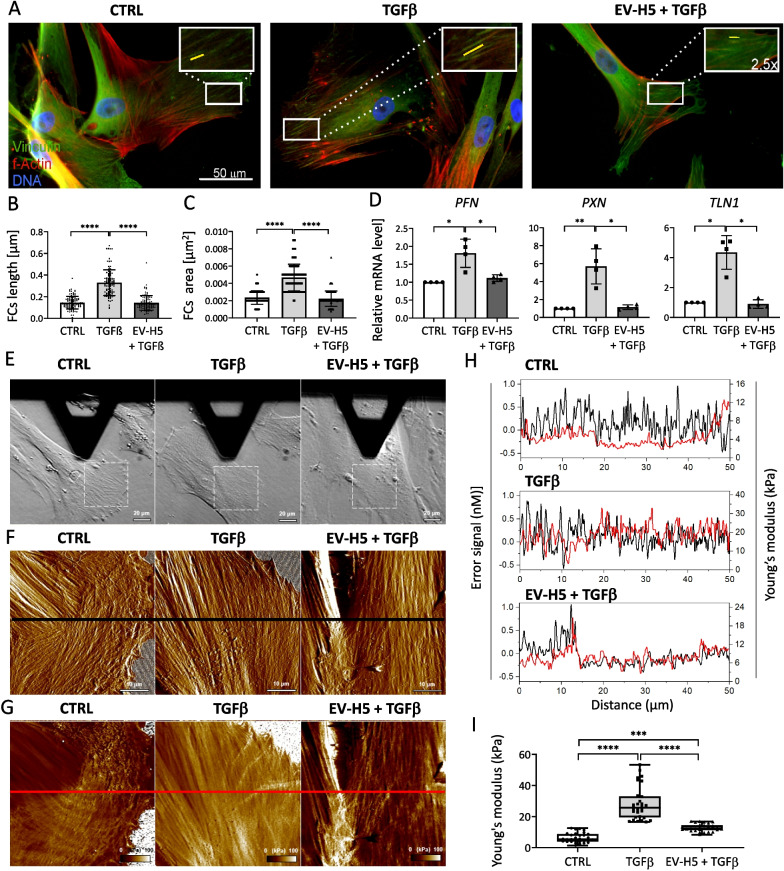
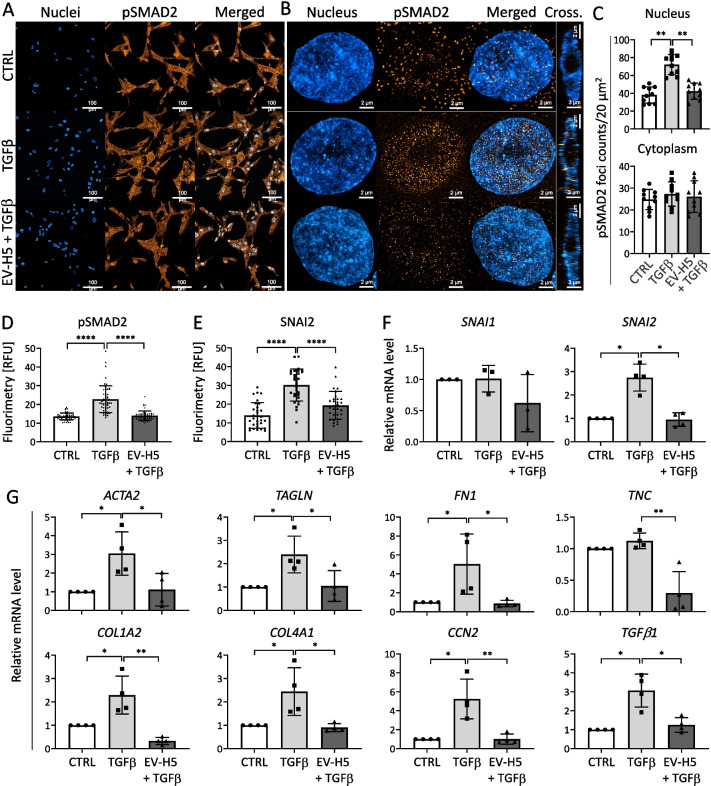
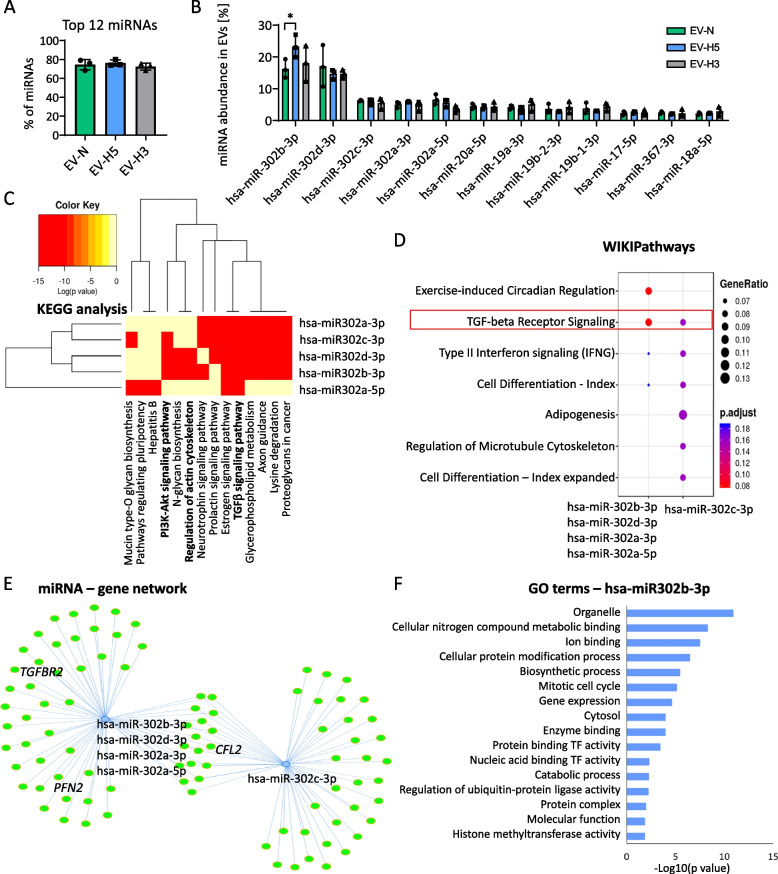
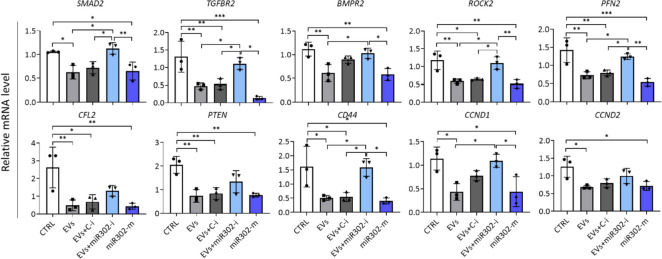
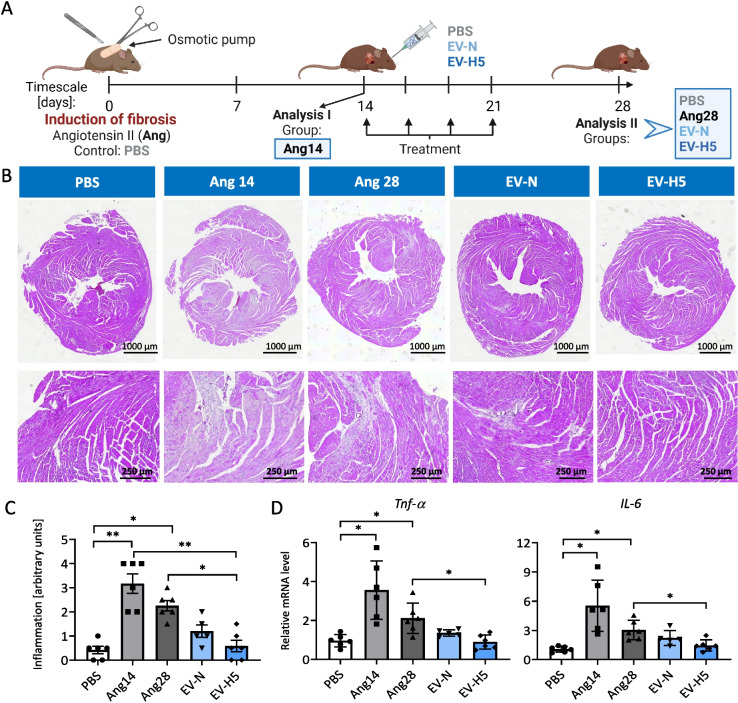
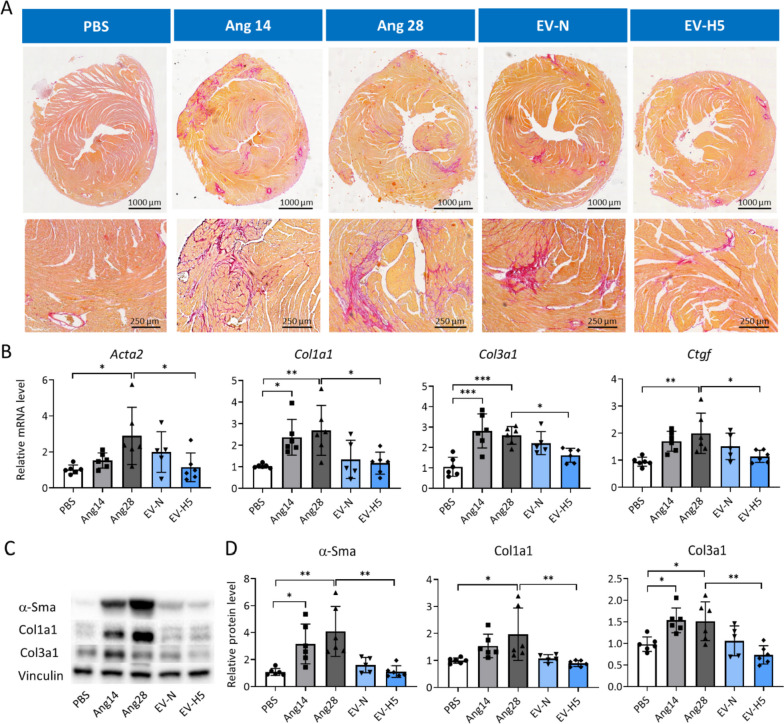
Results: We provide evidence that an oxygen concentration of 5% enhances the anti-fibrotic effects of hiPS-EVs. These EVs were more effective in reducing pro-fibrotic markers in activated human cardiac fibroblasts, when compared to EV-N or EV-H3. We show that EV-H5 act through the canonical TGFβ/SMAD pathway, primarily via miR-302b-3p, which is the most abundant miRNA in EV-H5. Our results show that EV-H5 not only target transcripts of several profibrotic genes, including SMAD2 and TGFBR2, but also reduce the stiffness of activated fibroblasts. In a mouse model of heart fibrosis, EV-H5 outperformed EV-N in suppressing the inflammatory response in the host and by attenuating collagen deposition and reducing pro-fibrotic markers in cardiac tissue.

Conclusions: In this work, we provide evidence of superior anti-fibrotic properties of EV-H5 over EV-N or EV-H3. Our study uncovers that fine regulation of oxygen concentration in the cellular environment may enhance the anti-fibrotic effects of hiPS-EVs, which has great potential to be applied for heart regeneration.

Keywords: Extracellular vesicles; Heart fibrosis; Hypoxia; Induced pluripotent stem cells; Low oxygen; Therapy.


Conflict of interest statement

Jagiellonian University has filed a patent application for the use of hiPS-EVs derived from oxygen conditions of 5% on behalf of the inventors: S.B.-W., M.Paw (M.P.1), A.A.K., J.J.L., M.Piejko (M.P.2), D.W., K.B.S., and P.E.F. The remaining authors declare no competing interests in relation to this work.

Figures

Fig. 1
Fig. 1
Characteristics of human induced pluripotent stem cells (hiPSCs) cultured in different oxygen conditions. A Microscopic images of hiPSCs colonies in bright field (BF) and immunofluorescent staining for the presence of pluripotency markers: SSEA4, OCT4, and CD133. Staining of cell nuclei — DAPI. B Analysis of expression levels of transcription factors related to pluripotency: OCT4, NANOG, and SOX2 by real-time qPCR (n = 6). Cell culture conditions: N — atmospheric oxygen concentration — normoxia; H5 — hypoxia 5% O2; H3 — hypoxia 3% O2. All data are presented as the mean ± SD. Statistical significance was tested using Welch ANOVA followed by a post hoc analysis with the Dunnett test (B). *p < 0.05; ***p < 0.001
Fig. 2
Fig. 2
Characteristics of EVs derived from iPSCs cultured under different oxygen conditions: normoxia — 21% O2 (EV-N), hypoxia 5% O2 (EV-H5), and hypoxia 3% O2 (EV-H3). EVs from human dermal fibroblasts (DF-EVs) were used as control. A Images of EVs by transmission electron microscopy. B Representative histograms of EV size and concentration measured with the NanoSight device. C Size analysis of EVs by NanoSight (n = 4 for DF-EVs; n = 6 for hiPS-EVs). D Analysis of EV particle number per ml of conditioned medium (CM) (n = 4–6). E Analysis of the EV protein yield calculated per ml of CM (n = 4–6). F Ratio of EV particle number to protein concentration (n = 4–6). G Western blot analysis of proteins typical for EVs: syntenin, flotillin1, CD9, CD81, a protein present in the cell culture medium (transferrin), pluripotency markers (OCT4, CD133, E-cadherin), endoplasmic reticulum protein (calnexin; a negative marker), and control — β-tubulin. H Densitometric analysis of CD81 protein level in EV preps derived from different oxygen conditions (n = 3). I Confocal microscopy images of DiD-labeled EVs (red) uptake by human cardiac fibroblasts (hCF; stained in green with DiO). Representative images of different cell depths are shown. All data are presented as the mean ± SD. Statistical significance was tested using Welch ANOVA and the Dunnett post hoc test (CE) and with the one-way ANOVA and the Tukey post hoc test (F, H). *p < 0.05, **p < 0.01
Fig. 3
Fig. 3
Comparison of the anti-fibrotic effect of hiPS-EVs derived from different oxygen conditions on human cardiac fibroblasts (hCFs). A Schematic illustration of the experimental pipeline. B Fluorescence-based microscopic analysis of the efficiency of fibroblasts-to-myofibroblasts transition (FMT) in hCFs. α-SMA-positive fibers stained in green. Representative images are shown. C Analysis of the percentage of myofibroblasts in hCF populations (% ± SD, n = 9). D Detection of α-SMA protein in hCFs by Western blot in relation to GAPDH level. E Densitometric analysis of α-SMA protein level in hCFs in arbitrary units [AU] (n = 3–9). F Measurement of the expression level of pro-fibrotic genes (ACTA2, COL1A1, COL3A1) by real-time qPCR method (n = 3–6). Abbreviations: CTRL, control hCFs, not treated with TGFβ; TGFβ, hCFs treated with 1 ng/ml of TGFβ; EV-DF, hCFs treated with EVs released by human dermal fibroblasts (hDFs); EV-N, hCFs treated with EVs collected in normoxia (21% O2); EV-H5, hCFs treated with EVs collected in hypoxia 5% O2; EV-H3, hCFs treated with EVs collected in hypoxia 3% O2. All data are presented as the mean ± SD. Statistical significance was tested using the Kruskal–Wallis test with Dunn’s post hoc test (C, E, F: COL1A1) and one-way ANOVA and Tukey’s post hoc test (F: ACTA2, COL3A1). *p < 0.05; **p < 0.01; ***p < 0.001; ****p < 0.0001
Fig. 4
Fig. 4
Analysis of hiPS-EV-H5 impact on the actin cytoskeleton, focal contacts, and mechanical properties of human cardiac fibroblasts (hCFs) stimulated with TGFβ (1 ng/ml). EV-H5 from hiPSC-L3 were used. A Representative fluorescence microscopy images of hCFs. The insets in the upper corners of the images are zoomed areas marked with white rectangles showing mature focal contacts (FCs). Quantitative data of FC measurements are shown in the graphs below: FCs length (B) and area (C) (n = 105). D Analysis of transcript levels of genes associated with the formation of FCs (PFN, PXN, TLN1) by real-time qPCR (n = 4). E Optical microscopy images of cells during AFM analysis, followed by high-resolution morphology images (F) as well as elasticity maps (G) of the cells. Dash squares in the optical images indicate scanning areas covered by AFM. Black and red horizontal lines in (F) and (G) indicate cross-sections and the corresponding cross-section analyses are shown in (H). I Scatter graph showing values of the Young’s modulus determined with AFM force spectroscopy (n = 30). All data are presented as the mean ± SD. Statistical significance was tested using Kruskal–Wallis with Dunn’s post hoc test (BD, I). *p < 0.05; **p < 0.01; ***p < 0.001; ****p < 0.0001
Fig. 5
Fig. 5
Analysis of fibrosis-related signaling pathway involving SMAD2 and SNAI2 transcription factors in human cardiac fibroblasts (hCFs) stimulated with TGF-β (1 ng/ml) and treated with EV-H5 (from hiPS-L3). A Confocal microscopy tile scans containing 5 × 5 images of cells, followed by high magnification Airyscan images of individual nuclei (B). C Quantification of pSMAD2 foci in the nucleus (upper panel) or cytoplasm (lower panel) in hCFs (n = 10). Fluorimetric analysis of pSMAD2 (n = 55) (D) and SNAI2 (n = 30) (E) protein level in cell nuclei. F Relative quantification of SNAI1 (n = 3) and SNAI2 (n = 4) genes expression in the tested samples by real-time qPCR. G Analysis of mRNA levels of pro-fibrotic genes in activated hCFs after EV-H5 treatment (n = 4). All data are presented as the mean ± SD. Statistical significance was tested using Welch ANOVA and Dunnet’s test (C) or with Kruskal–Wallis with Dunn’s post hoc test (D-G). *p < 0.05; **p < 0.01; ***p < 0.001; ****p < 0.0001
Fig. 6
Fig. 6
Analysis of the composition and functional networks of miRNAs present in hiPS-EVs. EVs were isolated from 3 iPSC lines cultured in different oxygen conditions: N-normoxia (21% O2); H5 — hypoxia 5% O2; H3 — hypoxia 3% O2. A Percentage of the 12 most abundant miRNAs in EVs based on miRNA-seq analysis (n = 3). B Comparison of the content of individual miRNAs from the Top 12 miRNAs in hiPS-EVs (n = 3). C Heatmap of KEGG pathways for the miR-302 cluster generated by the mirPath v.3 software (DIANA Tools). WIKIPathways analysis of target genes for miR-302 cluster (D) and miRNA-gene network with depicted genes from TGFβ pathway (TGFBR2, PFN, CFN) (E) generated by the Mienturnet web tool. F Gene ontology (GO) terms (biological process, cellular component, and molecular function) for hsa-miR-302b-3p target genes created with the mirPath v.3 software. TF – transcription factor. All data are presented as the mean ± SD. Statistical significance was calculated in R using t-test (B). *p < 0.05
Fig. 7
Fig. 7
Validation of hsa-miR-302b-3p target genes in human cardiac fibroblasts (hCFs) upon EV-H5 (from hiPS-L3) treatment with the real-time qPCR method. hCFs were transfected with specific miRNA inhibitors or miRNA mimic and treated with EV-H5 and TGFβ (1 ng/ml). Mock-transfected and TGFβ-treated cells were used as control (CTRL). Targets for miR-302b-3p were selected using the TargetScanHuman 8.0, the miRDB, and the DIANA mirPath v.3 databases. Abbreviations: C-i, miRNA-non-targeting inhibitor; miR302-i, miR-302b-3p inhibitor; miR302-m, miR-302b-3p mimic. All data are presented as the mean ± SD (n = 3). Statistical significance was tested using one-way ANOVA and the Tukey post hoc test. *p < 0.05; **p < 0.01; ***p < 0.001
Fig. 8
Fig. 8
Assessment of the inflammatory status in mouse hearts after treatment with angiotensin II and hiPS-EVs. A Schematic illustration of the experimental pipeline. B Hematoxylin–eosin staining of heart tissue cross-sections. Inflamed areas with visible infiltration of immune cells can be recognized as bluish areas in contrast to a healthy tissue in pink. Representative pictures of cross-sections (upper panel) and zoomed areas (lower panel) are shown. C Relative quantification of immune cell infiltration in the heart tissue (n = 5–6). D Analysis of transcript levels for pro-inflammatory cytokines (Tnf-α, Il-6) measured with real-time qPCR method (n = 5–6). Abbreviations: PBS, control mice without induction of fibrosis; Ang14, fibrotic mice analyzed 14 days after angiotensin II administration in osmotic pumps; Ang28, fibrotic mice analyzed at the end of the experiment (day 28). Fibrotic mice received EVs from the atmospheric oxygen concentration — EV-N or from the 5% O2 hypoxia (EV-H5). All data are presented as the mean ± SD. Statistical significance was tested using Kruskal–Wallis and Dunn’s post hoc test (C) and Welch-ANOVA with Dunnett’s post hoc test (D). *p < 0.05; **p < 0.01
Fig. 9
Fig. 9
Analysis of fibrosis in mice hearts after treatment with angiotensin II and hiPS-EVs. Mice received angiotensin II for 14 (group Ang14) or 28 days (the rest of the animals) in osmotic pumps implanted subcutaneously. Next, they were treated with hiPS-EVs derived from normoxia (EV-N) or hypoxia 5% O2 (EV-H5). Control animals received PBS only (group PBS). A Microscopic images of collagen staining in mouse hearts using the Sirius red dye. Cross-sections (upper panel) and zoomed areas (lower panel) are presented. B Analysis of transcript levels of key genes involved in fibrosis (Acta2, Col1a1, Col3a1, Ctgf), performed by real-time qPCR (n = 5–6). C Analysis of pro-fibrotic proteins (α-Sma, Col1a1, and Col3a1) by Western blot. D Densitometric analysis of the protein levels normalized to the level of control protein (Vinculin) (n = 5–6). All data are presented as the mean ± SD. Statistical significance was tested using one-way ANOVA with the Tukey post hoc test (B, D — Col3a1) or Kruskal–Wallis and Dunn’s post hoc test (D — α-Sma, Col1a1). *p < 0.05; **p < 0.01; ***p < 0.001

References

    1. Roth GA, Mensah GA, Fuster V. The global burden of cardiovascular diseases and risks. J Am Coll Cardiol. 2020;76:2980–2981. doi: 10.1016/j.jacc.2020.11.021. - DOI - PubMed
    1. Vaduganathan M, Mensah GA, Turco JV, Fuster V, Roth GA. The global burden of cardiovascular diseases and risk. J Am Coll Cardiol. 2022;80:2361–2371. doi: 10.1016/j.jacc.2022.11.005. - DOI - PubMed
    1. Scridon A, Balan AI. Targeting myocardial fibrosis-a magic pill in cardiovascular medicine? Pharmaceutics. 2022;14:1599. doi: 10.3390/pharmaceutics14081599. - DOI - PMC - PubMed
    1. Bing R, Dweck MR. Myocardial fibrosis: why image, how to image and clinical implications. Heart. 2019;105:1832–1840. doi: 10.1136/heartjnl-2019-315560. - DOI - PMC - PubMed
    1. Liu M, López de Juan Abad B, Cheng K. Cardiac fibrosis: myofibroblast-mediated pathological regulation and drug delivery strategies. Adv Drug Deliv Rev. 2021;173:504–19. - PMC - PubMed

Publication types

LinkOut - more resources