. 2023 Oct 30;24(1):248.
doi: 10.1186/s13059-023-03087-5.

Landscape of enhancer disruption and functional screen in melanoma cells

Affiliations

Landscape of enhancer disruption and functional screen in melanoma cells

Zhao Wang et al. Genome Biol. .

Abstract

Background: The high mutation rate throughout the entire melanoma genome presents a major challenge in stratifying true driver events from the background mutations. Numerous recurrent non-coding alterations, such as those in enhancers, can shape tumor evolution, thereby emphasizing the importance in systematically deciphering enhancer disruptions in melanoma.

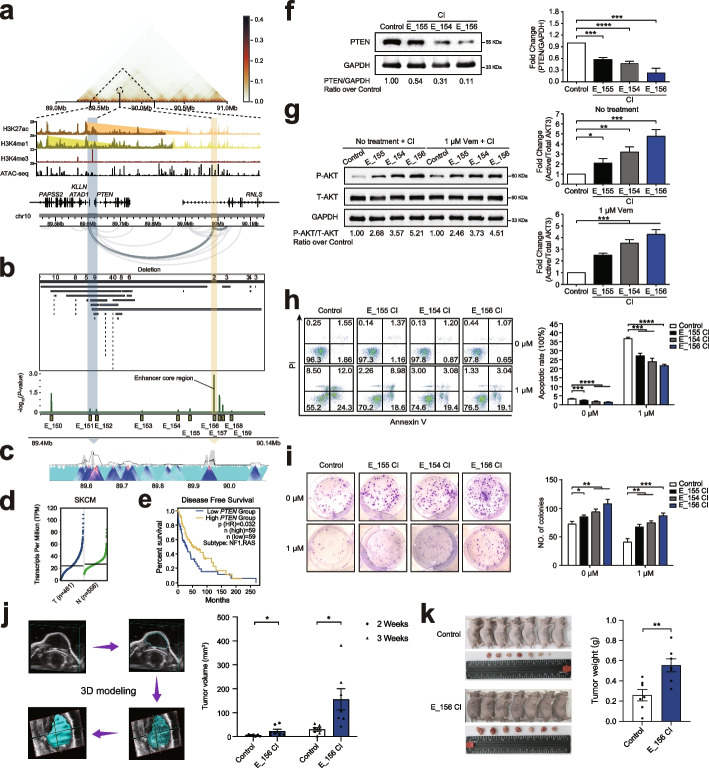
Results: Here, we leveraged 297 melanoma whole-genome sequencing samples to prioritize highly recurrent regions. By performing a genome-scale CRISPR interference (CRISPRi) screen on highly recurrent region-associated enhancers in melanoma cells, we identified 66 significant hits which could have tumor-suppressive roles. These functional enhancers show unique mutational patterns independent of classical significantly mutated genes in melanoma. Target gene analysis for the essential enhancers reveal many known and hidden mechanisms underlying melanoma growth. Utilizing extensive functional validation experiments, we demonstrate that a super enhancer element could modulate melanoma cell proliferation by targeting MEF2A, and another distal enhancer is able to sustain PTEN tumor-suppressive potential via long-range interactions.

Conclusions: Our study establishes a catalogue of crucial enhancers and their target genes in melanoma growth and progression, and illuminates the identification of novel mechanisms of dysregulation for melanoma driver genes and new therapeutic targeting strategies.

Keywords: Enhancer; Highly recurrent regions (HRRs); Melanoma; Myocyte enhancer factor 2A (MEF2A); Phosphatase and tensin homolog (PTEN).


Conflict of interest statement

The authors declare that they have no competing interests.

Figures

Fig. 1
Fig. 1
Genome-wide identification and prioritization of highly recurrent regions (HRRs) based on 297 melanoma WGS data. a Schematic view of HRR detection strategy and functional enhancer screening in this study. b Circos diagram summarizing the full HRR content of melanoma (SNV: single-nucleotide variant, DEL: deletion, DUP: duplication, INV: inversion, and TRA: translocations). Colors of the tracks and label links are determined by mutation types, only genes with most highly recurrence mutation and driver evidence are labeled, genes are divided by color according to different evidence sources (yellow: genetic evidence, candidate melanoma driver genes with genetic evidence carrying significant mutations which were integrated from several large-scale sequencing studies and reviews [2, 3, 10]; green: functional evidence, melanoma essential genes with functional evidence which were collected from The Cancer Dependency Map (DepMap) [24, 25]; blue: literature evidence, putative melanoma cancer genes which were compiled from public cancer gene databases including CancerMine [26], IntOGen [27], and NCG [28]). c Top 50 significant SNV/INDEL-HRRs after correcting background mutations and covariates, genes are labeled according to genetic and functional evidence. Also, dots were filled by different color based on genomic attributes of HRRs (exon: blue; promoter: light green; enhancer: yellow). d Genomic features of the top 50 prioritized SV-HRRs, bar plot represents total recurrence of each HRR, the heatmap provides the genomic location (GRCh37/hg19), types of HRRs as well as their recurrence. Melanoma essential genes in the right panel are present according to different evidence sources
Fig. 2
Fig. 2
Functional screen of HRR-associated enhancers in melanoma. a Functional evaluation of HRR-associated enhancer in A375 public CRISPR KO positive selection screen. Scatter plot represents the most significant presumed target genes of HRR-associated enhancers in CRISPR positive selection results, presumed targets were defined as genes within 1 Mb upstream and downstream of enhancers; box plot represents the difference of CRISPR enrichment scores between the presumed genes in HRR-associated enhancer across 5 HRR types group and those in HRR-unrelated enhancer group, Mann–Whitney U test (p-value DEL = 0.0033; p-value DUP = 0.0028; p-value SNV = 0.0076). b Pipeline for selecting HRR-associated enhancer core regions, CRISPRi sgRNA library design and screening workflow. c CRISPRi screen result at enhancer level, a total of 66 functional enhancers with FDR < 0.05 were highlighted. Details about the top 20 enhancers are shown on the right table. d Annotation of candidate target genes of the functional enhancers according to H3K27ac HiChIP loops, genes are labeled by colors according to different evidence sources (purple: genetic evidence, green: functional evidence, blue: literature evidence, and yellow: other cancer driver genes, annotation resource see “Methods” for details). e CRISPRi screen result at sgRNA level, the sgRNA enrichment diagrams were shown for the top 4 significant enhancers
Fig. 3
Fig. 3
Genetic and epigenetic characteristics of melanoma functional enhancers. a Distribution of the functional enhancers in different HRR types, and DEL-HRRs showed a stronger enrichment in the CRISPRi screening, p-value = 0.036, Mann–Whitney U test. b De novo mutational signature analysis of functional HRR-associated enhancers identified two predominant signatures corresponding to ultraviolet light exposure (SBS7a) and platinum treatment (SBS31). Cosine similarity values with COSMIC mutational signatures are shown. c Epigenetic features of the functional enhancers in melanoma, the upset plot represents the distribution of five epigenetic signals on the functional enhancers, the bar plot shows driver mutation types, and CRISPRi screen p-values were labeled for top enhancers. d Colocalized transcription factors at the functional enhancer regions. e Mutational spectrum and molecular classification for genomic loci of the functional enhancers based on WGS somatic mutation profiles of 137 MELA-AU cutaneous melanoma samples. The overall recurrence rate of enhancer-located HRR is shown on the side bar, the number of HRRs per patient is shown on the top bar graph, and the functional enhancers and the target genes support by HiChIP are shown on the left. Enhancers are clustered according to their HRR types, and patients are grouped based on previous molecular classification (mutant BRAF, mutant RAS, mutant NF1, and Triple-WT) defined by TCGA
Fig. 4
Fig. 4
Target genes analysis of melanoma functional enhancers based on H3K27ac HiChIP. a Candidate target genes of the top 20 functional enhancers, genes are labeled with different colors according to different evidence sources. b KEGG pathway enrichment analysis of the target genes with cancer-related evidence. c Target gene distribution in public A375 CRISPR KO positive screen, significant target genes for the top 20 functional enhancers are labeled. d Target gene distribution in the differential expression analysis of TCGA-SKCM samples, significant target genes for the top 20 functional enhancers are labeled. e Overlaps among target genes of the functional enhancers, A375 CRISPR KO positive selected genes and significantly downregulated genes in TCGA-SKCM. f Overlaps among target genes of the functional enhancers and different layers of tumor suppressor evidence
Fig. 5
Fig. 5
Loss of super enhancer element E_349 in melanoma unlocks tumor growth potential by modulating MEF2A expression. a Epigenetic and 3D genome profiles at the E_349-contained super enhancer and MEF2A locus (GRCh37/hg19 chr15: 99,800,000–100,400,000), including signals of A375 combined Hi-C, H3K27ac, H3K4me1, H3K4me3, ATAC-seq, and HiChIP loops. b Genomic profiles of recurrent DELs and CRISPRi enhancer screen results at the E_349 and MEF2A locus on 297 melanoma samples. c 4C assay result of interaction between the MEF2A promoter and E_349, light blue arrow refers to the 4C viewpoint (VP), and peak region highlighted by yellow arrow represents the chromosome region interacting with the VP. d Expression levels of MEF2A in tumor (T, n = 461 samples) and normal tissues (N, n = 558 samples) were analyzed using the TCGA-SKCM data. e Overall survival analysis of MEF2A in the low MEF2A expressed group and high MEF2A expressed group were compared using the TCGA-SKCM data. fg The E_349 core sequence (GRCh37/hg19 chr15: 99,982,353–99,983,277) was cloned into pGL3-Promoter vector, and Luciferase assays were performed in 293T cells (f), and A375 cells (g). hi Western blotting results of MEF2A protein expression in the E_349-inhibited A375-KRAB (h) and E_349-activated A375-VP64 (i) cells. jk Cell apoptosis (j) and Plate clone formation (k) assay results of the E_349-inhibited A375-KRAB cells with 1 µM vemurafenib or without treatment (n = 3 samples). lm The representative three-dimension (3D) modeling graphs and statistical results in calculating tumor volumes for E_349-inhibited A375-KRAB and control cells (l) at 2 or 3 weeks after subcutaneous injection in 5-week-old female nude mice, and then the tumors were weighed (m) after euthanasia of the mice (n = 7 mice). CI denotes CRISPR interference, and CA denotes CRISPR activation. Left graph is the representative result, and right graph is the statistical result. All the data are expressed as the means ± SD and analyzed by an unpaired two-tailed Student’s t test. Asterisks indicate significant differences between the indicated experimental groups: *, p < 0.05; **, p < 0.01; ***, p < 0.001; ****, p < 0.0001
Fig. 6
Fig. 6
Long-range interaction between E_156 and PTEN maintains melanoma-suppressive function. a Epigenetic and 3D genome profiles at the PTEN and its downstream enhancer locus (GRCh37/hg19 chr10: 89,400,000–90,140,000), including signals of A375 combined Hi-C, H3K27ac, H3K4me1, H3K4me3, ATAC-seq, and HiChIP loops. b Genomic profiles of recurrent DELs and CRISPRi enhancer screen results at the E_156 and PTEN locus on 297 melanoma samples. c 4C assay result of interaction between the PTEN promoter and E_156, light blue arrow refers to the 4C viewpoint (VP), and peak region highlighted by yellow arrow represents the chromosome region interacting with the VP. d Expression levels of PTEN in tumor (T, n = 461 samples) and normal tissues (N, n = 558 samples) were analyzed using the TCGA-SKCM data. e Disease-free survival analysis of PTEN expression were analyzed using the TCGA-SKCM data. Low expression of PTEN predicts shorter disease-free survival. f Western blotting results of MEF2A protein expression in the E_156 (E_155 or E_154 adjacent to E_156)-inhibited A375-KRAB cells. g Western blotting results of PI3K/AKT signaling pathway activation in the E_156 (E_155 or E_154 adjacent to E_156)-inhibited A375-KRAB cells with 1 µM vemurafenib or without treatment. P-AKT denotes Phosphorylated AKT, and T-AKT denotes total AKT. hi Cell apoptosis (h) and Plate clone formation (i) assay results of the E_156 (E_155 or E_154 adjacent to E_156)-inhibited A375-KRAB cells with 1 µM vemurafenib or without treatment (n = 3 samples). j,k The representative three-dimension (3D) modeling graphs and statistical results in calculating tumor volumes for E_156-inhibited A375-KRAB and control cells at 2 or 3 weeks after subcutaneous injection in 5-week-old female nude mice (j), and then the tumors were weighed (k) after euthanasia of the mice (n = 7 mice). CI denotes CRISPR interference, and CA denotes CRISPR activation. Left graph is the representative result, and right graph is the statistical result. All the data are expressed as the means ± SD and analyzed by an unpaired two-tailed Student’s t test. Asterisks indicate significant differences between the indicated experimental groups: *, p < 0.05; **, p < 0.01; ***, p < 0.001; ****, p < 0.0001

References

    1. Saginala K, Barsouk A, Aluru JS, Rawla P, Barsouk A. Epidemiology of melanoma. Med Sci (Basel) 2021;9:63. - PMC - PubMed
    1. Cancer Genome Atlas N Genomic classification of cutaneous melanoma. Cell. 2015;161:1681–1696. doi: 10.1016/j.cell.2015.05.044. - DOI - PMC - PubMed
    1. Hayward NK, Wilmott JS, Waddell N, Johansson PA, Field MA, Nones K, Patch AM, Kakavand H, Alexandrov LB, Burke H, et al. Whole-genome landscapes of major melanoma subtypes. Nature. 2017;545:175–180. doi: 10.1038/nature22071. - DOI - PubMed
    1. Newell F, Kong Y, Wilmott JS, Johansson PA, Ferguson PM, Cui C, Li Z, Kazakoff SH, Burke H, Dodds TJ, et al. Whole-genome landscape of mucosal melanoma reveals diverse drivers and therapeutic targets. Nat Commun. 2019;10:3163. doi: 10.1038/s41467-019-11107-x. - DOI - PMC - PubMed
    1. Newell F, Wilmott JS, Johansson PA, Nones K, Addala V, Mukhopadhyay P, Broit N, Amato CM, Van Gulick R, Kazakoff SH, et al. Whole-genome sequencing of acral melanoma reveals genomic complexity and diversity. Nat Commun. 2020;11:5259. doi: 10.1038/s41467-020-18988-3. - DOI - PMC - PubMed

Publication types