Placental size at gestational week 36: Comparisons between ongoing pregnancies and deliveries
- PMID: 37904568
- PMCID: PMC10755138
- DOI: 10.1111/aogs.14700
Placental size at gestational week 36: Comparisons between ongoing pregnancies and deliveries
Abstract
Introduction: We aimed to compare placental size and placental size relative to fetal size (ratio) in ongoing pregnancies examined by magnetic resonance imaging (MRI) at gestational week 36 with placental size among all deliveries at gestational week 36 during the same time period.
Material and methods: Ongoing unselected singleton pregnancies (n = 89) were examined by MRI at median gestational week 36+5 days during 2017-2018, and placental and fetal volumes (cm3 ) were calculated. The placental size and ratio in ongoing pregnancies were compared with placental size and ratio among all deliveries in Norway at gestational week 36 (median gestational week 36+4 days) during 2016-2019 (n = 5582). For comparison of size, we converted volume (cm3 ) in ongoing pregnancies into grams as: cm3 × 1.05 (density of placental and fetal tissue).
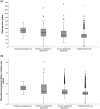
Results: In ongoing pregnancies, median placental size was 873 (interquartile range [IQR] 265) grams and median size of all delivered placentas was 613 (IQR 290) grams. Placental size was smaller among the delivered placentas independent of delivery mode: 760 (IQR 387) grams among elective cesarean deliveries (n = 465) and 590 (IQR 189) grams among vaginal deliveries after spontaneous onset of labor (n = 2478). Median ratio in ongoing pregnancies was higher than among deliveries: 0.31 (IQR 0.08) vs 0.21 (IQR 0.08). The ratio was higher in ongoing pregnancies independent of delivery mode: 0.24 (IQR 0.17) among elective cesarean deliveries vs 0.21 (IQR 0.05) among vaginal deliveries after spontaneous onset of labor.
Conclusions: The placenta is larger in ongoing pregnancies than among deliveries. This finding suggests that placental size decreases during labor and delivery, possibly by transfer of blood to the fetus. Our finding also suggests that reference values of placental size based on delivered placentas are not valid for ongoing pregnancies.
Keywords: birth; obstetrics; placenta; pregnancy.
© 2023 The Authors. Acta Obstetricia et Gynecologica Scandinavica published by John Wiley & Sons Ltd on behalf of Nordic Federation of Societies of Obstetrics and Gynecology (NFOG).
Conflict of interest statement
The authors have stated explicitly that there are no conflicts of interest in connection with this article.
Figures


Similar articles
-
Percentiles of intrauterine placental volume and placental volume relative to fetal volume: A prospective magnetic resonance imaging study.Placenta. 2022 Apr;121:40-45. doi: 10.1016/j.placenta.2022.02.023. Epub 2022 Mar 1. Placenta. 2022. PMID: 35259595
-
The association of placental to fetal ratio with pregnancy duration.Acta Obstet Gynecol Scand. 2025 May;104(5):913-921. doi: 10.1111/aogs.15082. Epub 2025 Mar 5. Acta Obstet Gynecol Scand. 2025. PMID: 40042092 Free PMC article.
-
Is gestational age at term a risk factor for ongoing pregnancies in nulliparous women: A prospective cohort study.Am J Obstet Gynecol MFM. 2023 Feb;5(2):100808. doi: 10.1016/j.ajogmf.2022.100808. Epub 2022 Nov 10. Am J Obstet Gynecol MFM. 2023. PMID: 36371036
-
Cesarean section on request at 39 weeks: impact on shoulder dystocia, fetal trauma, neonatal encephalopathy, and intrauterine fetal demise.Semin Perinatol. 2006 Oct;30(5):276-87. doi: 10.1053/j.semperi.2006.07.009. Semin Perinatol. 2006. PMID: 17011400 Review.
-
[Gentle obstetrical management for very early preterm deliveries].Gynakol Geburtshilfliche Rundsch. 2004 Jan;44(1):10-18. doi: 10.1159/000074312. Gynakol Geburtshilfliche Rundsch. 2004. PMID: 14673223 Review. German.
Cited by
-
Combining Transcriptomics and Proteomics to Screen Candidate Genes Related to Bovine Birth Weight.Animals (Basel). 2024 Sep 23;14(18):2751. doi: 10.3390/ani14182751. Animals (Basel). 2024. PMID: 39335340 Free PMC article.
References
-
- Thompson JM, Irgens LM, Skjaerven R, Rasmussen S. Placenta weight percentile curves for singleton deliveries. BJOG. 2007;114:715‐720. - PubMed
-
- Almog B, Shehata F, Aljabri S, Levin I, Shalom‐Paz E, Shrim A. Placenta weight percentile curves for singleton and twins deliveries. Placenta. 2011;32:58‐62. - PubMed
-
- Dombrowski MP, Berry SM, Johnson MP, Saleh AA, Sokol RJ. Birth weight‐length ratios, ponderal indexes, placental weights, and birth weight‐placenta ratios in a large population. Arch Pediatr Adolesc Med. 1994;148:508‐512. - PubMed
-
- Wallace JM, Bhattacharya S, Horgan GW. Gestational age, gender and parity specific centile charts for placental weight for singleton deliveries in Aberdeen, UK. Placenta. 2013;34:269‐274. - PubMed
-
- Burkhardt T, Schäffer L, Schneider C, Zimmermann R, Kurmanavicius J. Reference values for the weight of freshly delivered term placentas and for placental weight‐birth weight ratios. Eur J Obstet Gynecol Reprod Biol. 2006;128:248‐252. - PubMed
MeSH terms
Grants and funding
LinkOut - more resources
Full Text Sources
Medical

