. 2021 Apr 26;2(1):223-237.
doi: 10.5194/mr-2-223-2021. eCollection 2021.

Conformational features and ionization states of Lys side chains in a protein studied using the stereo-array isotope labeling (SAIL) method

Affiliations

Conformational features and ionization states of Lys side chains in a protein studied using the stereo-array isotope labeling (SAIL) method

Mitsuhiro Takeda et al. Magn Reson (Gott). .

Abstract

Although both the hydrophobic aliphatic chain and hydrophilic ζ-amino group of the Lys side chain presumably contribute to the structures and functions of proteins, the dual nature of the Lys residue has not been fully investigated using NMR spectroscopy, due to the lack of appropriate methods to acquire comprehensive information on its long consecutive methylene chain. We describe herein a robust strategy to address the current situation, using various isotope-aided NMR technologies. The feasibility of our approach is demonstrated for the Δ+PHS/V66K variant of staphylococcal nuclease (SNase), which contains 21 Lys residues, including the engineered Lys-66 with an unusually low pKa of 5.6. All of the NMR signals for the 21 Lys residues were sequentially and stereospecifically assigned using the stereo-array isotope-labeled Lys (SAIL-Lys), [U-13C,15N; β2,γ2,δ2,ε3-D4]-Lys. The complete set of assigned 1H, 13C, and 15N NMR signals for the Lys side-chain moieties affords useful structural information. For example, the set includes the characteristic chemical shifts for the 13Cδ, 13Cε, and 15Nζ signals for Lys-66, which has the deprotonated ζ-amino group, and the large upfield shifts for the 1H and 13C signals for the Lys-9, Lys-28, Lys-84, Lys-110, and Lys-133 side chains, which are indicative of nearby aromatic rings. The 13Cε and 15Nζ chemical shifts of the SNase variant selectively labeled with either [ε-13C;ε,ε-D2]-Lys or SAIL-Lys, dissolved in H2O and D2O, showed that the deuterium-induced shifts for Lys-66 were substantially different from those of the other 20 Lys residues. Namely, the deuterium-induced shifts of the 13Cε and 15Nζ signals depend on the ionization states of the ζ-amino group, i.e., -0.32 ppm for Δδ13Cε [NζD3+-NζH3+] vs. -0.21 ppm for Δδ13Cε [NζD2-NζH2] and -1.1 ppm for Δδ15Nζ[NζD3+-NζH3+] vs. -1.8 ppm for Δδ15Nζ[NζD2-NζH2]. Since the 1D 13C NMR spectrum of a protein selectively labeled with [ε-13C;ε,ε-D2]-Lys shows narrow (> 2 Hz) and well-dispersed 13C signals, the deuterium-induced shift difference of 0.11 ppm for the protonated and deprotonated ζ-amino groups, which corresponds to 16.5 Hz at a field strength of 14 T (150 MHz for 13C), could be accurately measured. Although the isotope shift difference itself may not be absolutely decisive to distinguish the ionization state of the ζ-amino group, the 13Cδ, 13Cε, and 15Nζ signals for a Lys residue with a deprotonated ζ-amino group are likely to exhibit distinctive chemical shifts as compared to the normal residues with protonated ζ-amino groups. Therefore, the isotope shifts would provide a useful auxiliary index for identifying Lys residues with deprotonated ζ-amino groups at physiological pH levels.


Conflict of interest statement

The authors declare that they have no conflict of interest.

Figures

Figure 1
Figure 1
Sequential assignment of the Lys side-chain signals for the SNase variant selectively labeled with SAIL-Lys using the 3D HCCH TOCSY experiment. Panels (a) and (b) show a comparison of the F1–F3 projections of the 3D HCCH TOCSY spectra obtained for the SNase variant selectively labeled with either [U- 13 C, 15 N]-Lys (a) or SAIL-Lys (b). A complete side-chain signal assignment was established for the SNase variant selectively labeled with SAIL-Lys by the correlation networks on the 3D HCCH TOCSY spectrum, starting from the backbone 1 H α and 13 C α signals with assignments deposited in the BMRB (entry #16123; Chimenti et al., 2011). For example, the 1 H ε2 13 C ε HSQC signals in panel (d) were unambiguously correlated to the backbone 1 H α 13 C α HSQC signals in panel (e), through the 1 H α 1 H ε2 correlation signals in panel (c), which represents the F1–F3 projection of the 3D HCCH TOCSY spectrum along the 13 C axis (F2) restricted for the 13 C ε shift range of 40.1–45.5 ppm. The structure of SAIL-Lys, [U- 13 C, 15 N; β2 , γ2 , δ2 , ε3 -D 4 ]-Lys, is shown in panel (f). The spectrum was measured at 30  C on a Bruker Avance 600 spectrometer equipped with a TXI cryogenic probe. The chemical shifts for the 1 H and 13 C dimensions are δTSP .
Figure 2
Figure 2
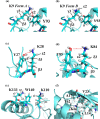
The local structures around the Lys residues, which exhibit unusual side-chain chemical shifts, in the crystal structure of the SNase variant (PDB: 3HZX). The crystal structure of the SNase variant was solved as a complex with calcium ions and thymidine 3 ,5 -diphosphate. Therefore, it may be slightly different from that in the free state. The figures were created with PyMOL 2.4 software in order to highlight the relative orientations between the Lys side chains and nearby aromatic rings (a)–(e) and Lys-66 and the surrounding hydrophobic amino acids (f). The atom nomenclature of the prochiral hydrogen atoms used in the figure is that of the IUPAC recommendations (Markley et al., 1998).
Figure 3
Figure 3
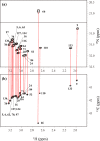
1D 15 N and 13 C NMR spectra of [ 15 N 2 ]-lysine in H 2 O and D 2 O. The 96.3 MHz 1D 15 N NMR spectra (a) and 239.0 MHz 1D 13 C NMR spectra (b) of [ 15 N 2 ]-lysine were measured at 30  C on a Bruker Avance III 950 spectrometer with a TCI cryogenic probe, using  70 mM solutions of 20 mM tris buffer prepared with H 2 O (or D 2 O) at pH (or pD) 8.0. The NMR spectra and the chemical shifts, δDSS ( 13 C  / 15 N), shown in blue and red, are those for the H 2 O and D 2 O buffer solutions, respectively. The deuterium-induced shifts, ΔδDSS ppm :  δ (in D 2 O)  - δ (in H 2 O), for the 15 N ζ and side-chain 13 C signals are shown in black.
Figure 4
Figure 4
125.7 MHz { 1 H, 2 D}-decoupled 1D 13 C NMR spectrum for the SNase variant selectively labeled with [ ε - 13 C; ε , ε -D 2 ]-Lys. The spectra were measured at 25  C, pH 8.0, in D 2 O solution on an Avance 500 spectrometer equipped with a DCH cryogenic probe. Although only a few discrete 13 C ε signals are apparent in panel (a), the congested spectral region around 41–42 ppm shows well-separated signals due to their narrow line widths of 1–2 Hz (b). All of the 1D NMR signals for 13 C ε were readily assigned using the chemical shift data, δTSP ( 13 C) obtained from the 3D HCCH TOCSY experiment for the SNase variant selectively labeled with SAIL-Lys (see Sect. 3.1).
Figure 5
Figure 5
Isotope shifts on the 13 C ε signals of the Lys residues in the SNase variant selectively labeled with [ ε - 13 C; ε , ε -D 2 ]-Lys, caused by the deuterium substitutions for the ζ -amino groups. The 125.7 MHz { 1 H, 2 D}-decoupled 1D 13 C NMR spectra were measured at 25  C, pH 8.0, in either H 2 (a), H 2 O : D 2 O (1 : 1) (b), or D 2 (c) solutions on an Avance 500 spectrometer equipped with a DCH cryogenic probe in H 2 (a), H 2 O : D 2 O (1 : 1) (b), and D 2 (c) solutions. The vertical dotted black and red lines show the chemical shifts observed in 100 % H 2 O and D 2 O, respectively. The complete data for the deuterium-induced isotope shifts for the side-chain 15 N ζ and 13 C ε signals are summarized in Table 2.
Figure A1
Figure A1
Distribution of the Lys residues in the crystalline structure of the Δ+ PHS/V66K variant of SNase (PDB#: 3HZX). All of the side-chain moieties of the Lys residues, which are shown by the ball-and-stick model in blue, exist on the protein surface, except for the Lys-66 (K66). This engineered residue is locked in the protein interior that is originally occupied by the Val side chain in the wild-type protein. Two Lys residues, K5 and K6, were not visible in the X-ray analysis of the SNase complexed with calcium and thymidine 3 ,5 -diphosphate, and thus it may be slightly different from that in the free state. The figure was created using PyMOL 2.4 software.
Figure A2
Figure A2
{ 1 H, 2 D}-1D 13 C NMR spectra for the SNase variant selectively labeled with [ ε - 13 C; ε , ε -D 2 ]-Lys. The 125.7 MHz 13 C NMR spectra were measured at 25  C on a Bruker Avance 500 spectrometer equipped with a 13 C-observing DCH cryogenic probe. The broad background signals observed in the spectrum (b), indicated by a thick arrow, are due to the natural abundant 13 C atoms bound to proton(s), which are readily filtered out to give the spectrum (c), using the pulse scheme shown in panel (a). The narrow and wide bars in the scheme represent 90 and 180 rectangular pulses, respectively, and are applied along the x axis at τ=1.7  ms, which corresponds to 1/4 1 J CH . The SNase variant was dissolved in 100 % D 2 O buffer, containing 20 mM sodium phosphate and 100 mM potassium chloride at pH 8.0. 13 C chemical shifts are referenced to TSP.
Figure A3
Figure A3
Comparison between the 13 C ε regions of the 2D 1 H– 13 C constant time (ct) HSQC spectra obtained for the SNase variant selectively labeled with [U- 13 C, 15 N]-Lys (a) and [U- 13 C, 15 N; β2 , γ2 , δ2 , ε3 -D 4 ]-Lys, SAIL-Lys (b). Since ε -carbons for the [U- 13 C, 15 N]-Lys residues are attached to the two prochiral protons, 1 H ε2 and 1 H ε3 , a pairwise correlation signals, namely 1 H ε2 13 C ε and 1 H ε3 13 C ε , can be observed for each of the ε -carbons (c). However, considerable large chemical shift differences between the prochiral ε -methylene protons were observed only for K110 ( Δδ , 0.15 ppm) and for K133 ( Δδ , 0.17 ppm), and the other 19 Lys residues showed differences less than  0.05 ppm. On the other hand, ε -carbons for the SAIL-Lys residues are attached only to the ε 2-protons, and all of the correlation signals are automatically assigned to 1 H ε2  (d). C ε peaks are labeled with their assignment. The spectra were measured at 30  C on an Avance 600 spectrometer equipped with a TXI cryogenic probe. 1 H and 13 C chemical shifts are referenced to TSP: δDSS δTSP =  0.15 ppm.
Figure A4
Figure A4
The HECENZ (a) and ct HSQC (b) spectra, recorded on a Bruker Avance 600 spectrometer ( 1 H, 600.0 MHz; 13 C, 150.9 MHz; 15 N, 60.8 MHz) using 1.4 mM D 2 O solutions of the Δ+ PHS/V66K SNase variants selectively labeled with SAIL-Lys, at 30  C, pD 8.0. Note that the chemical shifts of the 1 H and 13 C dimensions are referenced to DSS, while the 15 N dimension is referenced to TSP: δDSS δTSP =  0.15 ppm. The detailed experimental parameters are discussed in Sect. 2.2.

Similar articles

Cited by

References

    1. André I, Linse S, Mulder FA. Residue-specific pKa determination of lysine and arginine side chains by indirect 15N and 13C NMR spectroscopy: application to apo calmodulin. J Am Chem Soc. 2007;129:15805–15813. doi: 10.1021/ja0721824. - DOI - PubMed
    1. Barbas III CF, Heine A, Zhong G, Hoffmann T, Gramatikova S, Björnestedt R, List B, Anderson J, Stura EA, Wilson IA, Lerner RA. Immune versus natural selection: antibody aldolases with enzymic rates but broader scope. Science. 1997;278:2085–2092. doi: 10.1126/science.278.5346.2085. - DOI - PubMed
    1. Cavanagh J, Fairbrother WJ, Palmer AG, Rance M, Skelton JJ. Protein NMR Spectroscopy: Principles and Practice. Academic Press; New York, USA: 2007.
    1. Chimenti MS, Castañeda CA, Majumdar A, García-Moreno EB. Structural origins of high apparent dielectric constants experienced by ionizable groups in the hydrophobic core of a protein. J Mol Biol. 2011;405:361–377. doi: 10.1016/j.jmb.2010.10.001. - DOI - PMC - PubMed
    1. Clore GM, Bax A, Driscoll PC, Wingfield PT, Gronenborn AM. Assignment of the side chain 1H and 13C resonances of interleukin-1 beta using double- and triple-resonance heteronuclear three-dimensional NMR spectroscopy. Biochemistry. 1990;29:8172–8184. doi: 10.1021/bi00487a027. - DOI - PubMed

LinkOut - more resources