

An electrochemical cell for in operando 13C nuclear magnetic resonance investigations of carbon dioxide/carbonate processes in aqueous solution
- PMID: 37904775
- PMCID: PMC10539767
- DOI: 10.5194/mr-2-265-2021
An electrochemical cell for in operando 13C nuclear magnetic resonance investigations of carbon dioxide/carbonate processes in aqueous solution
Abstract
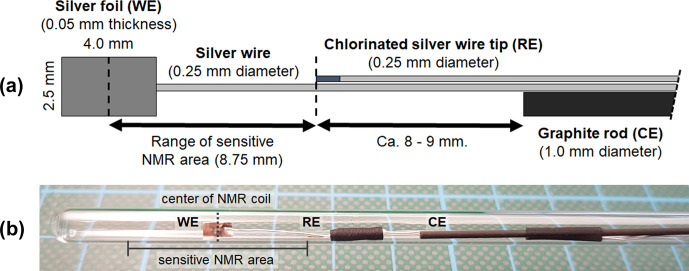
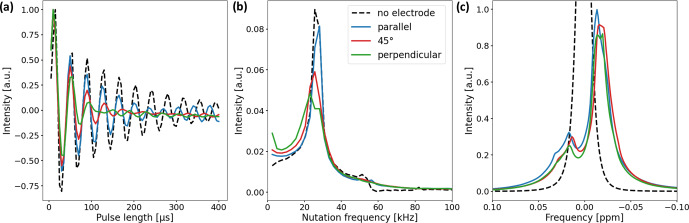
In operando nuclear magnetic resonance (NMR) spectroscopy is one method for the online investigation of electrochemical systems and reactions. It allows for real-time observations of the formation of products and intermediates, and it grants insights into the interactions of substrates and catalysts. An in operando NMR setup for the investigation of the electrolytic reduction of at silver electrodes has been developed. The electrolysis cell consists of a three-electrode setup using a working electrode of pristine silver, a chlorinated silver wire as the reference electrode, and a graphite counter electrode. The setup can be adjusted for the use of different electrode materials and fits inside a 5 mm NMR tube. Additionally, a shielding setup was employed to minimize noise caused by interference of external radio frequency (RF) waves with the conductive components of the setup. The electrochemical performance of the in operando electrolysis setup is compared with a standard electrolysis cell. The small cell geometry impedes the release of gaseous products, and thus it is primarily suited for current densities below 1 mA cm. The effect of conductive components on C NMR experiments was studied using a -saturated solution of aqueous bicarbonate electrolyte. Despite the field distortions caused by the electrodes, a proper shimming could be attained, and line widths of ca. 1 Hz were achieved. This enables investigations in the sub-Hertz range by NMR spectroscopy. High-resolution C NMR and relaxation time measurements proved to be sensitive to changes in the sample. It was found that the dynamics of the bicarbonate electrolyte varies not only due to interactions with the silver electrode, which leads to the formation of an electrical double layer and catalyzes the exchange reaction between and , but also due to interactions with the electrochemical setup. This highlights the necessity of a step-by-step experiment design for a mechanistic understanding of processes occurring during electrochemical reduction.
Copyright: © 2021 Sven Jovanovic et al.
Conflict of interest statement
The authors declare that they have no conflict of interest.
Figures


Similar articles
-
In operando NMR investigations of the aqueous electrolyte chemistry during electrolytic CO2 reduction.Commun Chem. 2023 Dec 6;6(1):268. doi: 10.1038/s42004-023-01065-3. Commun Chem. 2023. PMID: 38057421 Free PMC article.
-
Spectro-electrochemical setup for in situ and operando mechanistic studies on metal oxide electrode surfaces.Rev Sci Instrum. 2020 Aug 1;91(8):084104. doi: 10.1063/5.0007435. Rev Sci Instrum. 2020. PMID: 32872960
-
Surface Chemistry of Perovskite-Type Electrodes During High Temperature CO2 Electrolysis Investigated by Operando Photoelectron Spectroscopy.ACS Appl Mater Interfaces. 2017 Oct 18;9(41):35847-35860. doi: 10.1021/acsami.7b10673. Epub 2017 Oct 5. ACS Appl Mater Interfaces. 2017. PMID: 28933825 Free PMC article.
-
Variable Temperature and Pressure Operando MAS NMR for Catalysis Science and Related Materials.Acc Chem Res. 2020 Mar 17;53(3):611-619. doi: 10.1021/acs.accounts.9b00557. Epub 2020 Jan 13. Acc Chem Res. 2020. PMID: 31927984 Free PMC article. Review.
-
Electrochemical Approaches for CO2 Conversion to Chemicals: A Journey toward Practical Applications.Acc Chem Res. 2022 Mar 1;55(5):638-648. doi: 10.1021/acs.accounts.1c00674. Epub 2022 Jan 18. Acc Chem Res. 2022. PMID: 35041403 Review.
Cited by
-
Direct Imaging of Local pH Reveals Bubble-Induced Mixing in a CO2 Electrolyzer.ACS Sustain Chem Eng. 2023 Jul 3;11(28):10430-10440. doi: 10.1021/acssuschemeng.3c01773. eCollection 2023 Jul 17. ACS Sustain Chem Eng. 2023. PMID: 37476421 Free PMC article.
-
In operando NMR investigations of the aqueous electrolyte chemistry during electrolytic CO2 reduction.Commun Chem. 2023 Dec 6;6(1):268. doi: 10.1038/s42004-023-01065-3. Commun Chem. 2023. PMID: 38057421 Free PMC article.
-
Operando Benchtop NMR Quantifies Carbonation, Water Crossover, and Liquid Products for High-Current Electrochemical CO2 Reduction.ACS Catal. 2025 Jul 7;15(14):12300-12307. doi: 10.1021/acscatal.5c00355. eCollection 2025 Jul 18. ACS Catal. 2025. PMID: 40703648 Free PMC article.
-
Workflow for systematic design of electrochemical in operando NMR cells by matching B 0 and B 1 field simulations with experiments.Magn Reson (Gott). 2024 Nov 20;5(2):167-180. doi: 10.5194/mr-5-167-2024. eCollection 2024. Magn Reson (Gott). 2024. PMID: 40539095 Free PMC article.
-
Quantifying local pH changes in carbonate electrolyte during copper-catalysed [Formula: see text] electroreduction using in operando [Formula: see text] NMR.Sci Rep. 2022 May 18;12(1):8274. doi: 10.1038/s41598-022-12264-8. Sci Rep. 2022. PMID: 35585102 Free PMC article.
References
-
- Abbott TM, Buchanan GW, Kruus P, Lee KC. C nuclear magnetic resonance and Raman investigations of aqueous carbon dioxide systems. Can J Chem. 1982;60:1000–1006. doi: 10.1139/v82-149. - DOI
-
- Albert K, Dreher E-L, Straub H, Rieker A. Monitoring electrochemical reactions byC NMR spectroscopy. Magn Reson Chem. 1987;25:919–922. doi: 10.1002/mrc.1260251017. - DOI
-
- Bain AD, Cramer JA. Optimal NMR measurements for slow exchange in two-site and three-site systems. J Phys Chem. 1993;97:2884–2887. doi: 10.1021/j100114a010. - DOI
-
- Bañares MA. Operando methodology: combination of in situ spectroscopy and simultaneous activity measurements under catalytic reaction conditions. Catal Today. 2005;100:71–77. doi: 10.1016/j.cattod.2004.12.017. - DOI
-
- Baruch MF, Pander JE, White JL, Bocarsly AB. Mechanistic Insights into the Reduction of on Tin Electrodes using in Situ ATR-IR Spectroscopy. ACS Catalysis. 2015;5:3148–3156. doi: 10.1021/acscatal.5b00402. - DOI
LinkOut - more resources
Full Text Sources