[Preprint]. 2023 Oct 21:2023.10.20.23297329.
doi: 10.1101/2023.10.20.23297329.

Dynamics of SARS-CoV-2 Seroprevalence in a Large US population Over a Period of 12 Months

Affiliations

Dynamics of SARS-CoV-2 Seroprevalence in a Large US population Over a Period of 12 Months

Maria Karkanitsa et al. medRxiv. .

Abstract

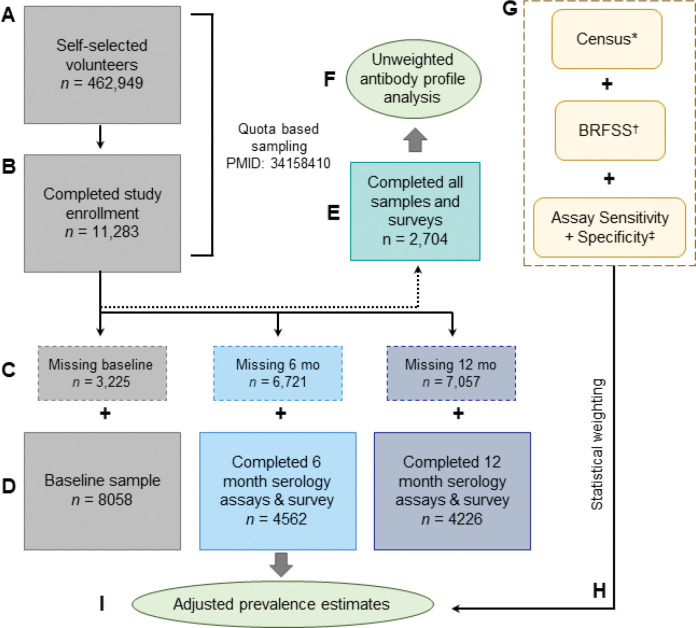
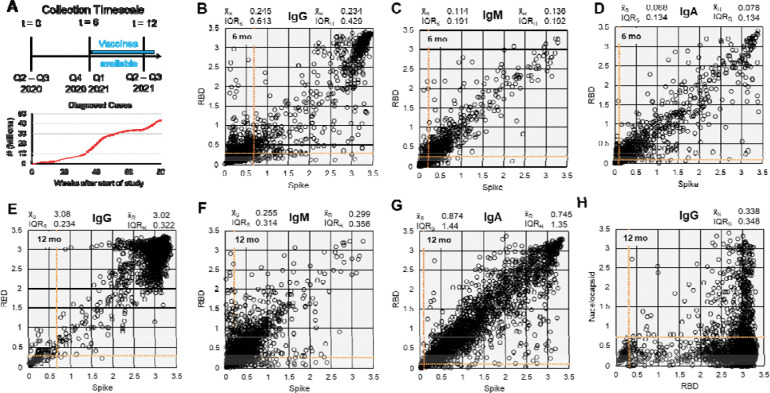
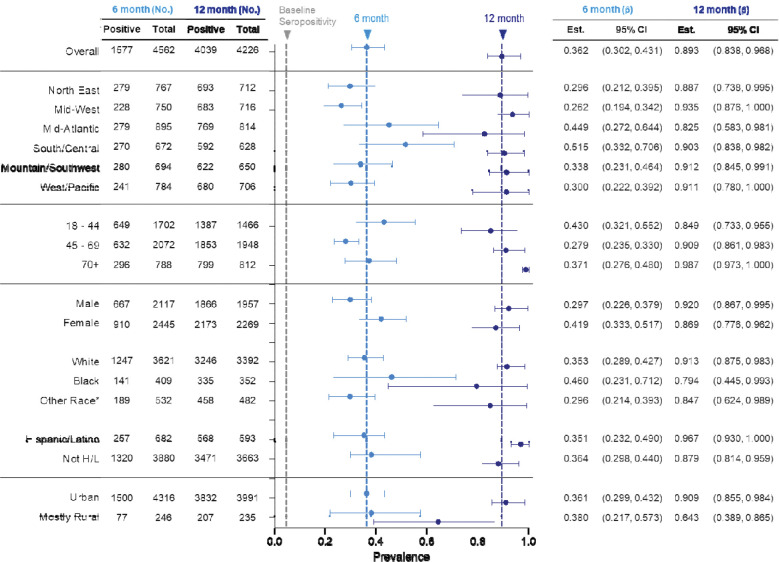
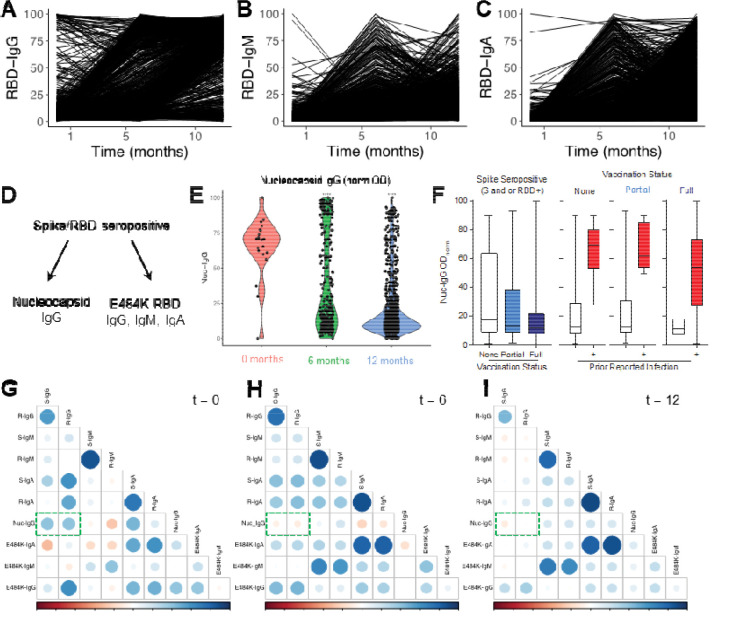
Due to a combination of asymptomatic or undiagnosed infections, the proportion of the United States population infected with SARS-CoV-2 was unclear from the beginning of the pandemic. We previously established a platform to screen for SARS-CoV-2 positivity across a representative proportion of the US population, from which we reported that almost 17 million Americans were estimated to have had undocumented infections in the Spring of 2020. Since then, vaccine rollout and prevalence of different SARS-CoV-2 variants have further altered seropositivity trends within the United States population. To explore the longitudinal impacts of the pandemic and vaccine responses on seropositivity, we re-enrolled participants from our baseline study in a 6- and 12- month follow-up study to develop a longitudinal antibody profile capable of representing seropositivity within the United States during a critical period just prior to and during the initiation of vaccine rollout. Initial measurements showed that, since July 2020, seropositivity elevated within this population from 4.8% at baseline to 36.2% and 89.3% at 6 and 12 months, respectively. We also evaluated nucleocapsid seropositivity and compared to spike seropositivity to identify trends in infection versus vaccination relative to baseline. These data serve as a window into a critical timeframe within the COVID-19 pandemic response and serve as a resource that could be used in subsequent respiratory illness outbreaks.


Figures

Figure 1 |
Figure 1 |. Study design and statistical workflow.
(A) Initial volunteer pool from self-selected volunteers. (B) Resulting 11,283 participants from quota-based sampling generated through Census and BRFSS as previously described (11). (C) Participants with missing samples or survey information removed from study. (D) Participants that returned full survey and samples for each timepoint. (E) Participants that returned samples and survey information for all timepoints tested (F) Exploratory endpoint of antibody profile in unweighted analysis (within study population). (G) Factors that were fed into weighting. (H) Statistical weighting applied to different seroprevalence estimates (I) Primary endpoint of seroprevalence within timepoints. * Census = US Census Data for 2018 . BRFSS = Behavioral Risk Factor Surveillance System (CDC) (46). Assay Sensitivity and Specificity as determined by prior studies (spike/RBD, (6, 11)) and evaluations of new antigens (Nucleocapsid, see Methods and Supplemental Figure 1).
Figure 2 |
Figure 2 |. Raw serology data for participants who submitted samples for all three time points.
(A) Sample collection timescale and cumulative count of diagnosed cases during the study period (data from CDC). Data distribution for 6-month timepoint of (B) IgG, (C) IgM, and (D) IgA antibodies against Spike (trimer) and RBD. (E-H) Data distribution for 12-month timepoint of (E) IgG, (F) IgM, and (G) IgA antibodies against Spike (trimer) and RBD, and (H) Nucleocapsid (C-terminal domain). Data displayed are raw optical density (OD) readings after background correction. Data are from 2,704 participants with samples from all 3 timepoints. x˜S = median OD Spike; x˜R = median OD for RBD; x˜N = median OD for Nucleocapsid; IQR = interquartile range (unweighted). Linear range of plate reader = OD 1 – 3. Orange = positivity threshold values per analyte.
Figure 3 |
Figure 3 |. Demographics of seropositivity at 6 and 12 months after initial testing.
No. = number, p^ = proportion, CI = confidence interval. Grey vertical dashed line = initial overall seroprevalence estimate at Q3 2020. Light blue vertical dashed line = 6-month overall seroprevalence estimate. Dark blue vertical dashed line = 12-month overall seroprevalence estimate. Data are weighted point estimates for prevalence and 95% confidence intervals. Initial testing (t = 0) data available via PMID: 34158410.
Figure 4 |
Figure 4 |. Socioeconomic factors associated with seroprevalence at 6 and 12 months after initial testing.
No. = number, p^ = proportion, CI = confidence interval. Grey vertical dashed line = initial overall seroprevalence estimate at Q3 2020. Light blue vertical dashed line = 6-month overall seroprevalence estimate. Dark blue vertical dashed line = 12-month overall seroprevalence estimate. Data are weighted point estimates for prevalence and 95% confidence intervals.
Figure 5 |
Figure 5 |. Health factors affecting seroprevalence at 6 and 12 months after initial testing.
No. = number, p^ = proportion, CI = confidence interval. Grey vertical dashed line = initial overall seroprevalence estimate at Q3 2020. Light blue vertical dashed line = 6-month overall seroprevalence estimate. Dark blue vertical dashed line = 12-month overall seroprevalence estimate. Data are weighted point estimates for prevalence and 95% confidence intervals.
Figure 6 |
Figure 6 |. Infection-induced nucleocapsid seroprevalence at commencement of vaccine rollout.
Seropositivity evaluation at 12 months after baseline testing (t = 0) after initial vaccine rollout in the United States. Red = Nucleocapsid IgG seropositivity. Dark blue = Spike/RBD IgG/IgM combined seroprevalence. *self-reported races including Asian American/Pacific Islander, Native American, and others had large confidence intervals and were combined into a single point estimate.
Figure 7 |
Figure 7 |. Antibody dynamics over a 12-month period at the beginning of the COVID-19 pandemic.
(A) RBD IgG (B) IgM, and (C) IgA normalized (0 – 100) optical density (OD) in participants that returned all three samples (n = 2,704). (D) Evaluation of expanded serologic panel on nucleocapsid (infection-induced antibody) and E484K mutated RBD (delta variant, immune evasive) (E) Nucleocapsid IgG normalized OD at 0 (pink), 6 (green), and 12 months (blue). (F) Normalized OD of Nucleocapsid IgG in spike seropositive unvaccinated and vaccinated participants. Vaccine dose ) (white) x˜ = 17.04, IQR = 53.50; dose I (light blue) x˜ = 13.32, IQR = 28.20; dose 2 (dark blue) x˜ = 11.58, IQR = 14.13. Fully vaccinated with no prior infection (light green) x˜ = 10.80, IQR = 10.62; with known prior infection (dark green) x˜ = 53.79, IQR = 45.32. (G-I) Correlation of antigen OD with other antigens at (G) 0 months, (H) 6 months, and (I) 12 months. Data are distribution or median (x˜) and interquartile range (IQR).

References

    1. W. H. Organization. (WHO, 2023).
    1. Msemburi W. et al. , The WHO estimates of excess mortality associated with the COVID-19 pandemic. Nature 613, 130–137 (2023). - PMC - PubMed
    1. Mercer T. R., Salit M., Testing at scale during the COVID-19 pandemic. Nature Reviews Genetics 22, 415–426 (2021). - PMC - PubMed
    1. Bobrovitz N. et al. , Lessons from a rapid systematic review of early SARS-CoV-2 serosurveys. MedRxiv, 2020.2005.2010.20097451 (2020).
    1. Duarte N. et al. , in Open forum infectious diseases. (Oxford University Press US, 2022), vol. 9, pp. ofab632.

Publication types