[Preprint]. 2023 Oct 26:2023.10.16.562104.
doi: 10.1101/2023.10.16.562104.

Immune landscape of tertiary lymphoid structures in hepatocellular carcinoma (HCC) treated with neoadjuvant immune checkpoint blockade

Affiliations

Immune landscape of tertiary lymphoid structures in hepatocellular carcinoma (HCC) treated with neoadjuvant immune checkpoint blockade

Daniel H Shu et al. bioRxiv. .

Abstract

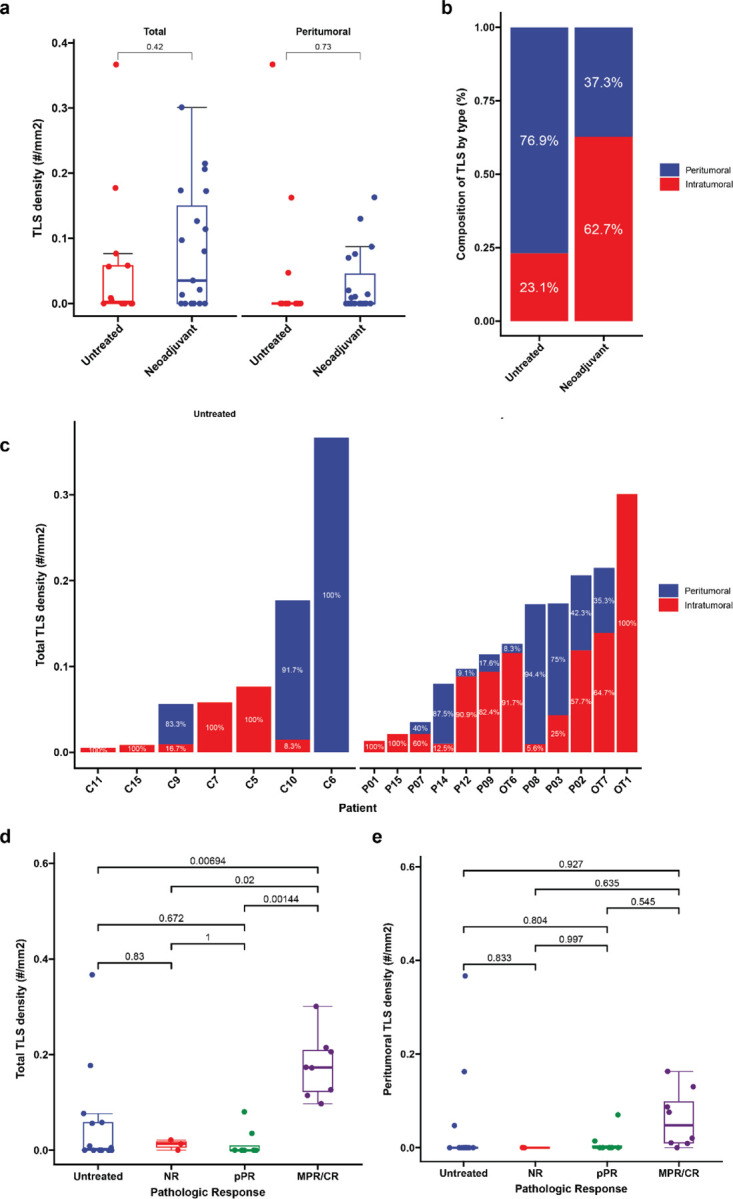
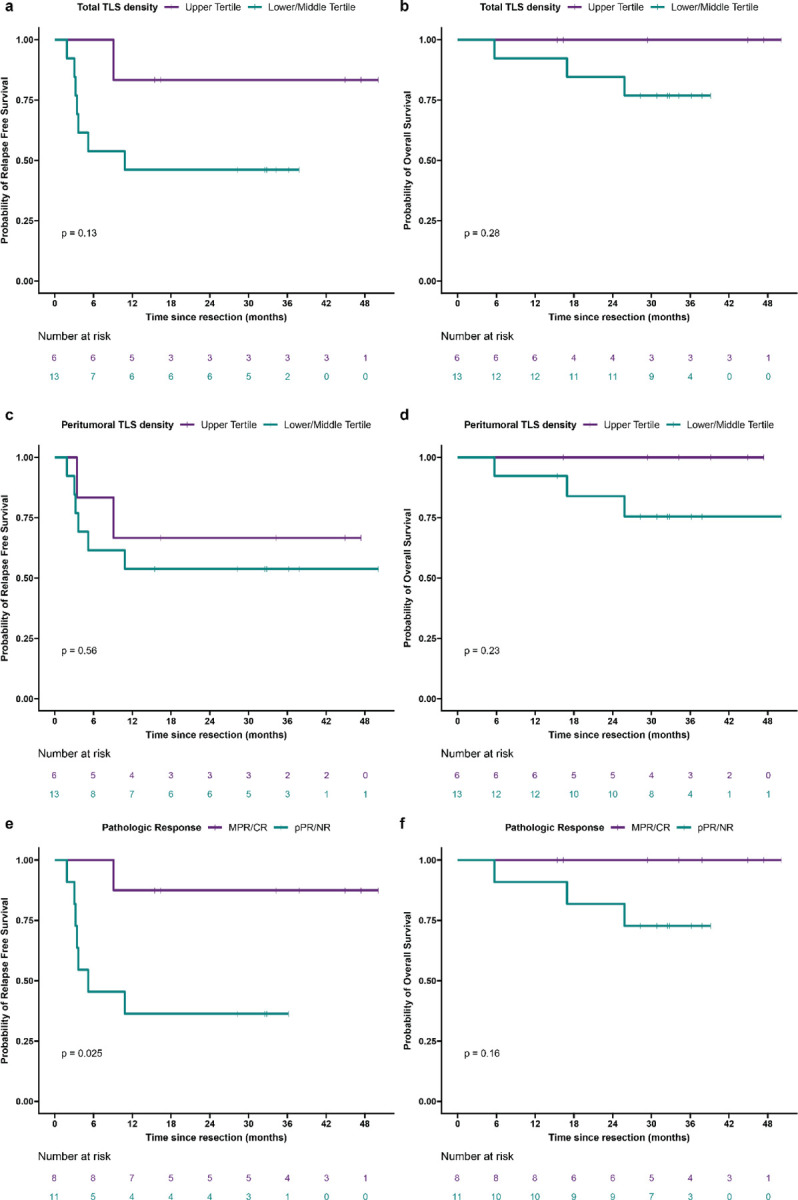
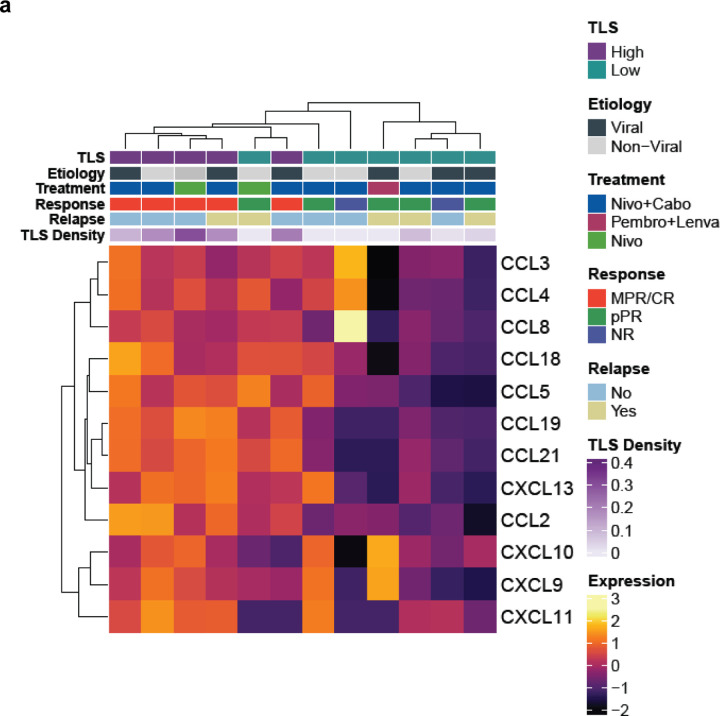
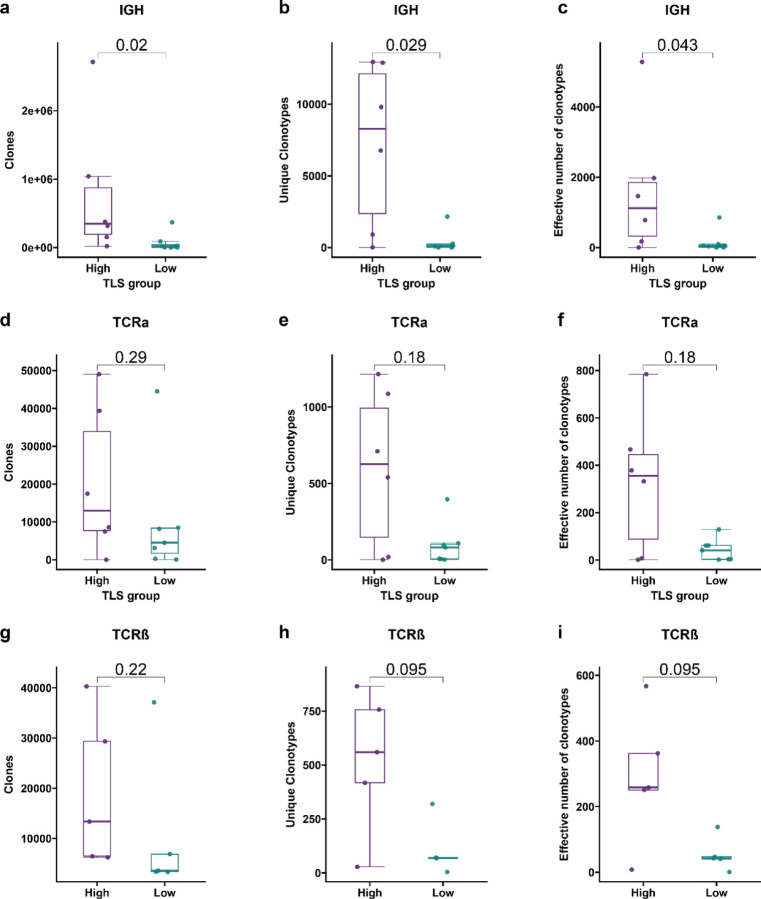
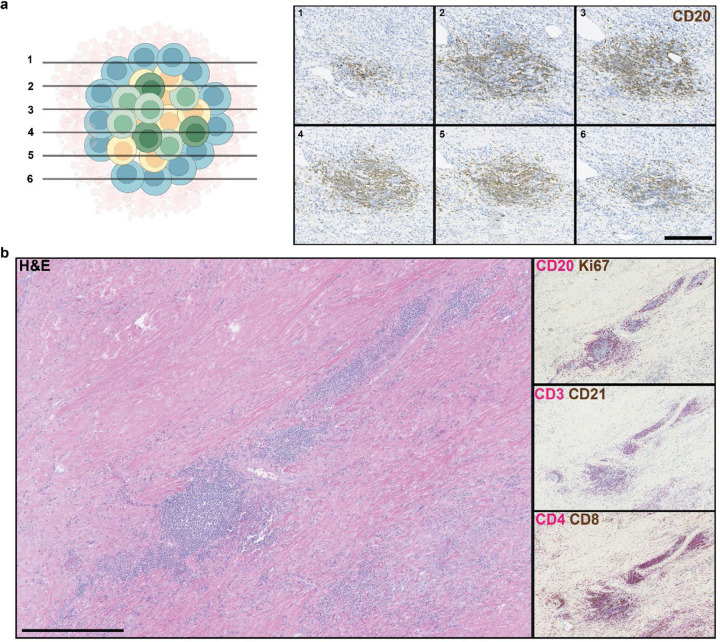
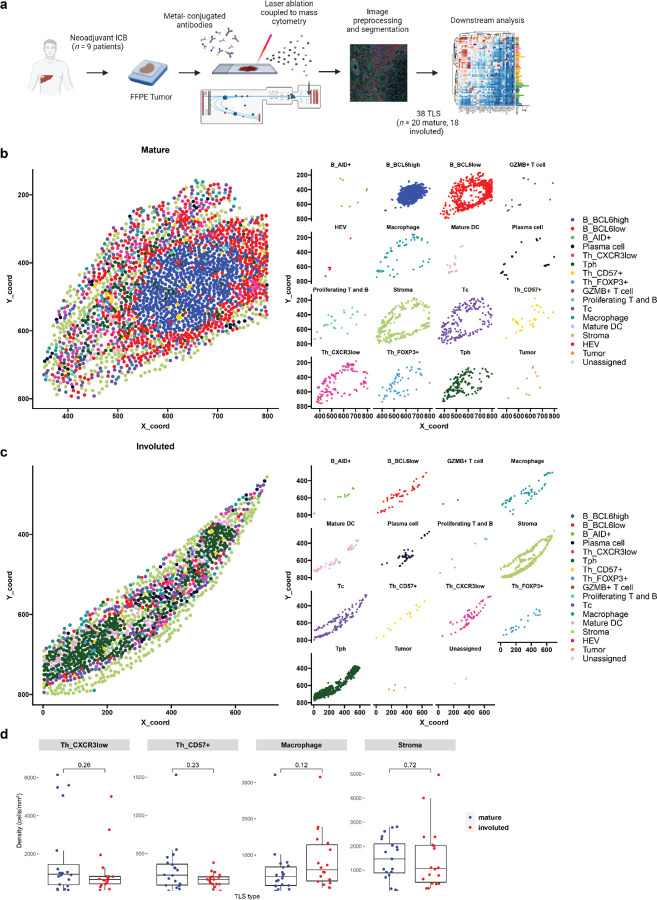
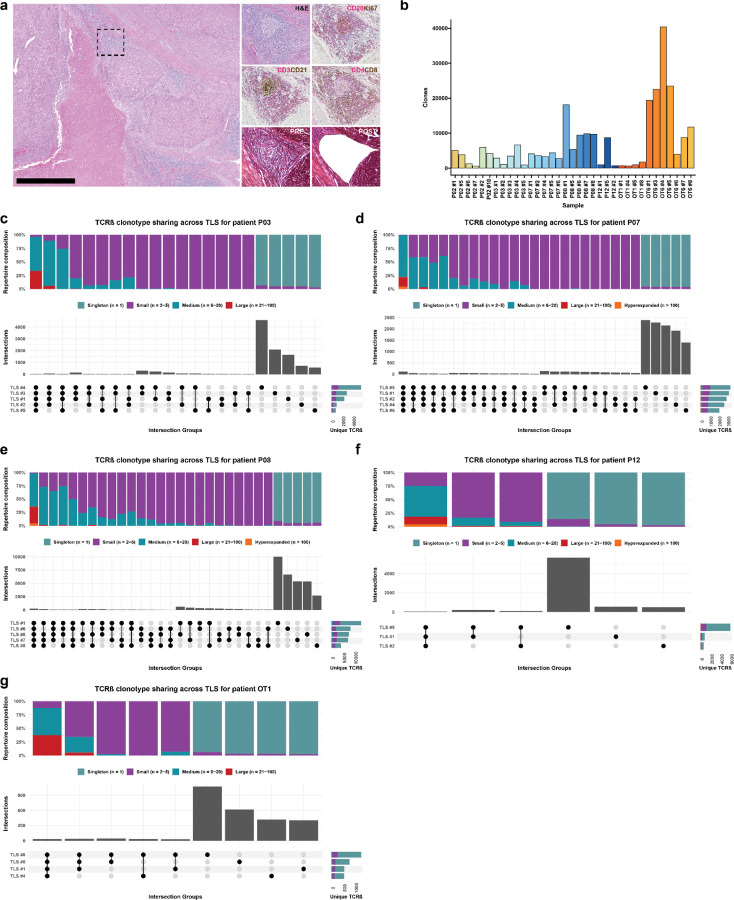
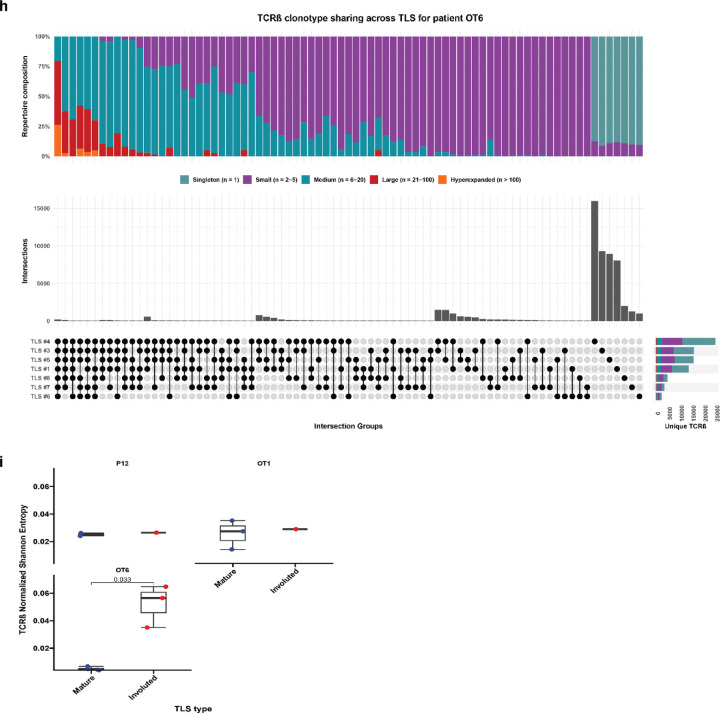
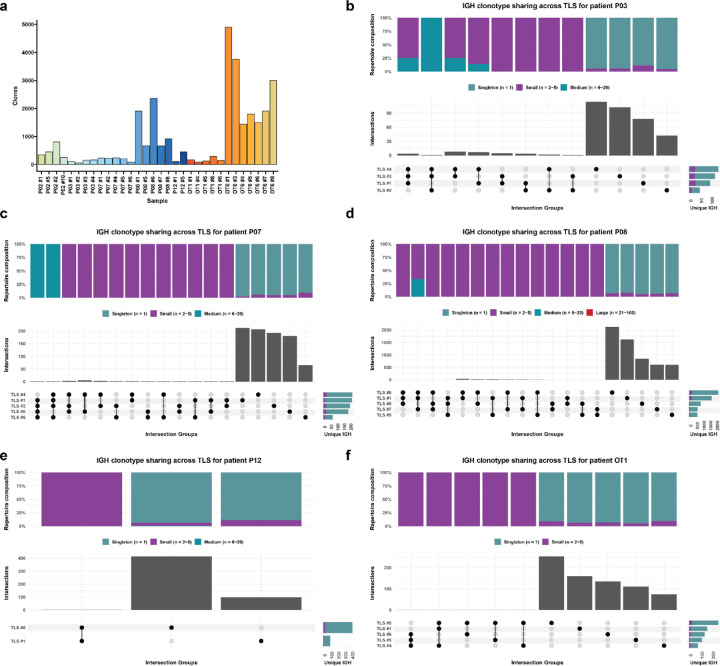
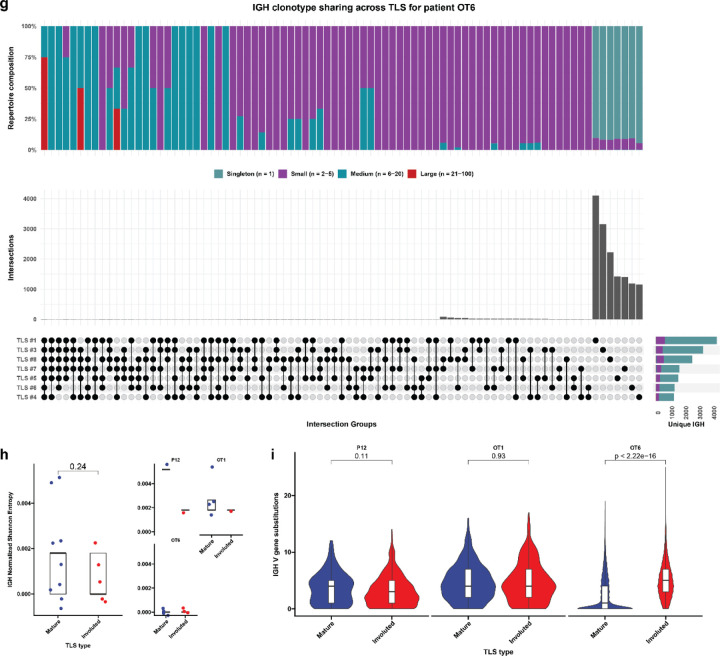
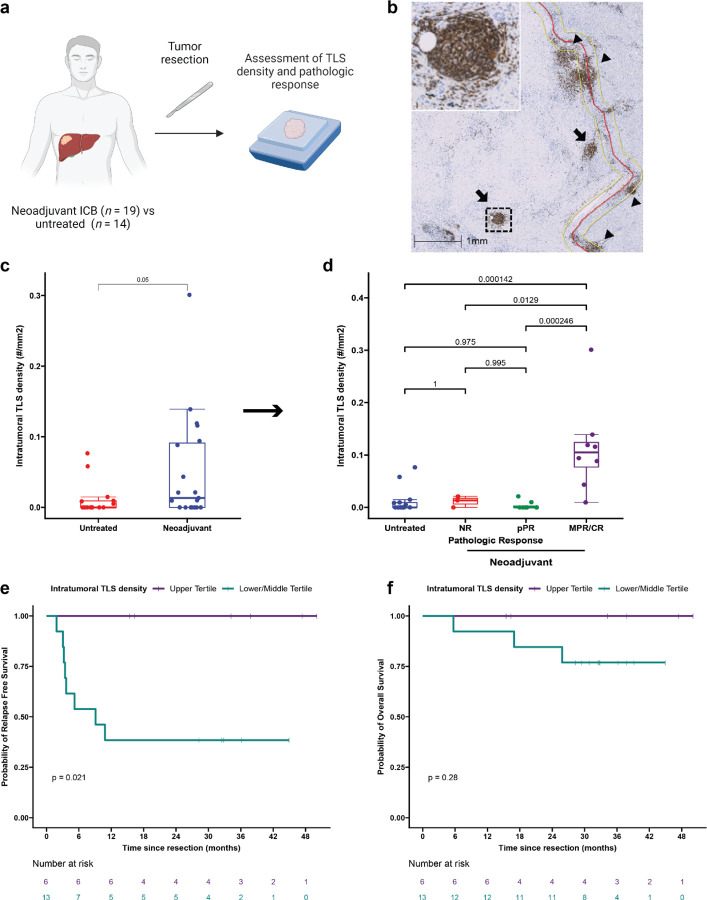
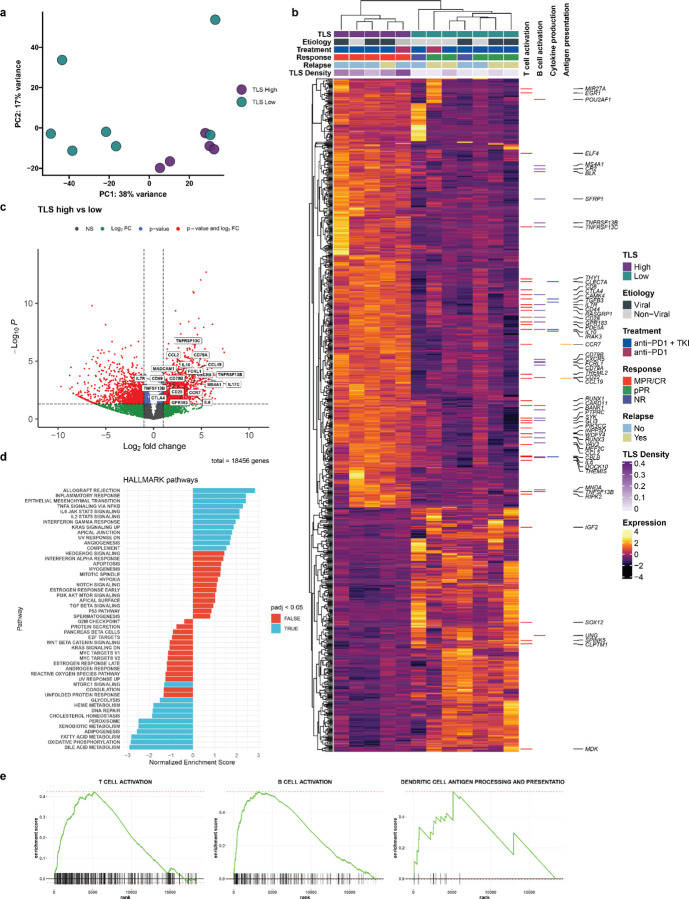
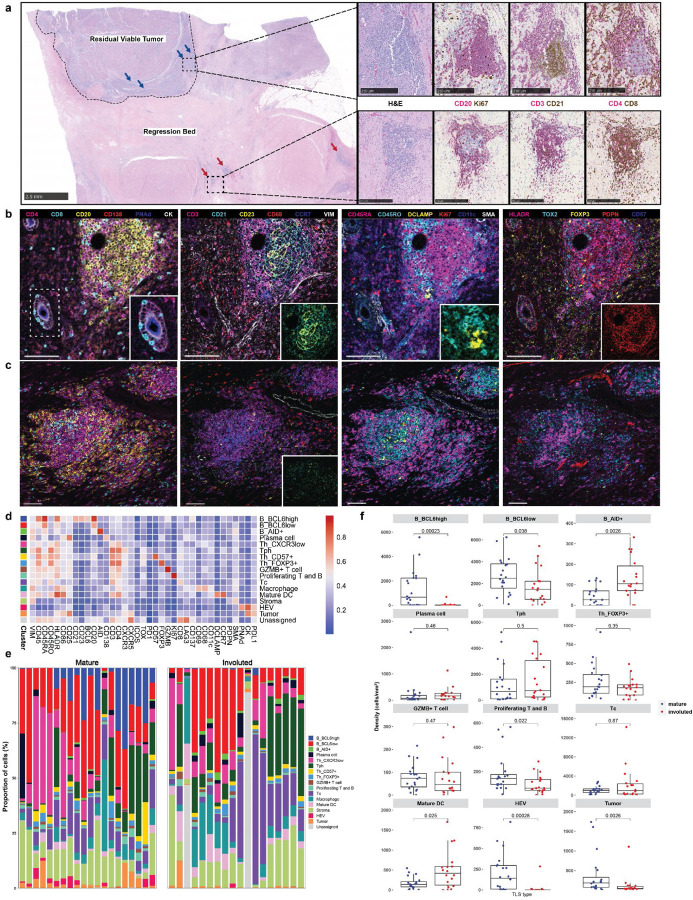
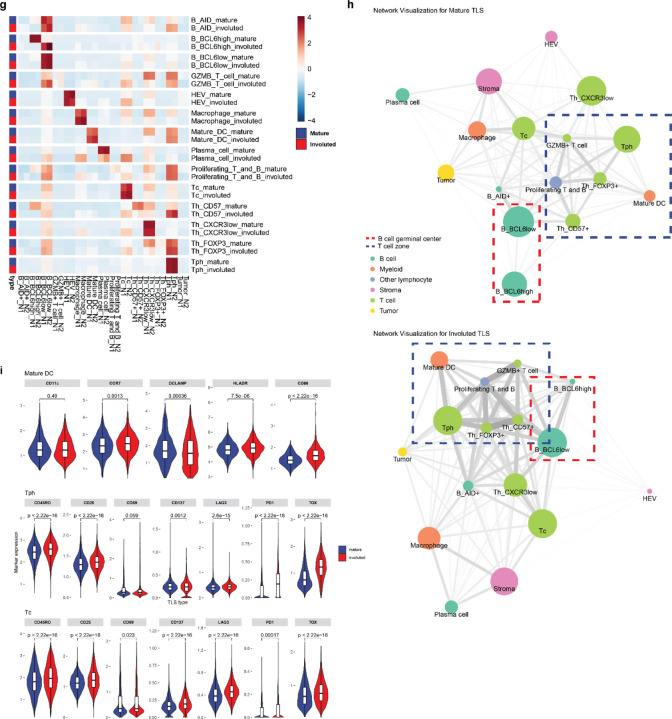
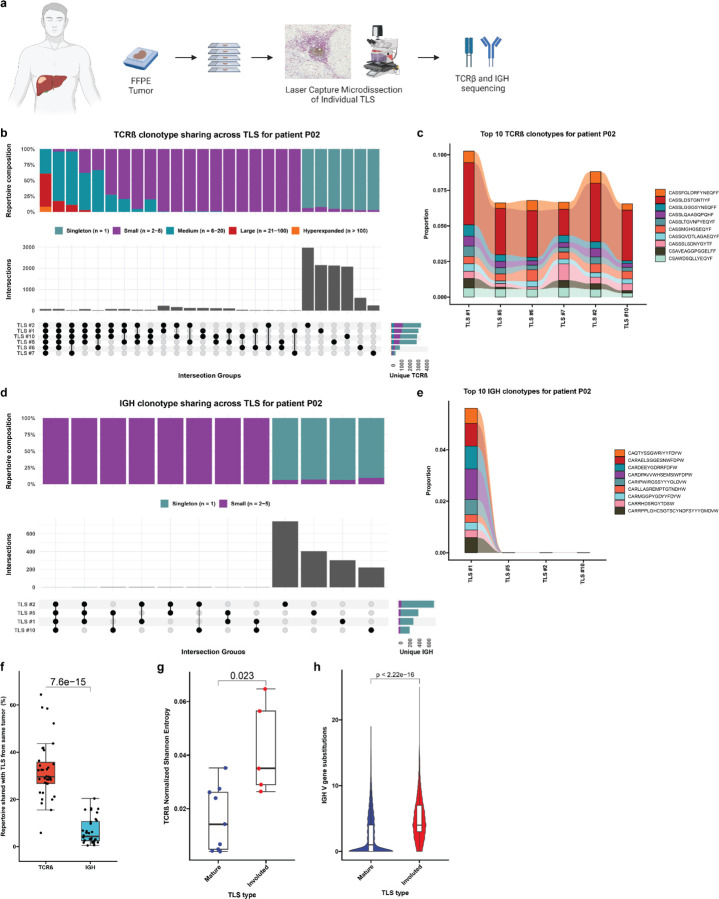
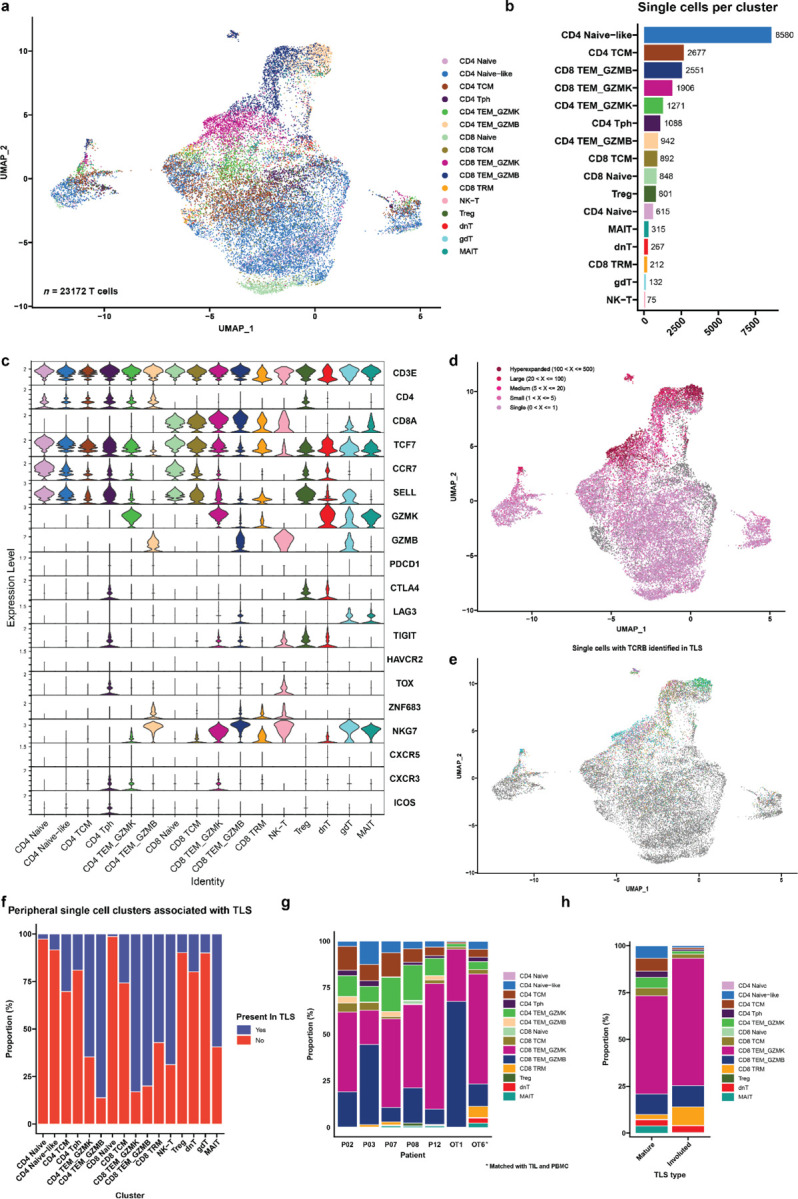
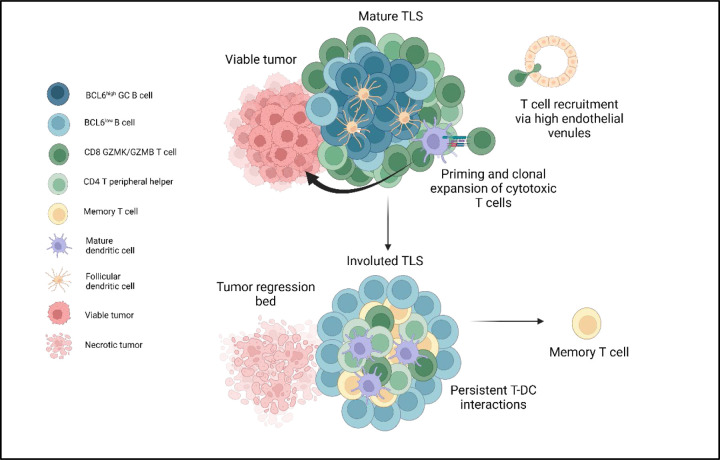
Neoadjuvant immunotherapy is thought to produce long-term remissions through induction of antitumor immune responses before removal of the primary tumor. Tertiary lymphoid structures (TLS), germinal center-like structures that can arise within tumors, may contribute to the establishment of immunological memory in this setting, but understanding of their role remains limited. Here, we investigated the contribution of TLS to antitumor immunity in hepatocellular carcinoma (HCC) treated with neoadjuvant immunotherapy. We found that neoadjuvant immunotherapy induced the formation of TLS, which were associated with superior pathologic response, improved relapse free survival, and expansion of the intratumoral T and B cell repertoire. While TLS in viable tumor displayed a highly active mature morphology, in areas of tumor regression we identified an involuted TLS morphology, which was characterized by dispersion of the B cell follicle and persistence of a T cell zone enriched for ongoing antigen presentation and T cell-mature dendritic cell interactions. Involuted TLS showed increased expression of T cell memory markers and expansion of CD8+ cytotoxic and tissue resident memory clonotypes. Collectively, these data reveal the circumstances of TLS dissolution and suggest a functional role for late-stage TLS as sites of T cell memory formation after elimination of viable tumor.

Keywords: hepatocellular carcinoma; imaging mass cytometry; immune checkpoint inhibitors; neoadjuvant immunotherapy; single cell RNA; single cell TCR; single cell multiomics; tertiary lymphoid structures.


Conflict of interest statement

Competing interests M.Y. reports grant/research support from Bristol-Myers Squibb, Incyte, Genentech (to Johns Hopkins) and honoraria from Genentech, Exelixis, Eisai, AstraZeneca, Replimune, Hepion, and equity in Adventris Pharmaceuticals. E.J.F is on the Scientific Advisory Board of Viosera/Reistance Bio, is a paid consultant for Merck and Mestag Therapeutics, and receives research funds from Abbvie. W.J.H. has received patent royalties from Rodeo/Amgen and is the recipient of grants from Sanofi, NeoTX, and CirclePharma. He has received speaking/travel honoraria from Exelixis and Standard BioTools. E.M.J. reports grant/research support from the Lustgarten Foundation, Break Through Cancer, Genentech, Bristol-Meyers Squibb; honoraria from Achilles, DragonFly, Parker Institute, Cancer Prevention and Research Institute of Texas, Surge, HDT Bio, Mestag Therapeutics, Medical Home Group; and equity in AbMeta Therapeutics and Adventris Pharmaceuticals. D.J.Z. reports grant/research support from Roche/Genentech.

Figures

Extended Data Fig. 1 |
Extended Data Fig. 1 |. TLS density in HCC tumors treated with neoadjuvant ICB and untreated controls.
a, Box-and-whisker plots showing total and peritumoral TLS density in patients with locally advanced HCC treated with neoadjuvant ICB (n = 19) and untreated controls (n = 14). b-c, Stacked barplots showing proportion of TLS comprised of peritumoral verus intratumoral TLS location neoadjuvant treated and untreated HCC tumors (b) and by patient (c). Labels indicate proportion of total TLS comprised of peritumoral or intratumoral TLS. In c, patients with no observed TLS are not shown. d-e, Box-and-whisker plots showing total (d) and peritumoral (e) TLS density in untreated (n = 14) and neoadjuvant treated tumors, divided according to pathologic response (n = 19). Statistical significance was determined by two-tailed t-test (a) and one-way ANOVA followed by Tukey’s honest significant difference (HSD) test (d and e).
Extended Data Fig. 2 |
Extended Data Fig. 2 |. Relapse free survival and overall survival in HCC cohort treated with neoadjuvant ICB, according to clinical covariates.
a—l, Kaplan-Meier curves showing relapse free survival and overall survival after surgical resection for HCC patients treated with neoadjuvant ICB (n = 19), according to total TLS density (a and b), peritumoral TLS density (c and d), pathologic response (e and f), sex (g and h), prior hepatitis C (HCV) infection (i and j), and prior hepatitis B (HBV) infection (k and l). Statistical significance was determined by log-rank test.
Extended Data Fig. 3 |
Extended Data Fig. 3 |. High TLS density after neoadjuvant ICB is associated with increased expression of the 12-chemokine TLS gene signature.
a, Heatmap showing expression of the 12-chemokine gene signature in tumors with high TLS density (n = 5) and low TLS density (n = 7). Annotation rows indicate TLS group, HCC etiology, neoadjuvant treatment, pathologic response, relapse, and TLS density.
Extended Data Fig. 4 |
Extended Data Fig. 4 |. HCC tumors with high TLS density after neoadjuvant ICB have expanded T and B cell repertoires compared to tumors with low TLS density.
Box-and-whisker plots showing the total clones, unique clonotypes, and effective number of clonotypes (i.e. true diversity index) for the immunoglobulin heavy chain (IGH) (a-c), TCRα (d-f), and TCRβ (g-i) repertoires of HCC tumors with high and low TLS density after neoadjuvant ICB. For each box-and-whisker plot, the horizontal bar indicates the median, the upper and lower limits of the boxes the interquartile range, and the ends of the whiskers 1.5 times the interquartile range. Statistical significance was determined by Wilcoxon rank sum test.
Extended Data Fig. 5 |
Extended Data Fig. 5 |. Involuted TLS in an HCC tumor with complete pathologic response after neoadjuvant ICB (OT7).
a, Serial FFPE sections of an involuted TLS stained with anti-CD20 antibody (brown). Numbered images indicate the order in which the sections were cut from the tissue block. Scale bar, 250 μm. b, Representative images of multiple involuted TLS (red arrows) stained with hematoxylin and eosin (H&E), anti-CD20 (magenta) and anti-Ki67 (brown) (right middle), anti-CD3 (magenta) and anti-CD21 (brown) (middle right), and anti-CD4 and anti-CD8 (bottom right).
Extended Data Fig. 6 |
Extended Data Fig. 6 |. Characterization of divergent TLS morphologies in viable tumor and tumor regression bed by imaging mass cytometry.
a, Imaging mass cytometry workflow. b-c, Dot plots showing representative mature (b) and involuted (c) TLS, colored according to cluster assignment of individual cells after cell segmentation. (d) Box-and-whisker plots showing cell cluster density in mature versus involuted TLS for CXCR3low CD4 T cells, CD57+ CD4 T cells, Macrophages, and Stroma. For each box-and-whisker plot, the horizontal bar indicates the median, the upper and lower limits of the boxes the interquartile range, and the ends of the whiskers 1.5 times the interquartile range. Statistical significance was determined by pairwise two sample Wilcoxon test (d).
Extended Data Fig. 7 |
Extended Data Fig. 7 |. TCRβ repertoire features of microdissected TLS.
a, Representative images showing method of identification and microdissection of individual TLS. Image on left shows HCC tumor stained with hematoxylin and eosin (H&E) at low magnification. Insets show higher magnification of staining with H&E, anti-CD20 (magenta) and anti-Ki67 (brown), anti-CD3 (magenta) and anti-CD21 (brown), anti-CD4 and anti-CD8 (bottom right), and corresponding pre- and post-microdissection images. Scale bar, 1mm. b, Barplot showing total clone count across all microdissected TLS. c-h, Representative upset plots showing overlap in TCRβ clonotypes across microdissected TLS from patients P03 (c), P07 (d), P08 (e), P12 (f), OT1 (g), and OT6 (h). For each upset plot, barplots in gray and row below indicate number of overlapping clonotypes between different combinations of TCRβ repertoires. Stacked barplots at top indicate repertoire composition of different groups of TCRβ and at bottom right indicate total number of unique TCRβ clonotypes identified in each TLS, colored according to clonal expansion. Intersections with fewer than 20 unique clonotypes are not shown. i, Dotplot showing TCRβ repertoire clonality (as determined by Normalized Shannon Entropy) for matched mature and involuted TLS. Statistical significance was determined by two-tailed t test (i).
Extended Data Fig. 8 |
Extended Data Fig. 8 |. IGH repertoire features of microdissected TLS.
a, Stacked barplot showing IGH repertoire composition across all TLS. b-f, Representative upset plots showing overlap in unique IGH clonotypes across microdissected TLS from patients P03 (b), P07 (c), P08 (d), P12 (e), OT1 (f), and OT7 (g). Bottom barplots and annotation row indicate number of overlapping clonotypes between different TLS repertoires. Top stacked barplots indicate clonal composition of overlapping (“public IGH”) and nonoverlapping (“Private IGH”). Bottom right stacked barplots indicate total number of unique IGH clonotypes identified at each TLS and overall clonal composition. h, Dotplot showing IGH repertoire clonality (as determined by Normalized Shannon Entropy) for microdissected TLS, according to TLS morphology. Statistical significance was determined by two-tailed t test (h and i).
Extended Data Fig. 9 |
Extended Data Fig. 9 |. TLS display a high degree of T cell repertoire overlap with pre- and post-treatment peripheral blood.
a-b, Barplots showing proportion of unique TCRβ clonotypes at each TLS that also identified in matched pre-treatment (a) and post-treatment (b) peripheral blood.
Extended Data Fig. 10 |
Extended Data Fig. 10 |. Single cell sequencing of post-treatment peripheral blood.
a, UMAPs showing gene expression of CD3E, CD4, CD8A, CCR7, SELL, GZMK, PDCD1, CXCL13, TOX, and ZNF683 across all single cells sequenced from post-treatment peripheral blood of 7 HCC patients treated with neoadjuvant ICB. b, Heatmap showing gene expression of the top 3 differentially expressed genes per cluster. Rows represent single genes and columns represent individual cells. Annotation bar indicates cluster identity, whether each cell had a sequenced TCR, the clonality of the TCR, and whether the TCR was identified in microdissected TLS from the same patient. Clusters were downsampled to 75 cells per cluster for visualization. c-e, Volcano plots showing differentially expressed genes in the CD8 TEM_GZMK (b),CD8 TEM_GZMB (c), and CD4 Tph (d) clusters compared to all other cells. Vertical dotted lines indicates a fold change of greater or less than 1.4 and horizontal line indicates a P value of 0.05. Labeled genes in c and d indicate genes with the highest differential expression. Labeled genes in e indicate genes known to be highly expressed in CD4 Tph.
Extended Data Fig. 11 |
Extended Data Fig. 11 |. Single cell sequencing of post-treatment TIL from patient OT6.
a, Uniform Manifold Approximation and Projection (UMAP) for 562 T cells identified by single cell RNA/TCR/BCR sequencing of CD3+CD19+ FACS-sorted tumor infiltrating lymphocytes. b, Barplot showing number of single cells per cluster. c, Violin plots showing expression of subset specific marker genes across clusters. d-e, UMAPs showing clonality of single cells with an associated T cell receptor sequence (d) and single cells with a TCRβ identified in microdissected TLS (e). f, Stacked barplot showing proportion of each single cell cluster identified in TLS. g, Heatmap showing gene expression of the top 3 differentially expressed genes per cluster. Rows represent single genes and columns represent individual cells. Annotation bar indicates cluster identity, whether each cell had a sequenced TCR, the clonality of the TCR, and whether the TCR was identified in microdissected TLS from the same patient. h-j, Volcano plots showing differentially expressed genes in the CD8 TEM_GZMK (h),CD8 TEM_GZMB (i), and CD4 Tph (j) clusters compared to all other cells. Vertical dotted lines indicates a fold change of greater or less than 1.4 and horizontal line indicates a P value of 0.05. k, Inferred transcriptional phenotype of the top 15 TCRβ clonotypes in mature and involuted TLS of patient OT6.
Extended Data Fig. 12 |
Extended Data Fig. 12 |. Cluster annotation of single cells with shared TCRβ in post-treatment peripheral blood and TIL (n = 16) from patient OT6.
a, Shared TCRβ identified in both PBMC and TIL for patient OT6. Rows indicate different TCRβ clonotype and columns provide the complementarity determining region 3 (CDR3) amino acid sequence and number of cells with the TCRβ CDR3 amino acid sequence in peripheral blood and TIL, respectively. b, Single cell cluster identities of shared TCRβ according to unique CDR3 and compartment where the TCR was identified. Piecharts are colored according to the cluster identities of all cells with the same TCRβ. The radius of each piechart is proportional to the total number of cells in which each TCRβ was identified (square root of n cells divided by eight).
Fig. 1 |
Fig. 1 |. Neoadjuvant ICB induces intratumoral TLS, which are associated with superior pathologic response and relapse free survival.
a, Workflow for TLS density analysis. b, Representative images of formalin fixed paraffin embedded (FFPE) HCC tumors stained with anti-CD20 antibody. Annotations indicate boundary between tumor/tumor regression bed and adjacent normal parenchyma (red), extension of boundary by 200 μm (yellow), intratumoral TLS (arrow), and peritumoral TLS (arrow head). Inset shows representative TLS at high magnification. Scale bar, 1mm. c, Box-and-whisker plots showing intratumoral TLS density in patients with locally advanced HCC treated with neoadjuvant ICB (n = 19) and untreated controls (n = 14). d, Boxplot-and-whisker plots showing intratumoral TLS density in untreated (n = 14) and neoadjuvant treated tumors, divided according to pathologic response (n = 19). For each box- and-whisker plot, the horizontal bar indicates the median, the upper and lower limits of the boxes the interquartile range, and the ends of the whiskers 1.5 times the interquartile range. e-f, Kaplan-Meier curves showing relapse free survival (e) and overall survival (f) for patients with HCC in the highest tertile (purple) compared to the middle and lowest tertiles (green) of intratumoral TLS density after neoadjuvant ICB. Statistical significance was determined by two-tailed t-test (c), one-way ANOVA followed by Tukey’s honest significant difference (HSD) test (d), and log-rank test (e and f).
Fig. 2 |
Fig. 2 |. High TLS density is associated with increased T and B cell activation in HCC treated with neoadjuvant ICB.
a, Principle component analysis of bulk RNA-sequencing of resected HCC tumors treated with neoadjuvant ICB (n = 12), divided according to TLS density relative to mean density of the neoadjuvant treatment group. b, Heatmap showing differentially expressed genes (DEG) with a log2 fold change > 1 and P < 0.05 between tumors with high (n = 5) and low (n = 7) TLS density. Annotation rows indicate TLS group, HCC etiology, treatment, response, relapse, and TLS density. Annotation columns at right identify DEG belonging to Gene Oncology Biological Pathways gene sets for T cell activation, B cell activation, Cytokine production, and Dendritic Cell Antigen Processing and Presentation. c, Volcano plot showing differentially expressed genes between tumors with high and low TLS density. Vertical dotted lines represents log2 fold change greater than or less than 1. Horizontal dotted line indicates adjusted P value of 0.05. 4 outlier genes are excluded from the plot for the purposes of visualization. d, Gene set enrichment analysis showing differentially enriched gene sets from the HALLMARK database between tumors with high and low TLS density. e, Barcode plots showing enrichment scores for the Gene Ontology Biological Pathways gene sets for T cell activation, B cell activation, and Dendritic Cell Antigen Processing and Presentation.
Fig. 3 |
Fig. 3 |. Identification of divergent TLS morphologies and cellular spatial relationships in viable tumor and tumor regression bed.
a, Representative formalin-fixed, paraffin embedded (FFPE) neoadjuvant ICB-treated tumor stained with hematoxylin and eosin (H&E) showing divergent TLS morphologies (“mature” and “involuted”) in viable residual viable tumor and regression bed. Dotted line shows boundary between residual viable tumor and regression bed. Blue arrows indicate mature TLS and red arrows indicate involuted TLS. Scale bar, 2.5mm. Higher magnification images of representative mature and involuted TLSare shown on right with serial sections stained with dual immunohistochemistry staining for CD20 (magenta) and Ki67 (brown), CD3 (magenta) and CD21 (brown), and CD4 (magenta) and CD8 (brown). Scale bars, 250 μm. b-c, Representative images of mature (b) and involuted (c) TLS obtained by imaging mass cytometry. Insets show higher magnification images of CD8+ T cells trafficking through high endothelial venules (b, far left), an extensive CD21+CD23+ follicular dendritic cell network in the mature morphology (b, middle left) compared to scant CD21+ and CD23+ in the involuted morphology (c, middle left), close interactions between T cells and DCLAMP+ mature dendritic cells in the T cell zone adjacent to the germinal center (b, middle right), and high podoplanin expression in the germinal center of the mature TLS (b, far right). Scale bars, 100 μm. d, Heatmap showing average IMC marker expression in annotated cell clusters identified from 90,344 single cells from 38 TLS (n = 20 mature, n = 18 involuted). e, Composition of mature and involuted TLS regions by cell type as a percentage of total cells per TLS. f, Box-and-whisker plots showing cell cluster density in mature versus involuted TLS. For each box-and-whisker plot, the horizontal bar indicates the median, the upper and lower limits of the boxes the interquartile range, and the ends of the whiskers 1.5 times the interquartile range. g, Nearest neighbor analysis with rows indicating individual clusters in mature and involuted TLS and columns corresopnding to first and second most common neighbors. h, Network analysis for cell clusters in mature and involuted TLS. Node size corresponds to the proportion of total cells for each TLS type occupied by each cluster. Edge length represents the shortest distance between cell clusters and thickness corresponds to the number of measurements for each TLS type. i, Box and violin plots showing expression of mature dendritic cell markers (CD11c, CCR7, DCLAMP, HLADR, and CD86) in the mature DC cluster and markers of T cell activation and exhaustion (CD45RO, CD25, CD69, CD137, LAG3, PD1, and TOX) in the T peripheral helper (Tph) and cytotoxic T cell (Tc) clusters, by TLS morphology. Statistical significance was determined by pairwise two sample Wilcoxon test (f and g).
Fig. 4 |
Fig. 4 |. Expanded T cell clonotypes are shared across TLS within a tumor, while B cell repertoires of individual TLS are highly distinct.
a, Workflow for T and B cell repertoire profiling of microdissected TLS (n = 30 mature and 5 involuted) from 7 patients. b and d, Upset plots showing overlap in unique TCRβ (b) and IGH (d) clonotypes across microdissected TLS from the same patient (P02). Barplots in gray and annotation row indicate distinct groups of clonotypes shared between different TLS. Top stacked barplots indicate composition of groups according to clonal expansion. Bottom right stacked barplots indicate total number of unique TCRβ or IGH clonotypes identified at each TLS according to degree of clonal expansion. c and e, Alluvial plots tracking the top 10 TCRβ (c) or IGH (e) clonotypes from TLS # 1 of patient P02 across all TLS microdissected from the patient’s tumor. f, Box-and-whisker plot comparing the percentage of the TCRβ or IGH repertoire of each TLS that is shared with other TLS from the same tumor. g, Box- and-whisker plots comparing TCRβ clonality (as determined by Normalized Shannon Entropy) in mature and involuted TLS microdissected from patients P12, OT1, and OT6. Each point represents the TCRβ of an individual TLS. h, Violin plots comparing number of somatic hypermutations in IGH of mature and involuted TLS microdissected from patients P12, OT1, and OT6. Individual data points (not shown) represent individual IGH sequences. Statistical significance was determined by two-tailed t test (f-h).
Fig. 5 |
Fig. 5 |. Cytotoxic granzyme K and granzyme B-expressing CD8 T cells are highly represented in TLS.
a, Uniform Manifold Approximation and Projection (UMAP) of 23,172 T cells identified by single cell RNA/TCR/BCR sequencing of CD3+CD19+ FACS-sorted peripheral blood from HCC patients treated with neoadjuvant ICB (n = 7). b, Barplot showing number of single cells per cluster. c, Violin plots showing expression of subset specific marker genes across clusters. d-e, UMAPs showing clonality of single cells with an associated T cell receptor sequence (d) and single cells with a TCRβ identified in microdissected TLS (e). f, Stacked barplot showing proportion of each single cell cluster identified in TLS. g, Inferred transcriptional phenotype of TCRβ clonotypes in microdissected TLS with a matching TCRβ in single cell sequencing of post-treatment peripheral blood (n = 7) or tumor infiltrating lymphocytes (n = 1). h, Inferred transcriptional phenotype of TCRβ clonotypes in mature and resolving TLS of patient OT6.
Fig. 6 |
Fig. 6 |. TLS structure and function in viable tumor and tumor regression bed in tumors treated with neoadjuvant checkpoint blockade.
Mature TLS in viable tumor display a highly organized germinal center with close interactions between germinal center B cells and CD21+ follicular dendritic cells, a T cell zone characterized by CD4+ T peripheral helper cells in close proximity to mature dendritic cells, and cytotoxic CD8+ T cells trafficking to the tumor via high endothelial venules. In areas of tumor regression, an involuted TLS morphology is found which displays dissolution of the B cell germinal center and persistence of Tph-DC interactions in the T cell zone, increased T cell memory marker expression, and clonal expansion of cytotoxic and tissue resident memory CD8+ T cells.

References

    1. Garon EB, Hellmann MD, Rizvi NA, et al. Five-Year Overall Survival for Patients With Advanced Non‒Small-Cell Lung Cancer Treated With Pembrolizumab: Results From the Phase I KEYNOTE-001 Study. J Clin Oncol Off J Am Soc Clin Oncol. 2019;37(28):2518–2527. doi:10.1200/JCO.19.00934 - DOI - PMC - PubMed
    1. Larkin J, Chiarion-Sileni V, Gonzalez R, et al. Five-Year Survival with Combined Nivolumab and Ipilimumab in Advanced Melanoma. N Engl J Med. Published online September 27, 2019. doi:10.1056/NEJMoa1910836 - DOI - PubMed
    1. Patel SP, Othus M, Chen Y, et al. Neoadjuvant–Adjuvant or Adjuvant-Only Pembrolizumab in Advanced Melanoma. N Engl J Med. 2023;388(9):813–823. doi:10.1056/NEJMoa2211437 - DOI - PMC - PubMed
    1. Topalian SL, Forde PM, Emens LA, Yarchoan M, Smith KN, Pardoll DM. Neoadjuvant immune checkpoint blockade: A window of opportunity to advance cancer immunotherapy. Cancer Cell. Published online August 17, 2023. doi:10.1016/j.ccell.2023.07.011 - DOI - PMC - PubMed
    1. Liu J, Blake SJ, Yong MCR, et al. Improved Efficacy of Neoadjuvant Compared to Adjuvant Immunotherapy to Eradicate Metastatic Disease. Cancer Discov. 2016;6(12):1382–1399. doi:10.1158/2159-8290.CD-16-0577 - DOI - PubMed

Publication types