[Preprint]. 2023 Oct 30:2023.10.15.562426.
doi: 10.1101/2023.10.15.562426.

Fine-grained descending control of steering in walking Drosophila

Affiliations

Fine-grained descending control of steering in walking Drosophila

Helen H Yang et al. bioRxiv. .

Update in

Abstract

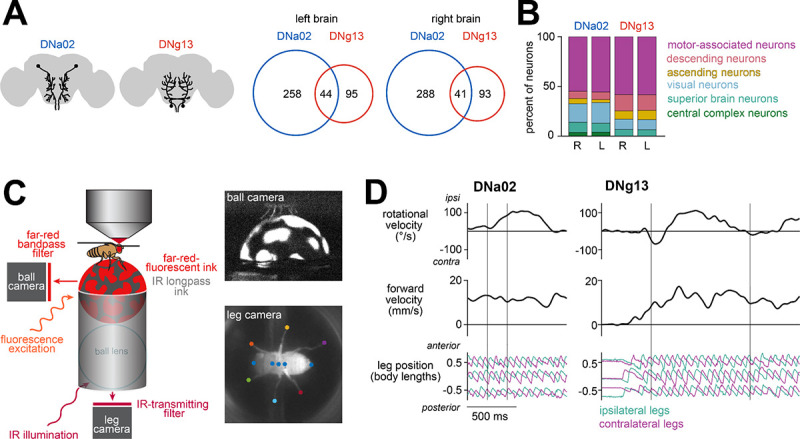
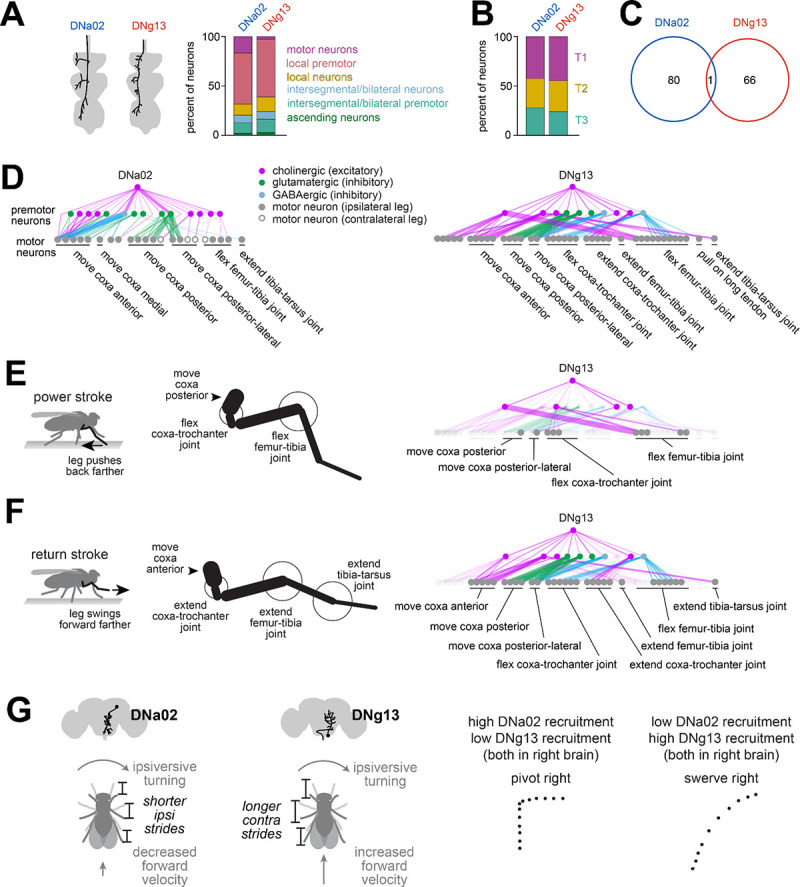
Locomotion involves rhythmic limb movement patterns that originate in circuits outside the brain. Purposeful locomotion requires descending commands from the brain, but we do not understand how these commands are structured. Here we investigate this issue, focusing on the control of steering in walking Drosophila. First, we describe different limb "gestures" associated with different steering maneuvers. Next, we identify a set of descending neurons whose activity predicts steering. Focusing on two descending cell types downstream from distinct brain networks, we show that they evoke specific limb gestures: one lengthens strides on the outside of a turn, while the other attenuates strides on the inside of a turn. Notably, a single descending neuron can have opposite effects during different locomotor rhythm phases, and we identify networks positioned to implement this phase-specific gating. Together, our results show how purposeful locomotion emerges from brain cells that drive specific, coordinated modulations of low-level patterns.


Conflict of interest statement

Declaration of interests The authors declare no competing interests.

Figures

Figure 1:
Figure 1:. Different steering maneuvers use different leg gestures.
(A) During the power stroke, the leg pushes backward. During the return stroke, the leg swings forward to a new position. Schematics viewed from below show each leg at the endpoint of its power and return stroke. Stride length is the difference between the two endpoints in the anterior-posterior axis. (B) Left: an example steering bout, showing the path of the fly’s body (gray) and the positions of the leg tips as they touch down at the end of the return stroke of each step. Right: the fly’s rotational and forward body velocity during the bout as well as the anterior-posterior position of the leg tips in body-centric coordinates. The arrow highlights the stride length changes at the peak of the turn. (C) When flies rotate, stride length decreases for the inside legs, while increasing for the outside legs. For each turning bout, we measured the bout’s peak rotational velocity, as well as the stride length for the step that occurred at that peak. Stride lengths are expressed as the change from the mean when the fly was not turning. Stride length varies significantly with rotational velocity for both outside and inside legs (two-way ANOVA, rotational velocity and legs as factors, rotational velocity: p=4.87×10−77; interaction between rotational velocity and leg identity: p=0); post-hoc Tukey-Kramer tests show significant changes for every leg at all but the lowest rotational velocity (see Table S1)), n = 138 (55), 454 (68), 434 (68), and 151 (50) bouts (flies) for 20–50, 50–100, 100–150, and 150–200 °/s, respectively. * marks legs with significant changes during turning (D) Top: paths for example steering bouts, corresponding to a pivot and a swerve (downsampled to 100 positions/s). Bottom: rotational and forward velocity over time for these examples. (E) Pivots and swerves produce different changes in stride length (two-way ANOVA with legs and pivot/swerve as factors: pivot/swerve p=6.11×10⁻³¹; leg identity p=4.96×10−66; interaction: p=0.738, n = 389 (64) and 155 (53) bouts (flies), respectively). Post-hoc Tukey-Kramer tests show a significant difference between pivots and swerves for every leg (see Table S1).
Figure 2:
Figure 2:. Many descending neuron types correlate with the body’s rotational velocity.
DNa01, DNa02, DNb05, DNb06, and DNg13 are DN types represented by a single right-left cell pair; here we use calcium imaging to show that all 5 are related to rotational velocity. Figure S2 shows data for other DN types. (A) Left: schematic of the left cell for each DN type. Right: in example flies, right-left difference in ΔF/F, shown as a heatmap over rotational and forward velocity bins. We allocated each time point to a bin (excluding times when the fly was not walking) and took the mean right-left difference in ΔF/F within each bin. Gray bins had <20 time points. (B) Rotational velocity is related to the right-left difference in ΔF/F. We allocated each time point to a velocity bin (excluding times when the fly was not walking) and took the mean right-left difference in ΔF/F within each bin. Individual flies are in gray, with the mean across flies in black. The mean ± SEM across flies of the correlation between rotational velocity and ΔF/F is shown. For (B-D), n (flies) is 10 (DNa01), 8 (DNa02), 7 (DNb05), 7 (DNb06), 5 (DNg13). (C) Filters describing the mean rotational velocity around an impulse change in the right-left difference in ΔF/F. Here and in (D) we didnot exclude times when the fly was not walking. (D) Filters describing the mean right-left difference in ΔF/F around an impulse change in rotational velocity.
Figure 3:
Figure 3:. DNa02 and DNg13 have distinct inputs in the brain and distinct effects on leg movement.
(A) Left: Schematic of the left and right DNa02 and DNg13 cells in the brain. Right: Analysis of the full brain connectome shows that DNa02 and DNg13 neurons in the same hemisphere share relatively few presynaptic cells (numbers are cell counts). (B) Stacked bar charts summarize the cells presynaptic to each DN in the brain, divided into 6 categories, and expressed as a percentage of all presynaptic neurons (again, in the brain). (C) The fly walks on a spherical treadmill coated with IR long-pass ink and painted with spots of far-red fluorescent ink. The camera used for tracking the sphere (and thus the fly’s fictive body velocity) captures only far-red light, making the ball appear black with white spots (top). The camera used for tracking the legs captures only IR light; because the sphere is transparent to IR light, it is not visible in this view (bottom). The key points, as tracked by APT, are marked. (D) Example trials for unilateral optogenetic stimulation of DNa02 with CsChrimson (left) and unilateral depolarization of DNg13 by current injection (right). Thin lines mark the onset and offset of stimulation.
Figure 4:
Figure 4:. Different descending neurons drive distinctive leg gestures.
(A) Difference in rotational and forward velocity during unilateral optogenetic stimulation of DNa02 with CsChrimson (CsCh). Dots are individual flies, and line is the mean across flies. Ipsiversive (positive) and contraversive (negative) are relative to the side of the soma of the CsCh+ cell; for no CsCh controls, ipsiversive and contraversive were randomly assigned for each fly. The effect of optogenetic stimulation is significant for rotational velocity (p=0.00141) but not forward velocity (p=0.802; two-sample t-tests, n=8 flies (CsCh+) and n=7 flies (no CsCh)). * marks changes upon stimulation. (B) Unilateral optogenetic stimulation of DNa02 produces leg-specific changes in stride length (two-way ANOVA with CsCh expression and legs as factors, ±CsCh: p=2.85×10⁻⁴; interaction between leg identity and ±CsCh: p=8.78×10⁻⁶, with significant effects for ipsilateral but not contralateral legs in post-hoc tests, as shown in Table S1). (C) Unilateral optogenetic stimulation of DNa02 shortens the return stroke but not the power stroke (return stroke: p-values for two-wayANOVA are 4.23×10⁻⁶ (±CsCh), 2.46×10⁻⁸ (interaction between leg identity and ±CsCh), with significant effects in ipsilateral but not contralateral legs in post-hoc tests (Table S1). power stroke: two-way ANOVA p=0.807 (±CsCh) and p=0.0354 (interaction between leg identity and ±CsCh)). (D) The effects of DNg13 current injection are significant for rotational velocity (hyperpolarization p=0.00257, depolarization p=0.0404) but not forward velocity (hyperpolarization p=0.828, depolarization p=0.695; two-sample t-tests comparing against no stimulation periods, n=6 flies). Lines connect data points from the same fly. (E) DNg13 current injection produces leg-specific changes in stride length (3-way ANOVA with depolarization/hyperpolarization, leg identity, and fly identity as factors: depolarization/hyperpolarization p=1.49×10⁻⁴, interaction between leg identity and depol/hyperpol p=0.000501), with significant effects in contralateral but not ipsilateral legs in post-hoc tests (Table S1). (F) DNg13 current injection affects stride length during both phases of the stride cycle in the contralateral legs (return stroke: 3-wayANOVA depolarization/hyperpolarization, leg identity, and fly identity as factors, without interaction, using contralateral legs only, effect of depolarization/hyperpolarization is significant at p=7.84×10⁻⁴; power stroke: same with p=5.28×10⁻⁴). (G) Schematic summarizing the effects of stimulating each DN type.
Figure 5:
Figure 5:. Descending neuron activity is correlated with specific leg gestures.
(A) Example recordings. DNa02 spiking increases just before a decrease in ipsilateral stride length, accompanied by shortening of the ipsilateral return stroke and ipsiversive turning (arrow). DNg13 spiking increases just before an increase in contralateral stride length and ipsiversive turning (arrow). (B) Rotational velocity is related to DNa02 and DNg13 spike rate (normalized per cell; see Method details). Positive rotational velocity is ipsiversive turning. Thin lines are mean values for individual flies; thick lines are averages across flies (DNa02: n=4 cells in 4 flies; DNg13: n=9 cells in 9 flies). The mean ± SEM across flies of the correlation between rotational velocity and spike rate is also shown. (C) Same but for leg movement parameters that change with DNa02 optogenetic stimulation (ipsilateral stride length and ipsilateral return stroke position). (D) Same but for leg movement parameters that change with DNg13 current injection (contralateral stride length, contralateral return stroke position, and contralateral power stroke position). (E) The correlation between ipsilateral stride length and normalized DNa02 spike rate only emerges when the fly is turning (defined as rotational speed >25°/s). Summary plot shows the Pearson correlation coefficient between ipsilateral stride length and normalized DNa02 spike rate in both conditions; here pairs of connected dots are flies, and horizontal lines are the means across flies (paired t-test on difference in correlation coefficients, turning versus not turning, p=0.0109). (F) Same as (E) but showing that the correlation between ipsilateral return stroke position and normalized DNa02 firing rate only emerges when the fly is turning (paired t-test on difference in correlation coefficients, turning versus not turning, p=0.00836). (G) Same but analyzing the correlation between contralateral stride length and normalized DNg13 spike rate (paired t-test on difference in correlation coefficients, turning versus not-turning, p=0.00767).
Figure 6:
Figure 6:. Different descending neurons are recruited at different moments within a steering maneuver.
(A) Left: Filters describing the mean change in rotational velocity around an impulse change in DN firing rate. Thin lines are individual flies, and thick lines are the means across flies (n=4 cells in 4 flies for DNa02, 5 cells in 5 flies for DNg13). Stripchart shows time of the filter peak; dots are individual flies, and horizontal lines are the means across flies (one-sample t-test, time of peak different from 0, DNa02: p=2.85×10⁻⁴, DNg13: p=5.36×10⁻⁴). Right: Filters describing the mean change in stride length around an impulse change in DN firing rate. Stride length is measured in ipsilateral legs for DNa02 and contralateral legs for DNg13. For ease of comparison, the filter for DNa02 was multiplied by −1. Stripchart shows time of the filter peak (one-sample t-test, time of peak different from 0, DNa02: p=0.00250, DNg13: p=7.24×10⁻⁴). (B) Autocorrelation of DNa02 and DNg13 spike rate during walking (n=4 cells in 4 flies for DNa02, 9 cells in 9 flies for DNg13). Stripchart shows the width of the autocorrelation function (full-width at half-maximum). The two DNs are significantly different (two-sample t-test, p=0.00520). (C) Left: Changes in stride length over time for each pair of legs during turning bouts in freely walking flies. Turning bouts are aligned to the peak in rotational velocity (n=818 turning bouts in 73 flies). Right: The full width at half-maximum for the change in stride length over time. The duration of ipsilateral and contralateral changes in stride length are significantly different (paired t-test for each pair of legs, front: p=1.31×10−76; mid: p=8.08×10−84; hind: p=4.95×10−93). (D) Timing of DNa02 and DNg13 spikes relative to the stride cycle 100 ms prior (n=4 cells in 4 flies for DNa02, 9 cells in 9 flies for DNg13). The stride cycle is expressed relative to the phase of the ipsilateral (DNa02)/contralateral (DNg13) mid leg, and the binned spike counts are normalized to the time spent in each phase and then expressed as the difference from the mean.
Figure 7:
Figure 7:. Steering descending neurons have specialized outputs.
(A) Schematic: morphology of the left DNa02 and the right DNg13 axons in the ventral nerve cord. Here, left and right refer to soma locations in the brain; both of these cells send axons to the left side of the cord. Stacked bar charts summarize the cells postsynaptic to each DN in the leg neuromeres of the cord, divided into 6 categories. Note that DNa02 also targets neurons in the neuropils associated with the wings, halteres, and neck, and those are excluded from this plot. (B) The distribution across the three leg neuromeres (T1, T2, T3) of the postsynaptic neurons. Intersegmental neurons are assigned to a segment based on their cell body locations. (C) DNa02 and DNg13 axons projecting to the left side of the cord share almost no postsynaptic cells (numbers are cell counts). (D) Monosynaptic and disynaptic connections between DNa02/DNg13 axons projecting to the left side of the cord and motor neurons controlling the front legs. Note that the DNa02 and DNg13 graphs are plotted separately, and thus some motor neurons are repeated. Motor neurons are labeled according to their inferred effect, with unlabeled motor neurons having unknown effects. Motor neurons are sorted in proximal-to-distal order of their target muscles. Neurotransmitter labels reflect machine vision predictions (for DNs) or hemilineage membership,, (for premotor cells). Line thickness is proportional to the number of synapses. Connections between premotor neurons are not shown. (E) Left: limb kinematics during the power stroke. Right: cells downstream from DNg13 that can potentially explain its ability to increase stride length during the power stroke. (F) Same but for return stroke. For DNa02 the relationship between motor neuron connections and limb kinematics is less clear. (G) Schematic summarizing the effects of each DN type on stride length, body velocity, and path shape.

References

    1. Brown T.G., and Sherrington C.S. (1997). The intrinsic factors in the act of progression in the mammal. Proc. R. Soc. Lond. B Biol. Sci. 84, 308–319.
    1. Grillner S. (2011). Control of locomotion in bipeds, tetrapods, and fish. In Handbook of Physiology: The Nervous System: Motor Control (John Wiley & Sons, Inc.).
    1. Wilson D.M., and Wyman R.J. (1965). Motor output patterns during random and rhythmic stimulation of locust thoracic ganglia. Biophys. J. 5, 121–143. - PMC - PubMed
    1. Graham D. (1979). Effects of circum-oesophageal lesion on the behaviour of the stick insect Carausius morosus. Biol. Cybern. 32, 139–145.
    1. Ryckebusch S., and Laurent G. (1993). Rhythmic patterns evoked in locust leg motor neurons by the muscarinic agonist pilocarpine. J. Neurophysiol. 69, 1583–1595. - PubMed

Publication types