[Preprint]. 2024 Apr 27:2023.10.13.562100.
doi: 10.1101/2023.10.13.562100.

Skeletal muscle BMAL1 is necessary for transcriptional adaptation of local and peripheral tissues in response to endurance exercise training

Affiliations

Skeletal muscle BMAL1 is necessary for transcriptional adaptation of local and peripheral tissues in response to endurance exercise training

Mark R Viggars et al. bioRxiv. .

Update in

Abstract

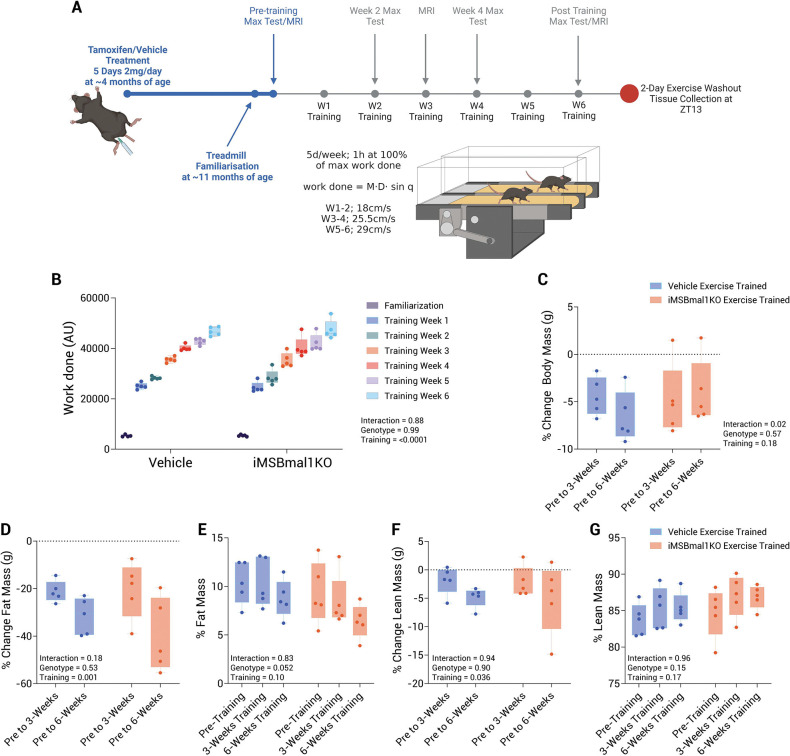
Objectives: In this investigation, we addressed the contribution of the core circadian clock factor, BMAL1, in skeletal muscle to both acute transcriptional responses to exercise and transcriptional remodelling in response to exercise training. Additionally, we adopted a systems biology approach to investigate how loss of skeletal muscle BMAL1 altered peripheral tissue homeostasis as well as exercise training adaptations in iWAT, liver, heart, and lung of male mice.

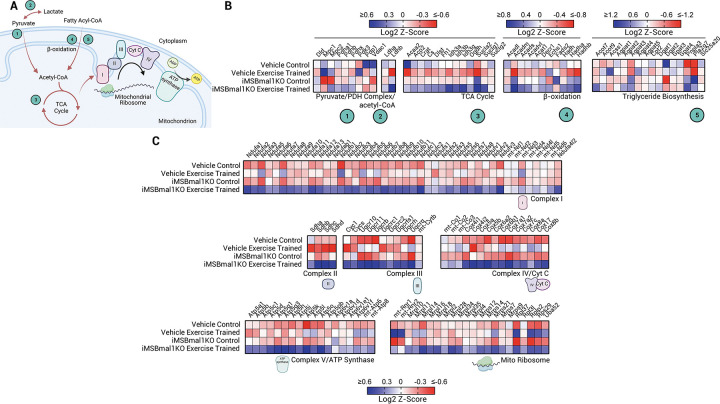
Methods: Combining inducible skeletal muscle specific BMAL1 knockout mice, physiological testing and standardized exercise protocols, we performed a multi-omic analysis (transcriptomics, chromatin accessibility and metabolomics) to explore loss of muscle BMAL1 on muscle and peripheral tissue responses to exercise.

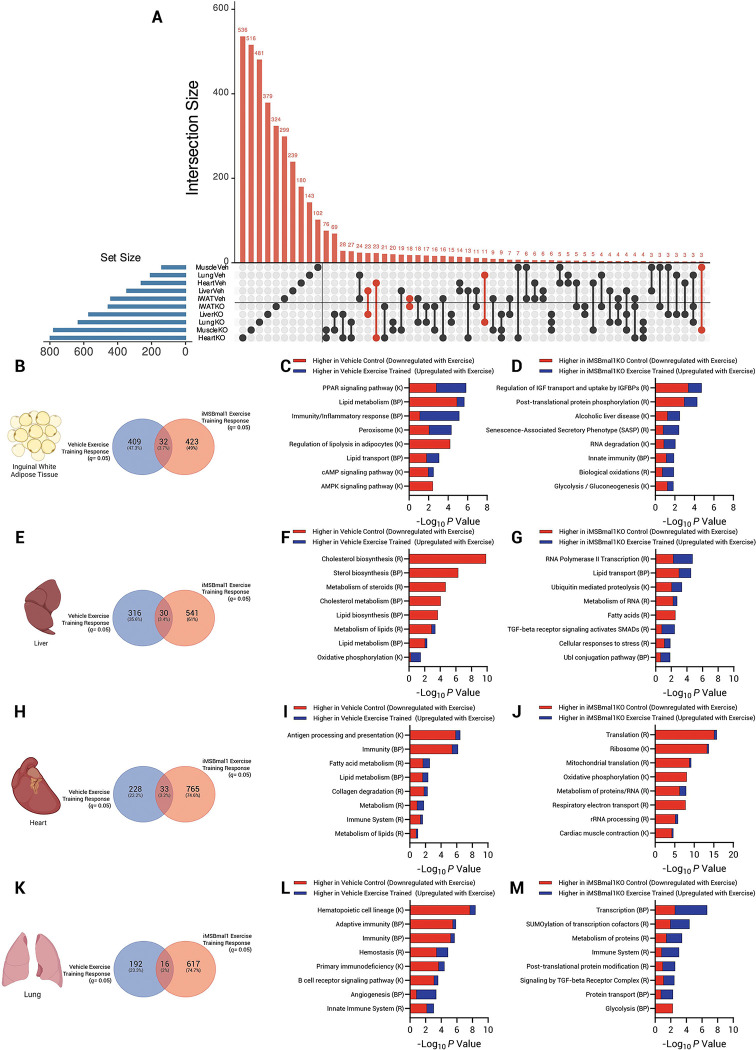
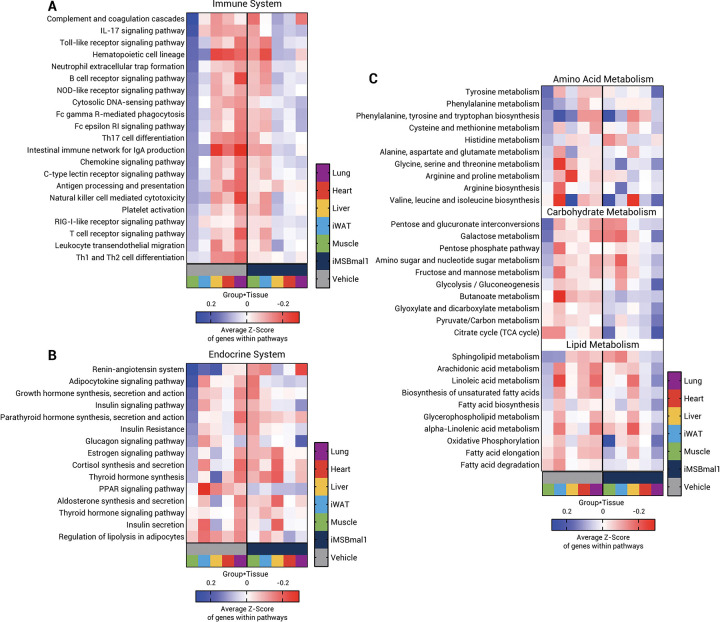
Results: Muscle-specific BMAL1 knockout mice demonstrated a blunted transcriptional response to acute exercise, characterized by the lack of upregulation of well-established exercise responsive transcription factors including Nr4a3 and Ppargc1a. Six weeks of exercise training in muscle-specific BMAL1 knockout mice induced significantly greater and divergent transcriptomic and metabolomic changes in muscle. Surprisingly, liver, lung, inguinal white adipose and heart showed divergent exercise training transcriptomes with less than 5% of 'exercise-training' responsive genes shared for each tissue between genotypes.

Conclusion: Our investigation has uncovered the critical role that BMAL1 plays in skeletal muscle as a key regulator of gene expression programs for both acute exercise and training adaptations. In addition, our work has uncovered the significant impact that altered exercise response in muscle plays in the peripheral tissue adaptation to exercise training. We also note that the transcriptome adaptations to steady state training suggest that without BMAL1, skeletal muscle does not achieve the expected homeostatic program. Our work also demonstrates that if the muscle adaptations diverge to a more maladaptive state this is linked to increased inflammation across many tissues. Understanding the molecular targets and pathways contributing to health vs. maladaptive exercise adaptations will be critical for the next stage of therapeutic design for exercise mimetics.

Keywords: Circadian Biology; Exercise; Inflammation; Metabolism; Signal Transduction; Transcription; circadian; skeletal muscle.


Conflict of interest statement

Declaration of Interests: The authors declare no competing interests.

Figures

Figure 1:
Figure 1:. Loss of skeletal muscle Bmal1 alters the transcriptional response to acute exercise.
(A) Experiment 1. Vehicle and iMSBmal1KO mice completed a 30-minute, 15° inclined treadmill bout at 70% of their maximum work done and gastrocnemius muscles were collected 1-hour post. (B) Exercise bout work was matched between genotypes. (C) RNA-sequencing was used to assess the number of DEGs 1-hour post exercise in vehicle and iMSBmal1KO mice. (D) Venn overlap of vehicle and iMSBmal1KO mice exercise responses. (E) Pathway analysis of shared exercise response genes. (F) Z-scores of exercise responsive clock factors and common exercise response genes shown between genotypes. Associated pathway databases are indicated by (R) Reactome, (K) KEGG, and (BP) Biological Processes. Pathway analysis of vehicle exercise responsive genes (G) and iMSBmal1KO exercise responsive genes (H).
Figure 2:
Figure 2:. Graded exercise performance and body composition analysis of vehicle and iMSBmal1KO mice.
The experimental design is illustrated in (A) which shows the timecourse and parameters of exercise training, physiological testing and tissue collection. At ~4 months of age, iMSBmal1fl/fl were treated with either a vehicle, or with tamoxifen for 5 days (2mg/day) to induce Cre-recombination and loss of Bmal1 specifically in skeletal muscle. Both vehicle and iMSBmal1KO mice were randomly assigned to 6 weeks of exercise training performed at ZT13, or control groups. Graded exercise tests were performed prior to, after 2, 4 and 6-weeks of training with the speed adjusted accordingly to make training progressive. MRIs were performed before, after 3 and 6 weeks of training. Mice from all groups were euthanised, and tissue was collected at ZT13, 47 hours after their final graded exercise test. (B) illustrates the weekly work done (AU) during exercise training. (C) Measurements of body mass were taken before, after 3 and 6 weeks of training and the subsequent percentage change calculated for each individual. (D) Total fat mass (g) measured before, after 3 and 6 weeks of training. (E) Percent changes in fat mass (g) were calculated from the beginning of the training period to the middle and end of the training period. (F) Total lean mass (g) measured before, after 3 and 6 weeks of training. (G) Percent changes in lean mass (g) were calculated from the beginning of the training period to the middle and end of the training period.
Figure 3:
Figure 3:. iMSBmal1KO gastrocnemius muscles present a larger and divergent transcriptional adaptation to 6-weeks of exercise training.
(A) Volcano plot illustrating DEGs between control and iMSBmal1 WT exercise trained mice. A total of 142 (75 downregulated, 67 upregulated) genes were differentially expressed using an FDR cut off of <0.05. (B) HOMER Motif analysis performed on up and downregulated DEGs identifies a number of transcription factors regulating the transcriptional response to normal exercise adaptation. (C) KEGG Pathway analysis of genes associated with the vehicle treated transcriptional response to exercise training. (D) Volcano plot illustrating DEGs between iMSBmal1KO control and iMSBmal1KO exercise trained mice. A total of 780 (283 downregulated, 497 upregulated) genes were differentially expressed using an FDR cut off of <0.05. (E) HOMER Motif analysis performed on up and downregulated DEGs identifies a number of transcription factors regulating the transcriptional response to exercise adaptation in the absence of skeletal muscle Bmal1. (F) KEGG Pathway analysis of genes associated with the iMSBmal1KO transcriptional remodeling to exercise training. (G) Venn diagram overlapping of DEG responses to vehicle and iMSBmal1KO exercise training at P <0.01. Minimal overlap in the transcriptional exercise responses is present between vehicle treated and iMSBmal1KO mice using a lenient significance cut off (63 out of 2107, 2.99% overlap). (H) Pie chart of the 63 common exercise training responsive genes in both genotypes reveals common and oppositely regulated gene reprogramming. (I) Analysis of DEGs affected by loss of BMAL1 and exercise training responsive DEGs in the iMSBma1KO mice, reveals 94 common genes. Pearson’s correlation of the 94 common DEGs (Log2 fold changes) reveals that genes affected with Bmal1KO are not rescued with exercise training. (J) Heatmap presenting Log2 Z-scores for core clock factors/clock output genes and genes associated with glucose handling and glycogen utilization. Exercise training does not rescue the downregulation of these genes in iMSBmal1KO mice.
Figure 4:
Figure 4:. Upregulation of genes associated with pyruvate oxidation, TCA cycle, β-oxidation, mitochondrial complexes and mitoribosome subunits after exercise training in the iMSBmal1KO mouse.
(A) Schematic of biological processes involved in providing acetyl-CoA from carbohydrates and lipids for the TCA cycle. Subsequently, the TCA cycle provides NADH and FADH2 for the electron transport chain. Components are numbered/labelled for clarity of the associated genes presented in panels B and C. (B) Heatmaps presenting genes associated with pyruvate oxidation, TCA cycle and β-oxidation, (Log2 Z-scores). (C) Heatmap presenting genes associated with mitochondrial complexes I-V and the mitochondrial ribosome (Log2 Z-scores).
Figure 5:
Figure 5:. Loss of Bmal1 in skeletal muscle disrupts the metabolomic rewiring in response to exercise training and causes depletion of TCA cycle intermediates.
(A) Table of differentially abundant metabolites (q < 0.05) with loss of skeletal muscle BMAL1, the vehicle exercise training response and the iMSBmal1KO exercise training response. (B) Venn diagram analysis of the different comparisons reveals little overlap and divergent metabolomic adaptations to exercise training. (C) Metaboanalyst KEGG metabolite pathway analysis of the iMSBmal1KO exercise training response. Numbers indicate the number of metabolites identified within the pathway. (D) Heatmap illustrating normalized metabolite abundance for amino acids. (E) Heatmap illustrating normalized metabolite abundance for metabolites relating to glycolysis and the TCA cycle. (F) Boxplots of highlighted amino acids changing with loss of BMAL1 and exercise training. (G) Boxplots of highlighted TCA cycle metabolites/phosphocreatine changing with loss of BMAL1 and exercise training. (H) Summary diagram of TCA cycle metabolites affected with exercise training in the iMSBmal1KO (Blue indicates higher abundance, red indicates lower abundance. Significance for one way ANOVA analysis is presented as *P ≤ 0.05, **P ≤ 0.01, ***P ≤ 0.001, ****P ≤ 0.0001.
Figure 6:
Figure 6:. Loss of skeletal muscle BMAL1 indirectly disrupts transcriptional homeostasis of peripheral tissues.
(A) Upset plot of the differentially expressed genes affected by loss of skeletal muscle BMAL1 across tissues. Set size indicates the total number of differentially expressed genes regulated by loss of BMAL1 in skeletal muscle in each tissue. Numbers above bars indicate the number of differentially expressed genes. Overlapping differentially expressed genes which are common between tissues are indicated by the connected points below bars. In summary when comparing vehicle control and iMSBmal1KO controls we identified 684 (425 upregulated, 259 downregulated) differentially expressed genes in inguinal white adipose tissue (iWAT), 199 (86 upregulated, 114 downregulated) in liver, 1177 (665 upregulated, 512 downregulated) in the heart and 110 (82 upregulated, 28 downregulated) in lung tissue where identified. Pathway analysis for differentially expressed genes in inguinal white adipose tissue (B), liver tissue (C), heart tissue (D) and lung tissue (E). Red segments of bars indicate downregulation with loss of BMAL1, blue segments of bars indicate upregulation with loss of BMAL1. Associated pathway databases are indicated by (R) Reactome, (K) KEGG and (BP) Biological Processes.
Figure 7:
Figure 7:. Divergent transcriptional reprogramming of peripheral tissues in response to endurance exercise training in the absence of skeletal muscle BMAL1.
(A) Upset plot of the gene sets associated with the training response of each tissue in both genotypes. Set size indicates the total number of differentially expressed genes regulated by exercise training in each tissue in both genotypes. Numbers above bars indicate the number of differentially expressed genes. Overlapping differentially expressed genes which are common between tissues are indicated by the connected points below bars. Differentially expressed genes common between genotypes within the same tissue are indicated by red connected points. (B) Summary Venn diagram of genotype specific exercise training responsive genes in vehicle (409 DEGs) and iMSBmal1KO mice (423 DEGs) with shared features (32 DEGs) in inguinal white adipose tissue. Associated inguinal white adipose tissue pathway analysis for vehicle (C) and iMSBmal1KO mice (D). (E) Summary Venn diagram of genotype specific exercise training responsive genes in vehicle (316 DEGS) and iMSBmal1KO mice (541 DEGs) with shared features (30 DEGs) in liver tissue. Associated liver pathway analysis for vehicle (F) and iMSBmal1KO mice (G). (H) Summary Venn diagram of genotype specific exercise training responsive genes in vehicle (228 DEGs) and iMSBmal1KO mice (765 DEGs) with shared features (33 DEGs) in heart tissue. Associated heart pathway analysis for vehicle (I) and iMSBmal1KO mice (J). (K) Summary Venn diagram of genotype specific exercise training responsive genes in vehicle (192 DEGs) and iMSBmal1KO mice (617 DEGs) with shared features (16 DEGs) in lung tissue. Associated lung pathway analysis for vehicle (L) and iMSBmal1KO mice (M). Red segments of bars indicate downregulation with exercise training, whereas blue segments of bars indicate upregulation with exercise training. Associated pathway databases are indicated by (R) Reactome, (K) KEGG and (BP) Biological Processes.
Figure 8:
Figure 8:. Loss of skeletal muscle BMAL1 causes rewiring of inflammatory and metabolic pathways across multiple tissues after exercise training.
Deseq2 normalized counts were used to produce within tissue Z-scores for all expressed genes for all 4 experimental groups. Average Z-scores were then produced from all genes found within the given KEGG pathway for vehicle exercise trained (grey bars) and iMSBmal1KO exercise trained mice (dark blue bars) for each tissue. Tissues are indicated by green bars (Gastrocnemius Muscle), light blue bars (iWAT), yellow bars (Liver), red bars (Heart) and purple bars (Lung). Data is presented for KEGG pathways related to (A) the Immune System, (B) Endocrine System and (C) Amino Acid, Carbohydrate and Lipid Metabolism. Blue signifies relative upregulation of associated pathways and red signifies relative downregulation of the genes within the associated pathways.

References

    1. Dyar K.A., Ciciliot S., Wright L.E., Biensø R.S., Tagliazucchi G.M., Patel V.R., et al., 2014. Muscle insulin sensitivity and glucose metabolism are controlled by the intrinsic muscle clock. Molecular Metabolism 3(1): 29–41, Doi: 10.1016/j.molmet.2013.10.005. - DOI - PMC - PubMed
    1. Ripperger J.A., Schibler U., 2006. Rhythmic CLOCK-BMAL1 binding to multiple E-box motifs drives circadian Dbp transcription and chromatin transitions. Nature Genetics 38(3): 369–74, Doi: 10.1038/ng1738. - DOI - PubMed
    1. Menet J.S., Pescatore S., Rosbash M., 2014. CLOCK:BMAL1 is a pioneer-like transcription factor. Genes & Development 28(1): 8–13, Doi: 10.1101/gad.228536.113. - DOI - PMC - PubMed
    1. Martin R.A., Viggars M.R., Esser K.A., 2023. Metabolism and exercise: the skeletal muscle clock takes centre stage. Nature Reviews Endocrinology: 1–13. - PMC - PubMed
    1. Hodge B.A., Wen Y., Riley L.A., Zhang X., England J.H., Harfmann B.D., et al., 2015. The endogenous molecular clock orchestrates the temporal separation of substrate metabolism in skeletal muscle. Skeletal Muscle 5(1): 1–16. - PMC - PubMed

Publication types