[Preprint]. 2023 Oct 19:2023.10.16.562422.
doi: 10.1101/2023.10.16.562422.

Pan-cancer analysis reveals multifaceted roles of retrotransposon-fusion RNAs

Affiliations

Pan-cancer analysis reveals multifaceted roles of retrotransposon-fusion RNAs

Boram Lee et al. bioRxiv. .

Abstract

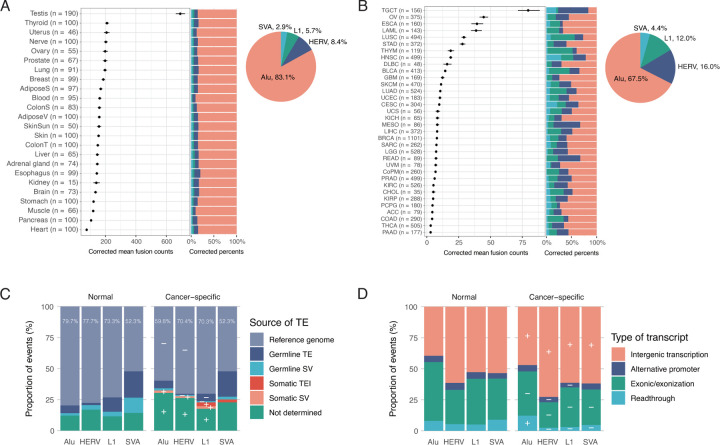
Transposon-derived transcripts are abundant in RNA sequences, yet their landscape and function, especially for fusion transcripts derived from unannotated or somatically acquired transposons, remains underexplored. Here, we developed a new bioinformatic tool to detect transposon-fusion transcripts in RNA-sequencing data and performed a pan-cancer analysis of 10,257 cancer samples across 34 cancer types as well as 3,088 normal tissue samples. We identified 52,277 cancer-specific fusions with ~30 events per cancer and hotspot loci within transposons vulnerable to fusion formation. Exonization of intronic transposons was the most prevalent genic fusions, while somatic L1 insertions constituted a small fraction of cancer-specific fusions. Source L1s and HERVs, but not Alus showed decreased DNA methylation in cancer upon fusion formation. Overall cancer-specific L1 fusions were enriched in tumor suppressors while Alu fusions were enriched in oncogenes, including recurrent Alu fusions in EZH2 predictive of patient survival. We also demonstrated that transposon-derived peptides triggered CD8+ T-cell activation to the extent comparable to EBV viruses. Our findings reveal distinct epigenetic and tumorigenic mechanisms underlying transposon fusions across different families and highlight transposons as novel therapeutic targets and the source of potent neoantigens.

Keywords: Cancer neoantigen; Gene fusion; Integrative multiomics data; Pan-cancer analysis; Transposable element.


Conflict of interest statement

Competing interests W-Y.P. is a founder and CEO of Geninus Inc. The other authors declare no competing interests.

Figures

Figure 1.
Figure 1.. Landscape of TE fusions detected by rTea.
(A) Corrected mean number of TE fusions per sample detected in GTEx data (2,076 samples). The number of TE fusions were corrected for technical variables, such as read length, and sequencing depth and quality). The error bar represents the 95% confidence interval of the corrected mean value. The pie chart shows the proportion of each TE family. (B) Corrected mean number of cancer-specific TE fusions per sample detected in TCGA (9,645 pan-cancer samples) and CoPM data (260 colorectal cancer samples). Cancer types are labeled using TCGA abbreviations. (C) Types of source TEs in normal and cancer-specific fusions for each TE family. The percentage of reference TEs is labeled for each category. Categories with a significant increase or decrease in cancer-specific fusions compared to normal fusions are marked by ‘+’ or ‘-’, respectively (FDR <0.05, two-sided Fisher’s exact test). (D) Transcript types of normal and cancer-specific fusions for each TE family.
Figure 2.
Figure 2.. Splicing hotspots within TE consensus sequences.
(A) Schematic diagram of an exonized TE with splice acceptor (3’) and donor (5’) sites (orange and blue lollipops, respectively). For TE exonization fusions, the count and type of splice signals are marked within TE consensus sequences for (B) L1HS, (C) SVA_D, (D) AluS, (E) HERVH, and (F) LTR7. Splice sites in the sense and antisense direction are marked upward and downward; canonical (AG/GT) and non-canonical (non AG/GT) splice sequences are marked by solid and dotted line lollipops, respectively. The occurrence of each TE position in the reference genome is shown in the bottom panel. L1HS and SVA_D show expected 5’ truncation patterns. Previously reported splicing hotspots for AluS and SVA_D are shown in the middle panels in C and D.
Figure 3.
Figure 3.. Association between TE fusion and DNA methylation level.
(A) Negative correlation between the number of cancer-specific TE fusions and mean DNA methylation level in the open sea. The number of cancer samples per bin is shown as a color scale. The regression line shows the trend. (B) Decreased DNA methylation level near (1 Kbp) source TEs of cancer-specific TE fusions. Z-score of each methylation site was calculated across the same cancer type. Data are shown for TE fusions in TCGA and CoPM samples. (C) TE-family-specific patterns in DNA methylation of source TEs. DNA methylation levels in 1 Kbp upstream, within the TE body, and 1 Kbp downstream of source TEs are marked for cancer-specific fusions detected in TCGA and CoPM samples. (D) Decreased DNA methylation in source HERVs and L1s in cancer fusions observed in ONT long-read WGS data. Tumor to normal log2 methylation ratio was calculated for the source TE involved in cancer-specific (orange) and normal TE fusions (control, blue) detected in five cancer and matched normal pairs with ONT WGS data. Red line represents median; red asterisk indicates a significant difference (P < 0.05, two-sided Wilcoxon rank sum test). N, the numbers of cancer-specific and normal fusions separated by comma in parenthesis. (E) Hypomethylation underlying HERV and L1 fusions in cancer. Tumor to normal log2 methylation ratio was calculated for 1 Kbp upstream, TE body, and 1 Kbp downstream of source TEs for cancer-specific TE fusions from ONT WGS data from five cancer and normal sample pairs. Red line represents median; red asterisk indicates a significant difference (P < 0.05, two-sided Wilcoxon signed-rank test). N, the number of cancer-specific fusions.
Figure 4.
Figure 4.. TE fusions enriched in known cancer genes and associated with patient survival.
(A) Odds ratios representing tumor suppressor genes (red), oncogenes (orange), and all cancer genomes (blue) are marked for cancer-specific TE fusions for each TE class. (B) Survival rates of patients with and without the AluSp exonized EZH2 gene in the TCGA bladder cancer cohort. (C) Schematic and Integrative Genomics Viewer (IGV) screenshot of the exonization of an intronic AluSp in EZH2 gene detected by rTea. Reads with split mappings (blue lines) show both splice junctions—exon 16 and AluSp as well as AluSp and exon 17. A pileup of reads (gray box) on the AluSp shows exonization of the intronic TE.
Figure 5.
Figure 5.. Immunogenicity of TE-derived peptides.
(A) Binding affinity of TE-derived peptides to major histocompatibility complex class I (MHC-I) molecule. TE-derived peptides predicted to bind to MHC-I were selected from CoPM colorectal cancer samples using in silico affinity prediction and structural modeling. Among the 33 peptide candidates, 20 peptides exhibited binding signals. The four peptides with the highest binding affinities to HLA-A*02:01 were further tested for T-cell activation. (B) Prediction power of computational methods to predict MHC-I binding of TE-derived peptides. NetMHCpan rank percentile is a prediction score for a peptide to be presented on MHC-I, normalized by comparing the score to the prediction of random peptides. FoldX Z-score represents the Z-score of predicted binding affinity calculated from structural modeling. We found that the structural filtering alone can be extremely predictive if Z-score < 0. The combination with NetMHCpan (rank percentile < 0.5) may further remove weak binders. (C) Detection of CD8+ T cells that specifically bind to HLA-A*02:01-presented peptides. Healthy donor CD8+ T-cells specifically binding to HLA-A*02:01-presented peptides were cultured for 21 days during co-culture with autologous peripheral blood mononuclear cells (PBMCs) and peptide-pulsed T-cells. Peptide-specific T-cells were detected with fluorescein isothiocyanate (FITC)-labeled MHC-I dextramer. The activation of T-cells was assessed by measuring CD154 expression. (D) Quantification of peptide-specific CD8+ T cells which bind peptide-MHC-I dextramer. The fold change was calculated by comparing the percentage of positive cells with distilled water-treated negative control. (E) Quantification of CD8+ and CD154+ expression on healthy donor T-cells. The fold change was calculated by comparing the percentage of positive cells with distilled water-treated negative control. (F) Configuration of TE fusions from which T-cell recognized peptides were derived. The peptides ALPGLLEFA, FISSVCWSL, and LLYPGLQAGV can be produced from the TE fusion of CDKN3-L1PA10, PON3-L1P2, and YARS1-SVA_A, respectively. The red line and error bar in (D) and (E) represent mean and standard deviation, respectively

References

    1. Stewart C., et al. A comprehensive map of mobile element insertion polymorphisms in humans. PLoS Genet 7, e1002236 (2011). - PMC - PubMed
    1. Sudmant P.H., et al. An integrated map of structural variation in 2,504 human genomes. Nature 526, 75–81 (2015). - PMC - PubMed
    1. Borges-Monroy R., et al. Whole-genome analysis reveals the contribution of non-coding de novo transposon insertions to autism spectrum disorder. Mob DNA 12, 28 (2021). - PMC - PubMed
    1. Lee E., et al. Landscape of somatic retrotransposition in human cancers. Science 337, 967–971 (2012). - PMC - PubMed
    1. Tubio J.M.C., et al. Mobile DNA in cancer. Extensive transduction of nonrepetitive DNA mediated by L1 retrotransposition in cancer genomes. Science 345, 1251343 (2014). - PMC - PubMed

Publication types