[Preprint]. 2023 Oct 20:2023.10.19.563182.
doi: 10.1101/2023.10.19.563182.

Multi-pass, single-molecule nanopore reading of long protein strands with single-amino acid sensitivity

Affiliations

Multi-pass, single-molecule nanopore reading of long protein strands with single-amino acid sensitivity

Keisuke Motone et al. bioRxiv. .

Update in

  • Multi-pass, single-molecule nanopore reading of long protein strands.
    Motone K, Kontogiorgos-Heintz D, Wee J, Kurihara K, Yang S, Roote G, Fox OE, Fang Y, Queen M, Tolhurst M, Cardozo N, Jain M, Nivala J. Motone K, et al. Nature. 2024 Sep;633(8030):662-669. doi: 10.1038/s41586-024-07935-7. Epub 2024 Sep 11. Nature. 2024. PMID: 39261738 Free PMC article.

Abstract

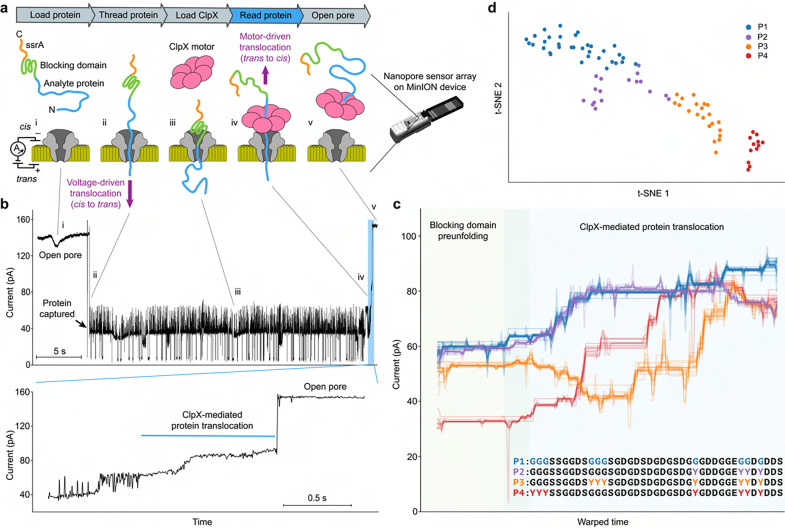
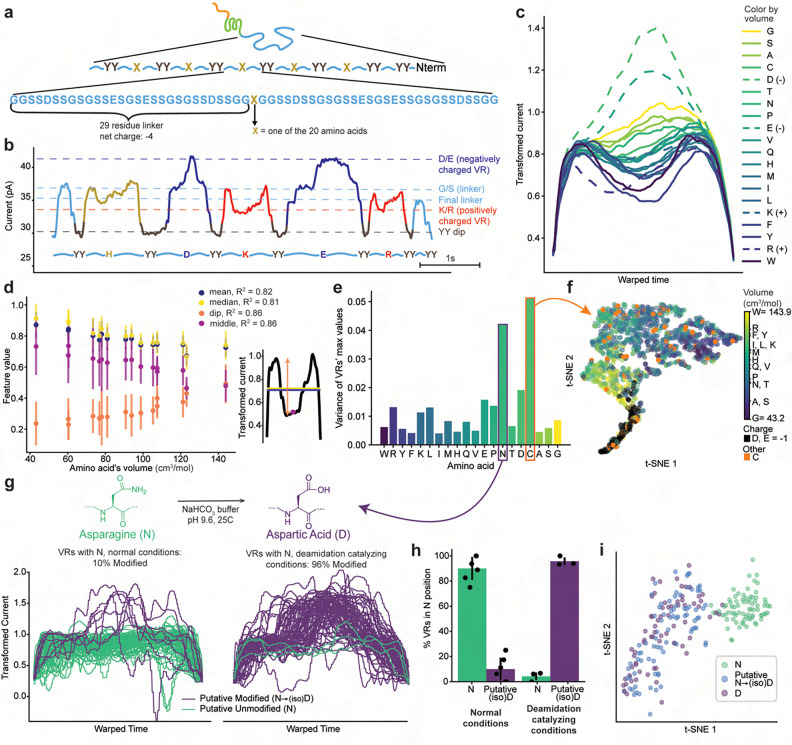
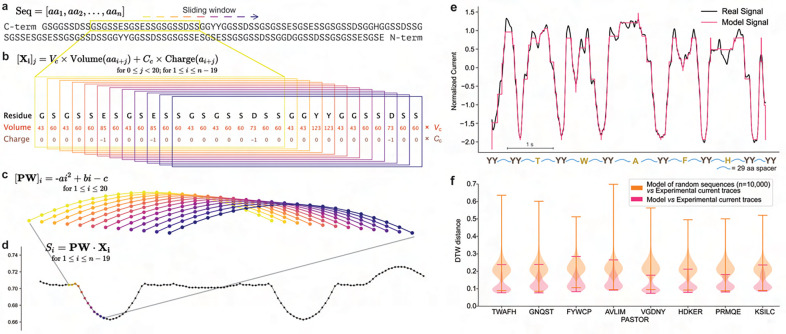
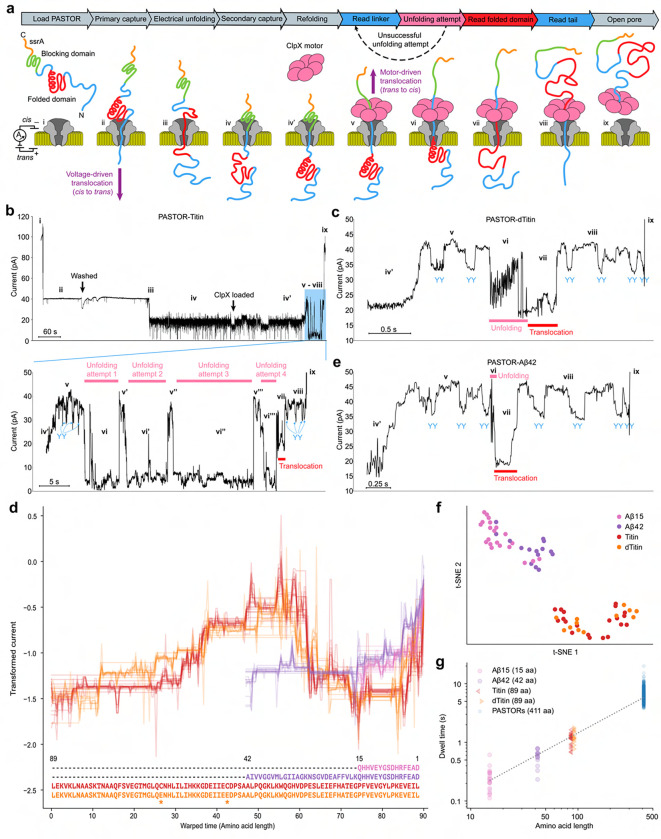
The ability to sequence single protein molecules in their native, full-length form would enable a more comprehensive understanding of proteomic diversity. Current technologies, however, are limited in achieving this goal. Here, we establish a method for long-range, single-molecule reading of intact protein strands on a commercial nanopore sensor array. By using the ClpX unfoldase to ratchet proteins through a CsgG nanopore, we achieve single-amino acid level sensitivity, enabling sequencing of combinations of amino acid substitutions across long protein strands. For greater sequencing accuracy, we demonstrate the ability to reread individual protein molecules, spanning hundreds of amino acids in length, multiple times, and explore the potential for high accuracy protein barcode sequencing. Further, we develop a biophysical model that can simulate raw nanopore signals a priori, based on amino acid volume and charge, enhancing the interpretation of raw signal data. Finally, we apply these methods to examine intact, folded protein domains for complete end-to-end analysis. These results provide proof-of-concept for a platform that has the potential to identify and characterize full-length proteoforms at single-molecule resolution.


Conflict of interest statement

Competing interests: Provisional patents covering aspects of this work have been filed by the University of Washington. JN is a consultant to Oxford Nanopore Technologies. The remaining authors declare no competing interests.

Figures

Fig. 1.
Fig. 1.. Nanopore protein reading using an unfoldase.
a, Schematic of cis-based unfoldase approach on the MinION platform. Assigned Roman numerals correspond to ionic current states in b. b, Example trace of protein P1. c, Ensemble traces of protein P1 (blue, n=34) and mutants P2 (purple, n=17), P3 (orange, n=21), and P4 (red, n=12). Protein sequences are oriented from C to N, with all mutation regions shown in color. d, t-Distributed stochastic neighbor-embedding (t-SNE) plot derived from embedding the all pairwise signal DTW distance comparison matrix (Methods).
Fig. 2.
Fig. 2.. Detecting single amino acid mutations across long protein strands.
a, PASTOR sequence composition. b, Filtered nanopore current trace of PASTOR-HDKER. Regions’ color boundaries are defined by YY-segmentation. c, Average signal trace for each amino acid’s transformed VRs, after euclidian alignment of all the VRs equidistantly stretched to the same length. VRs corresponding to a charged amino acid are shown in a dashed line. d, Scatter plot of various features of the VRs, with error bars denoting one standard deviation and explanation of the features to the right. n varies from 56 to 98. e, Bar blot of the variance of the max value of the transformed VRs corresponding to each amino acid. f, t-SNE map showing clustering of the pairwise DTW distance between each amino acid, with all amino acids other than D, E, and C being colored by the volume, the negative amino acids colored black, and C being highlighted in orange. g, Plot of all the VRs corresponding to asparagine in normal conditions (left) and in conditions that catalyze the deamidation of asparagine to aspartate (right). Lines colored teal if the max value of the transformed signal < 1.3, and purple otherwise. n=81 for normal conditions and 77 for deamidation conditions. h, Bar plot displaying percent of mutations that have been putatively deamidated or not (same threshold as in g, h) in VRs corresponding to asparagine, across technical replicates with n=6, 4, 3, and 3 from left to right. Error bars denote standard deviations. i, t-SNE plot as in g, showing only asparagine and aspartate VRs. Asparagine VRs are colored purple if the max value of the transformed signal < 1.3, and blue otherwise.
Fig. 3.
Fig. 3.. A biophysical model for simulating nanopore ionic current traces directly from protein sequence.
ad, Description of model signal generation. a, A protein sequence to be modeled. b, Calculation of the volume and charge, scaled, for all amino acids in the window of size 20. c, Parabolic weighting of the values within a window. d, Plotting the value S for each window, by computing the dot product of the parabolic weight array and the window array, to create the full model signal. e, Comparison between the nanopore signal of an example ionic current signal of PASTOR-TWAFH (black line) and the modeled signal generated for the same protein sequence (pink line). Model signal shown with the time axis aligned to the experimental trace using DTW. f, Distributions of the DTW distances between the real (experimental) signal traces and the model signals of the same sequence (pink), or between the real signal traces and the model signals of 10,000 random sequences derived from the same amino acid distribution as the real sequence (orange). n of experimental traces ranges from 27 to 55.
Fig. 4.
Fig. 4.. Single-molecule nanopore sequencing of single amino acid mutations.
a, PASTOR VR classification pipeline. b, Heatmap showing test accuracies in discriminating between all pairs of amino acid VR mutations, averaged over five Random Forests. c, Accuracy in a 20-way classification when “accuracy” is defined as the correct label being in the top-N most probable classes. The dummy classifier chooses one label at random. Results averaged over 20 models. d and e, Example sequencing traces in the test set, for two PASTOR constructs HDKER and AVLIM. Transformed ionic current traces are plotted with a box around the variable regions defined by the segmenter. The color intensity of the boxes represents the ranking of the true class in the aminocaller’s prediction for each VR. For the 5-way classification task (top box shading), the classes are the 5 mutations found in that protein, while the 20-way classification task (bottom box shading) considers all possible amino acid classes. In each box, the letter corresponds to the model’s top prediction, with the top letter denoting the 5-way classification and the bottom letter indicating the 20-way classification. A darker shade implies a more accurate prediction, indicating that the correct label ranked high in the model’s predictions.
Fig. 5.
Fig. 5.. Rereading single protein molecules multiple times with an unfoldase slip sequence.
a, Working model of rereading. The ClpX motor translocates PASTOR-reread to generate Read 1 (trans to cis). ClpX releases the protein strand upon reaching the slip sequence, and electrophoresis drives back-slipping (cis to trans). ClpX regains grip and ratchets the protein strand through the nanopore again. Recurrent back-slipping events produce subsequent rereads. b, Top box: Example trace of PASTOR-reread showing three near complete reread events (blue trace). Our model’s predicted signal for the PASTOR-reread sequence (pink trace) was aligned to each reread. The fourth VR contains an asparagine mutation, but the corresponding signal level consistently resembles aspartate in all three instances for this particular PASTOR-reread trace. The modeled sequence was changed to contain an aspartate to reflect the putative PTM. These rereading data provide additional evidence supporting the notion that the variability observed in asparagine VRs is attributed to post-translational deamidation of N to (iso)D, and not read-to-read variation. Bottom box: plot showing the approximate region of the strand that is within the nanopore over time. c, Estimated back-slipping distance for ClpX concentrations at 1000 nM (n=141), 200 nM (n=609), 40 nM (n=777), and 8 nM (n=999). The very first full-length read (Read 1) of each analyte protein molecule was excluded from this analysis. d and e, Number of all reads and full-length reads per PASTOR-reread molecule, respectively. The dotted lines indicate medians for ClpX concentrations at 1000 nM (n=26), 200 nM (n=37), 40 nM (n=23), and 8 nM (n=20). f, Simulated effect of rereading on 2 (Y, D), 4 (A, W, R, D), 7 (G, Q, W, F, R, D, E), 10 (A, G, V, N, Y, W, F, R, D, E), 14 (C, A, G, T, V, N, Q, M, Y, W, F, R, D, E), 17 (C, S, A, G, T, V, N, Q, M, I, Y, W, F, H, R, D, E), and 20-way (all 20 a.a.) classification tasks, compared to a baseline random classifier. Each value is the average over 100 train-test trials. g, Projected sequencing accuracy of barcode designs using the accuracies from f. Dots of the same color represent different amounts of bits allocated to error correcting codes (see Methods).
Fig. 6.
Fig. 6.. Processive reading of folded protein domains.
a, Working model of ClpX-mediated processing of folded proteins. Assigned Roman numerals correspond to ionic current states in b, c, and e. b, Example trace of PASTOR-Titin. c, Example trace of PASTOR-dTitin. d, Ensemble traces of state vii of PASTOR-Aβ15 (pink, n=21), -Aβ42 (purple, n=15), -Titin (red, n=20), and -dTitin (orange, n=12). Protein sequences are shown in the C-to-N direction, and asterisks represent the C47E and C63E mutations between Titin and dTitin. e, Example trace of PASTOR-Aβ42. f, t-SNE plot based on pairwise DTW distances for state vii. g, Relationship between protein length and translocation time. State vii dwell time is plotted for Aβ15, Aβ42, Titin, and dTitin, as well as translocation time for the 8 PASTORs with no folded domain insert (n=672). The dotted line was fitted with the mean dwell times of each protein class (slope corresponds to a translocation rate of 16 ms/aa or 63 aa/sec, R2=0.998).

References

    1. Smith L. M., Kelleher N. L. & Consortium for Top Down Proteomics. Proteoform: a single term describing protein complexity. Nat. Methods 10, 186–187 (2013). 200 - PMC - PubMed
    1. Lothrop A. P., Torres M. P. & Fuchs S. M. Deciphering post-translational modification codes. FEBS Lett. 587, 1247–1257 (2013). - PMC - PubMed
    1. Strahl B. D. & Allis C. D. The language of covalent histone modifications. Nature 403, 41–45 (2000). - PubMed
    1. Thomson M. & Gunawardena J. Unlimited multistability in multisite phosphorylation systems. Nature 460, 274–277 (2009). - PMC - PubMed
    1. Chandramouli K. & Qian P.-Y. Proteomics: challenges, techniques and possibilities to overcome biological sample complexity. Hum. Genomics Proteomics 2009, (2009). - PMC - PubMed

Publication types