[Preprint]. 2023 Oct 17:2023.06.29.547092.
doi: 10.1101/2023.06.29.547092.

Mechanical coupling coordinates microtubule growth

Affiliations

Mechanical coupling coordinates microtubule growth

Bonnibelle K Leeds et al. bioRxiv. .

Update in

Abstract

During mitosis, kinetochore-attached microtubules form bundles (k-fibers) in which many filaments grow and shorten in near-perfect unison to align and segregate each chromosome. However, individual microtubules grow at intrinsically variable rates, which must be tightly regulated for a k-fiber to behave as a single unit. This exquisite coordination might be achieved biochemically, via selective binding of polymerases and depolymerases, or mechanically, because k-fiber microtubules are coupled through a shared load that influences their growth. Here, we use a novel dual laser trap assay to show that microtubule pairs growing in vitro are coordinated by mechanical coupling. Kinetic analyses show that microtubule growth is interrupted by stochastic, force-dependent pauses and indicate persistent heterogeneity in growth speed during non-pauses. A simple model incorporating both force-dependent pausing and persistent growth speed heterogeneity explains the measured coordination of microtubule pairs without any free fit parameters. Our findings illustrate how microtubule growth may be synchronized during mitosis and provide a basis for modeling k-fiber bundles with three or more microtubules, as found in many eukaryotes.


Figures

Figure 1.
Figure 1.. Intrinsic variability in microtubule growth could be coordinated by mechanical coupling.
(a) Microtubules (MTs) grow at intrinsically variable rates that increase with force, on average. Example recordings show plus-end position versus time for individual growing microtubules subject to a constant tensile force of either 2 or 6 pN (thin green or magenta traces, respectively). At each force, 10 to 14 example recordings are shown, together with the mean position versus time (thick traces, computed from N = 25 or N = 10 individual recordings at 2 or 6 pN, respectively). Individual traces are from (Akiyoshi et al., 2010). (b) Mechanism by which mechanical coupling could coordinate growing microtubules. In this example, two microtubules share a total force, FTOT, through two spring-like connections to their plus-ends. If one microtubule stochastically lags behind, it will experience more tension than the leading microtubule due to differential stretching of their spring-connections. Because tension tends to accelerate plus-end growth (as illustrated in panel a), the higher tension will tend to accelerate the growth of the lagging microtubule, causing it to catch up.
Figure 2.
Figure 2.. Dual-trap assay to measure the coordination of two real microtubules in vitro coupled together by simulated spring-like connections to a shared tensile load.
(a) Schematic of the dual-trap assay, which measures the effects of the spring-coupler model (detailed in b) on real microtubules (MTs) growing in vitro. Two dynamic microtubules are grown from seeds anchored to two separate coverslips on two separate stages, each with their own microscope and laser trap. Each laser trap applies tension to its respective microtubule plus-end via a bead decorated with isolated yeast kinetochores, and each tension is adjusted dynamically under feedback control by a shared computer. Initially (steps 1 and 2), microtubule plus-ends are considered to have the same position (x1 = x2 = 0) so that each bears half of the total user-input tension (FTOT). Over time, as microtubules grow at different rates (step 3), the computer dynamically adjusts the tension on each microtubule according to the spring-coupler model (steps 4 and 5), so that the higher the tip separation (|x1 - x2|) and stiffness (ĸ), the larger the difference in tension between the two microtubules. (b) Spring-coupler model used to represent the physical connection between two microtubule plus-ends via a kinetochore. Both springs have identical stiffnesses (ĸ). The kinetochore is assumed to be in force equilibrium such that the sum of the spring forces is equal to the total external force, FTOT, which is kept constant in the current study.
Figure 3.
Figure 3.. Microtubule pairs growing in vitro are coordinated by mechanical coupling.
(a) Example dual-trap assay recordings showing real microtubule (MT) plus-end positions over time for representative microtubule pairs coupled via soft (1 pN·μm−1, left) or stiff (5 pN·μm−1, right) simulated spring-couplers. All dual-trap data was recorded with FTOT = 8 pN. (b) Tip separation (|x1 - x2|) between microtubule plus-end pairs that were coupled with either soft (left) or stiff (right) simulated spring-couplers over 400 s of growth. Light colors show tip separations for 10 individual microtubule pairs with each coupler stiffness, while dark colors show mean tip separation for all recorded pairs (N = 50 and N = 43 recordings with soft and stiff couplers, respectively). (c) Fraction of microtubule pairs whose plus-ends remained within 0.8 μm of each other over time. (In other words, the fraction of pairs at any given time whose tip separation had not exceeded the dashed line in (b).) Shaded regions in (b) and (c) show SEMs from N = 50 and N = 43 recordings with soft and stiff couplers, respectively.
Figure 4.
Figure 4.. Simple non-pausing simulations fail to recapitulate the coordinated growth of mechanically coupled microtubule pairs.
(a) Example simulations of microtubule (MT) plus-end positions over time using the non-pausing model. Simulated microtubule pairs were coupled via soft or stiff spring-couplers and shared a total load FTOT = 8 pN to match dual-trap assay conditions. (b) Tip separations between microtubule plus-end pairs that were simulated using the non-pausing model and coupled with either soft (left) or stiff (right) spring-couplers. Light colors show tip separations for N = 40 individual simulated microtubule pairs, while dark colors show mean tip separation for N = 10,000 simulated pairs. (c) Comparison between the fraction of in silico (simulated, dashed curves) and in vitro (real, solid curves) microtubule pairs whose plus-ends remained within 0.8 μm of each other over time. Shaded regions show SEMs from N = 50 and N = 43 in vitro recordings with soft and stiff couplers, respectively. Soft- and stiff-coupled microtubule pairs were each simulated N = 10,000 times over 400 s of growth in both (b) and (c). Simulation parameters for (a), (b), and (c) can be found in Table 1.
Figure 5.
Figure 5.. Increasing tension on individual growing microtubules suppresses pausing and accelerates growth during runs.
(a) As tension on a growing microtubule tip increases, the rate of pause entrance decreases, while the rate of pause exit increases. Mean pause entrance (formula image) and exit (formula image
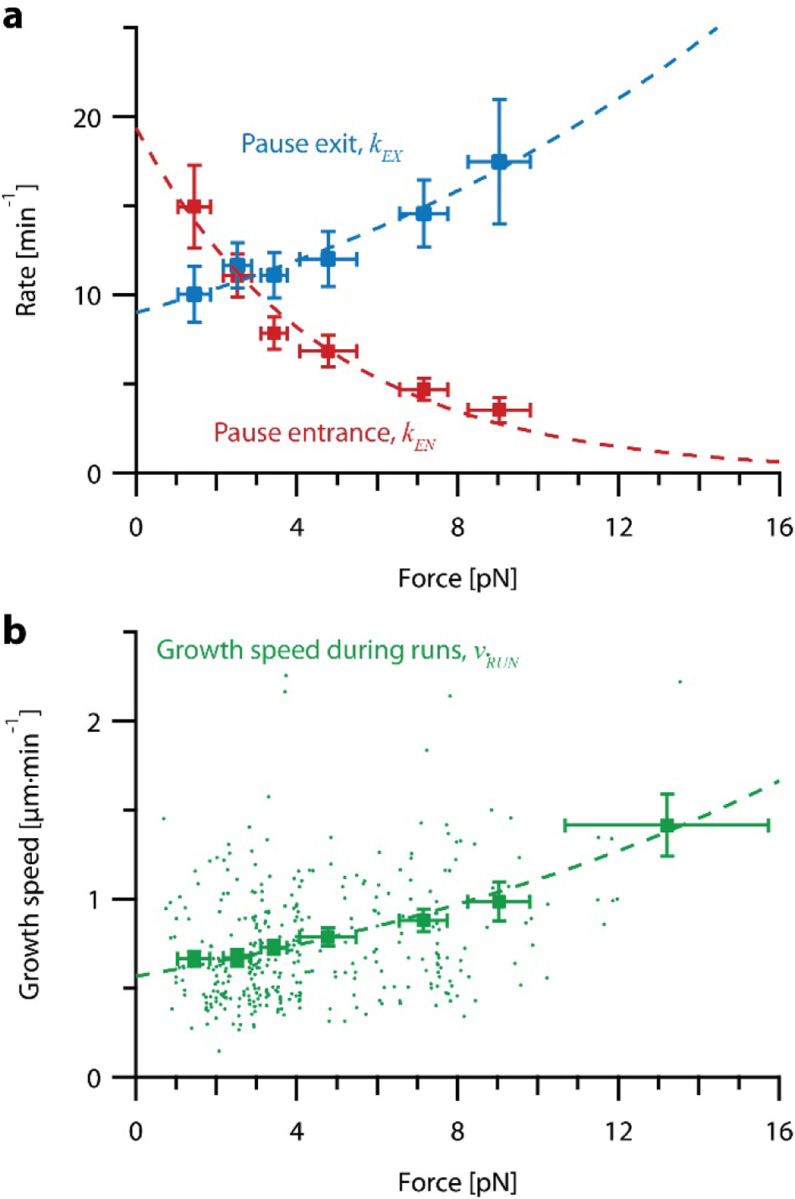
) rates (kEN and kEX) were estimated as described in Figure S5–1 and are plotted as functions of force. Error bars show counting uncertainties from N = 25 to 85 individual microtubule recordings and dashed curves show least squares exponential fits. (b) As tension on a microtubule tip increases, the growth during runs (i.e., in-between pauses) is accelerated. Points show run speeds measured from recordings of individual microtubules subject to constant tensile forces (from (Akiyoshi et al., 2010)). Symbols (formula image) represent mean run speeds (vRUN) grouped according to the applied tensile force. Error bars show SEMs from N = 9 to 85 individual microtubule recordings and dashed curve shows the least squares exponential fit. See Figure S5–1 and Materials and Methods for details and Table 1 for fit parameters.
Figure 6.
Figure 6.. Simulations recapitulate the coordinated growth of mechanically coupled microtubule pairs.
(a) Example simulations of microtubule (MT) plus-end positions over time using the pausing model. Simulated microtubule pairs were coupled via soft or stiff spring-couplers and shared a total load FTOT = 8 pN to match dual-trap assay conditions. (b) Tip separations between microtubule plus-end pairs that were simulated using the pausing model and coupled with either soft (left) or stiff (right) spring-couplers. Light colors show tip separations for N = 40 individual simulated microtubule pairs, while dark curves show mean tip separation for N = 10,000 simulated pairs. (c) Comparison between the fraction of in silico (simulated, dashed curves) and in vitro (real, solid curves) microtubule pairs whose plus-ends remained within 0.8 μm of each other over time. Shaded regions show SEMs from N = 50 and N = 43 in vitro recordings with soft and stiff couplers, respectively. Soft- and stiff-coupled microtubule pairs were each simulated N = 10,000 times over 400 s of growth in both (b) and (c). Simulation parameters for (a), (b), and (c) are listed in Table 1.

Similar articles

References

    1. Akiyoshi B., Sarangapani K. K., Powers A. F., Nelson C. R., Reichow S. L., Arellano-Santoyo H., Gonen T., Ranish J. A., Asbury C. L., & Biggins S. (2010). Tension directly stabilizes reconstituted kinetochore-microtubule attachments. Nature, 468(7323), 576–579. 10.1038/nature09594 - DOI - PMC - PubMed
    1. Al-Bassam J., Kim H., Brouhard G., van Oijen A., Harrison S. C., & Chang F. (2010). CLASP promotes microtubule rescue by recruiting tubulin dimers to the microtubule. Dev Cell, 19(2), 245–258. 10.1016/j.devcel.2010.07.016 - DOI - PMC - PubMed
    1. Amaro A. C., Samora C. P., Holtackers R., Wang E., Kingston I. J., Alonso M., Lampson M., McAinsh A. D., & Meraldi P. (2010). Molecular control of kinetochore-microtubule dynamics and chromosome oscillations. Nature Cell Bio, 12(4), 319–329. 10.1038/ncb2033 - DOI - PMC - PubMed
    1. Amin M. A., Agarwal S., & Varma D. (2019). Mapping the kinetochore MAP functions required for stabilizing microtubule attachments to chromosomes during metaphase. Cytoskeleton, 76(6), 398–412. https://doi.org/10.1002%2Fcm.21559 - PMC - PubMed
    1. Amoah-Darko F. L., & White D. (2022). Modelling microtubule dynamic instability: Microtubule growth, shortening and pause. J Theor Biol, 553, 111257–111257. 10.1016/j.jtbi.2022.111257 - DOI - PubMed

Publication types