. 2024 Jun 1;19(6):1344-1350.
doi: 10.4103/1673-5374.385851. Epub 2023 Sep 22.

Post-acute ischemic stroke hyperglycemia aggravates destruction of the blood-brain barrier

Affiliations

Post-acute ischemic stroke hyperglycemia aggravates destruction of the blood-brain barrier

Tianqi Xu et al. Neural Regen Res. .

Abstract

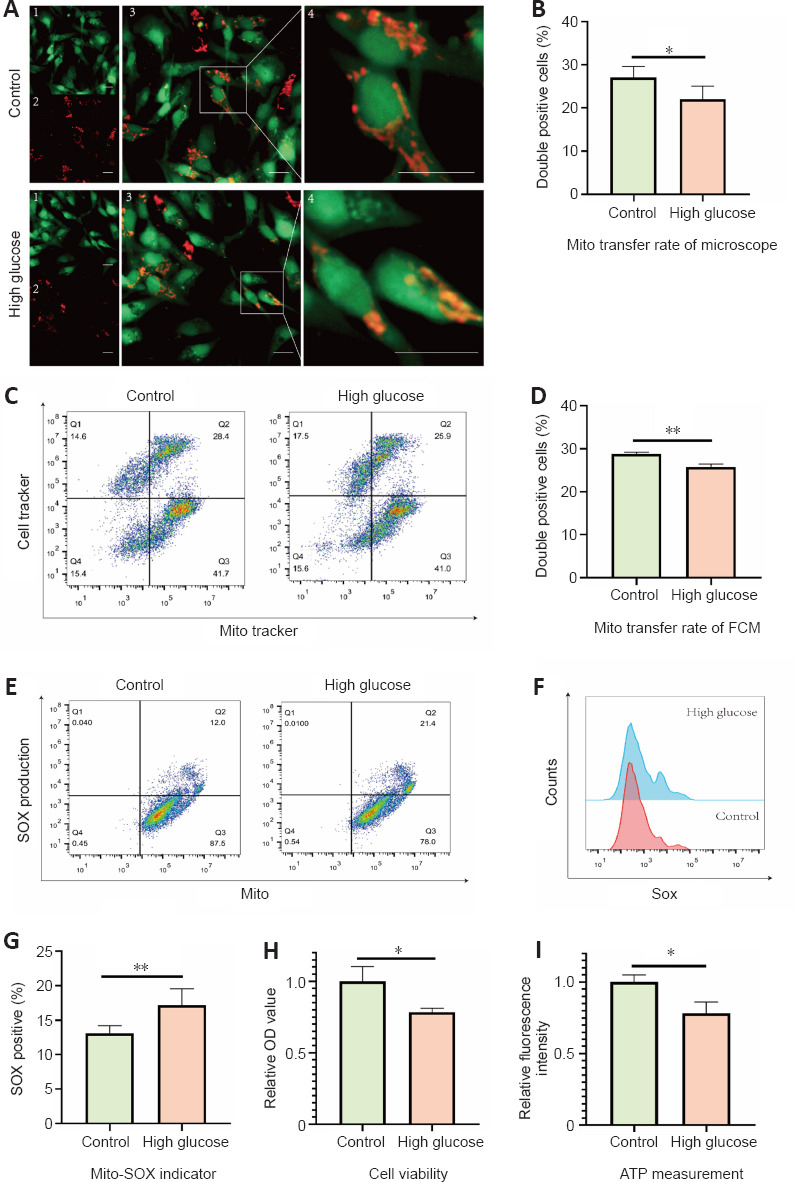
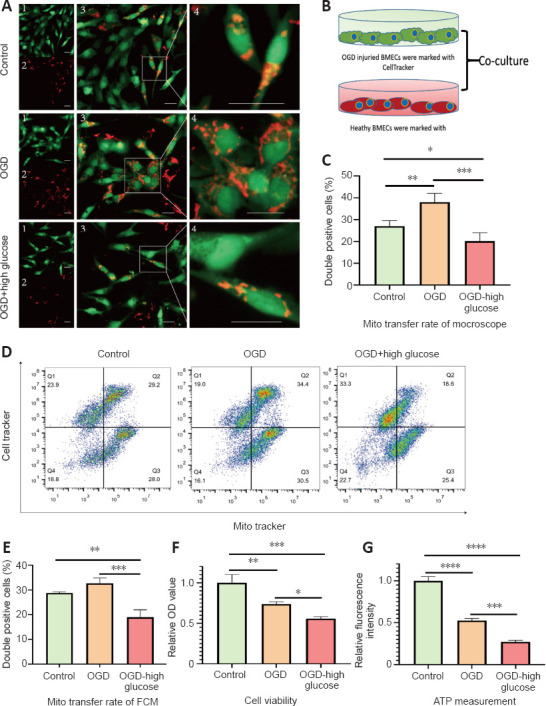
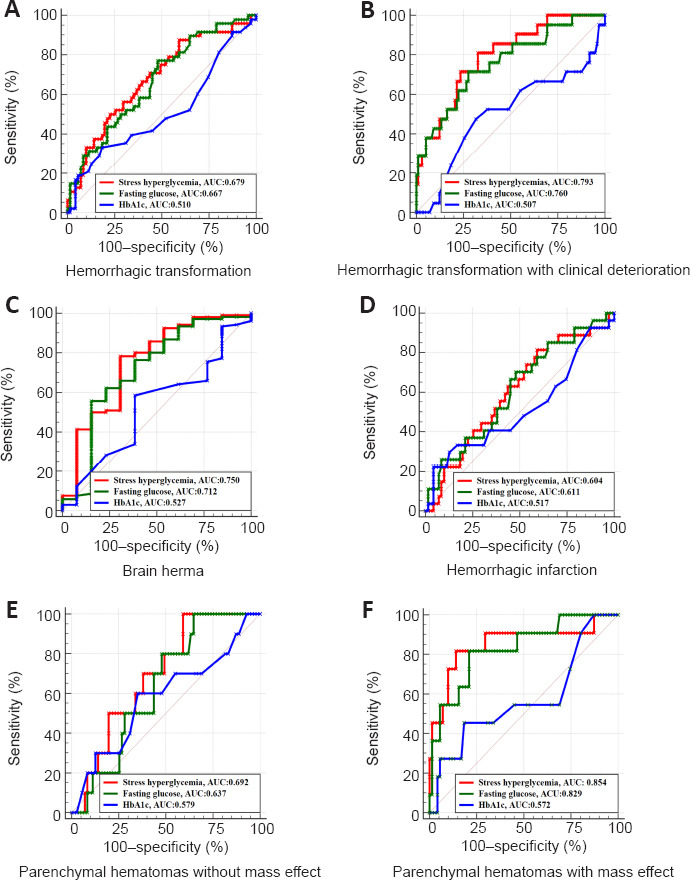
Post-acute ischemic stroke hyperglycemia increases the risk of hemorrhagic transformation, which is associated with blood-brain barrier disruption. Brain microvascular endothelial cells are a major component of the blood-brain barrier. Intercellular mitochondrial transfer has emerged as a novel paradigm for repairing cells with mitochondrial dysfunction. In this study, we first investigated whether mitochondrial transfer exists between brain microvascular endothelial cells, and then investigated the effects of post-acute ischemic stroke hyperglycemia on mitochondrial transfer between brain microvascular endothelial cells. We found that healthy brain microvascular endothelial cells can transfer intact mitochondria to oxygen glucose deprivation-injured brain microvascular endothelial cells. However, post-oxygen glucose deprivation hyperglycemia hindered mitochondrial transfer and exacerbated mitochondrial dysfunction. We established an in vitro brain microvascular endothelial cell model of the blood-brain barrier. We found that post-acute ischemic stroke hyperglycemia reduced the overall energy metabolism levels of brain microvascular endothelial cells and increased permeability of the blood-brain barrier. In a clinical study, we retrospectively analyzed the relationship between post-acute ischemic stroke hyperglycemia and the severity of hemorrhagic transformation. We found that post-acute ischemic stroke hyperglycemia serves as an independent predictor of severe hemorrhagic transformation. These findings suggest that post-acute ischemic stroke hyperglycemia can aggravate disruption of the blood-brain barrier by inhibiting mitochondrial transfer.


Conflict of interest statement

Conflicts of interest: The authors declare no conflict of interest.

Figures

Figure 1
Figure 1
Mitochondrial transfer occurs in brain microvascular endothelial cells mainly in the form of TNTs. Receptor BMECs were pre-stained with a viable cell tracker (green), while donor BMECs were pre-stained with a viable mitochondrial tracker (red). Both types of cells were then co-cultured for 16 hours. (A) Fluorescence microscopy image of receptor BMECs with green cell tracker. (B) Fluorescence microscopy image of donor BMECs with red mitochondrial tracker. (C) Merged images of A and B. Co-staining of green and red cells shows that functional mitochondria were transferred from donor to receptor cells. (D) Enlarged region of the left boxed region in C. (E) Enlarged region of the right boxed region in C. Arrows indicate the presence of functional mitochondria within TNTs. Scale bars: 20 μm. BMECs: Brain microvascular endothelial cells; TNTs: tunneling nanotubes.
Figure 2
Figure 2
High glucose levels decrease mitochondrial transfer and increase mitochondrial superoxide production. Prior to co-culture, receptor BMECs were pre-stained with a cell tracker for identification, while donor BMECs were pre-stained with a mitochondrial tracker to track mitochondrial mobility. The cells were then co-cultured for 16 hours under normal (25 mM) or high glucose (40 mM) conditions. (A) Representative fluorescence images from control and high glucose groups. (A1) Receptor BMECs with green cell tracker. (A2) Donor BMECs with red mitochondrial tracker. (A3) Merged images of A1 and A2. (A4) Enlarged region of the boxed region in A3. Scale bars: 20 μm. (B) Bar graph of the proportion of red/green fluorescent double positive cells in A. (C) Flow cytometry analysis of mitochondrial transfer. (D) Bar graph of the mitochondrial transfer rate. (E, F) Mitochondrial SOX production assessed by flow cytometry using MitoSOX red indicator. (G) Bar graph of mitochondrial SOX levels. (H) Cell viability assessed using the CCK-8 kit. (I) ATP levels assessed using CellTiter-Glo. Values are expressed as mean ± SD (n = 3–5 independent experiments). *P < 0.05, **P < 0.01 (independent samples t-test). ATP: Adenosine-triphosphate; BMECs: brain microvascular endothelial cells; CCK-8: cell counting kit-8; FCM: flow cytometry; SOX: superoxide.
Figure 3
Figure 3
Post-OGD hyperglycemia inhibits mitochondria transfer from healthy to damaged BMECs. Receptor BMECs were pre-stained with a viable cell tracker (green), while donor BMECs were pre-stained with a viable mitochondrial tracker (red). In the control group, healthy receptor and donor cells were co-cultured under normal glucose (25 mM) conditions. In the OGD group, receptor cells were pre-treated with OGD for 4 hours. Damaged receptor cells were then co-cultured with healthy donor cells for 16 hours under normal glucose conditions (25 mM). In the OGD-HG group, damaged receptor and healthy donor cells were co-cultured for 16 hours under high glucose conditions (40 mM). (A) Representative fluorescence images from the control, OGD, and OGD-HG groups. (A1) Receptor BMECs with green cell tracker. (A2) Donor BMECs with red mitochondrial tracker. (A3) Merged images of A1 and A2. (A4) Enlarged region of the boxed region in A3. Scale bars: 20 μm. (B) Schematic of co-culture protocol. (C) Bar graph of the proportion of double positive cells in A. (D) Flow cytometry analysis of mitochondrial transfer. (E) Bar graph of the mitochondrial transfer rate. (F) Cell viability assessed using the CCK-8 kit. (G) ATP levels assessed using CellTiter-Glo. Values are expressed as mean ± SD (n = 3–5 independent experiments). *P < 0.05, **P < 0.01, ***P < 0.001, ****P < 0.0001 (one-way analysis of variance followed by Holm-Šídák’s multiple comparisons test). ATP: Adenosine-triphosphate; BMECs: brain microvascular endothelial cells; CCK-8: cell counting kit-8; HG: high glucose; OGD: oxygen-glucose deprivation.
Figure 4
Figure 4
Post-OGD hyperglycemia aggravates mitochondrial dysfunction. (A) Production of mitochondrial SOX assessed using MitoSOX red indicator with flow cytometry. (B) Bar graph of mitochondrial SOX. (C) Permeability of the mitochondrial transition pore assessed by flow cytometry. (D) Bar graph of mitochondrial pore permeability. (E) Mitochondrial membrane potential assessed using JC-1 reagent with flow cytometry. (F) Bar graph of mitochondrial membrane potential. Values are expressed as mean ± SD (n = 3–5 independent experiments). *P < 0.05, **P < 0.01, ***P < 0.001, ****P < 0.0001 (one-way analysis of variance followed by Holm-Šídák’s multiple comparisons test). FITC: Fluorescein isothiocyanate; OGD: oxygen-glucose deprivation; SOX: superoxide.
Figure 5
Figure 5
Post-OGD hyperglycemia aggravates BBB disruption in vitro. In vitro model of the BBB based on a Transwell chamber. In the control group, cells were cultured under normal glucose (25 mM) conditions for 20 hours. In the high glucose group, cells were cultured under high glucose (40 mM) conditions for 20 hours. In the OGD group, cells were treated with OGD for 4 hours, followed by normal glucose conditions (25 mM) during a 16-hour reoxygenation stage. In the OGD-HG group, cells were treated with OGD for 4 hours, followed by high glucose condition (40 mM) during a 16-hour reoxygenation stage. (A) Schematic diagram of the in vitro model for BBB integrity assessed by FITC–dextran permeability. (B) Bar graph of FITC–dextran fluorescence intensity in the lower chamber. (C) Representative western blot of the BBB tight junction protein, ZO-1. (D) Quantification of ZO-1 expression. Values are expressed as mean ± SD (n = 3 independent experiments). *P < 0.05, ***P < 0.001, ****P < 0.0001 (one-way analysis of variance followed by Holm-Šídák’s multiple comparisons test). BBB: Blood-brain barrier; FITC: fluorescein isothiocyanate; HG: high glucose; OGD: oxygen-glucose deprivation; ZO-1: zonula occludens-1.
Figure 6
Figure 6
Post-AIS hyperglycemia is a predictor of severe hemorrhagic transformation in AIS patients. (A) Comparison of ROC curves for the prediction of HT. AUC values for stress hyperglycemia, fasting glucose, and HbA1c were 0.679, 0.667, and 0.510, respectively. (B) Comparison of ROC curves for the prediction of HT accompanied by clinical deterioration. AUC values for stress hyperglycemia, fasting glucose, and HbA1c were 0.793. 0.760, and 0.507, respectively. (C) Comparison of ROC curves for the prediction of brain hernia. AUC values for stress hyperglycemia, fasting glucose, and HbA1c were 0.750, 0.712, and 0.527, respectively. (D) Comparison of ROC curves for the prediction of hemorrhagic infarction. AUC values for stress hyperglycemia, fasting glucose, and HbA1c were 0.604, 0.611, and 0.517, respectively. (E) Comparison of ROC curves for predicting parenchymal hematomas without mass effect. AUC values for stress hyperglycemia, fasting glucose, and HbA1c were 0.692, 0.637, and 0.579, respectively. (F) Comparison of ROC curves for the prediction of parenchymal hematomas with mass effects. AUC values for stress hyperglycemia, fasting glucose, and HbA1c were 0.854, 0.829, and 0.572, respectively. AIS: Acute ischemic stroke; AUC: area under the curve; HbA1c: glycosylated hemoglobin; HT: hemorrhagic transformation; ROC: receiver operating characteristic.
Figure 7
Figure 7
Illustrative cases of stress hyperglycemia with HT versus normal glucose without HT. (A) Case 1, fasting glucose: 4.72 mM, HbA1c: 5.6%, SHR: 0.746. Follow-up CT did not indicate HT. (B) Case 2, fasting glucose: 9.7 mM, HbA1c: 5.4%, SHR: 1.618. Follow-up CT indicated parenchymal hematomas with mass effect. (A1, B1) Baseline map of admission CT. (A2, B2) MTT map of admission CT. (A3, B3) DT map of admission CT. (A4, B4) CBV map of admission CT. (A5, B5) CBF map of admission CT. (A6, B6) Lesion map of admission CT. Green represents ischemic penumbra and red represents ischemic core. (A7, B7) Follow-up CT within 24 hours. CBF: Cerebral blood flow; CBV: cerebral blood volume; CT: computed tomography; DT: delay time; HbA1c: glycosylated hemoglobin; HT: hemorrhagic transformation; SHR: stress hyperglycemia ratio.
Figure 8
Figure 8
Post-OGD hyperglycemia increases O-GlcNAcylation levels in BMECs. (A) Representative western blots of total O-GlcNAcylation levels (RL2), OGA, and OGT. (B) Quantification of total O-GlcNAcylation levels. (C) Quantification of OGT expression. (D) Quantification of OGA expression. Values are expressed as mean ± SD (n = 3 independent experiments). *P < 0.05, ***P < 0.001, ****P < 0.0001 (one-way analysis of variance followed by Holm-Šídák’s multiple comparisons test). BBB: Blood-brain barrier; BMECs: brain microvascular endothelial cells; OGT: O-GlcNAc transferase; OGA: O-GlcNAc hydrolase; OGD: oxygen-glucose deprivation; TNTs: tunnelling nanotubes.

References

    1. Amruta N, Bix G. ATN-161 ameliorates ischemia/reperfusion-induced oxidative stress fibro-inflammation mitochondrial damage and apoptosis-mediated tight junction disruption in bEnd.3 cells. Inflammation. (2021);44:2377–2394. - PMC - PubMed
    1. Babenko VA, Silachev DN, Popkov VA, Zorova LD, Pevzner IB, Plotnikov EY, Sukhikh GT, Zorov DB. Miro1 enhances mitochondria transfer from multipotent mesenchymal stem cells (MMSC) to neural cells and improves the efficacy of cell recovery. Molecules. (2018);23:687. - PMC - PubMed
    1. Baird TA, Parsons MW, Phan T, Butcher KS, Desmond PM, Tress BM, Colman PG, Chambers BR, Davis SM. Persistent poststroke hyperglycemia is independently associated with infarct expansion and worse clinical outcome. Stroke. (2003);34:2208–2214. - PubMed
    1. Berger C, Fiorelli M, Steiner T, Schäbitz WR, Bozzao L, Bluhmki E, Hacke W, von Kummer R. Hemorrhagic transformation of ischemic brain tissue:asymptomatic or symptomatic? Stroke. (2001);32:1330–1335. - PubMed
    1. Bond MR, Hanover JA. O-GlcNAc cycling:a link between metabolism and chronic disease. Annu Rev Nutr. (2013);33:205–229. - PMC - PubMed

LinkOut - more resources