. 2023 Dec;91(12):1658-1683.
doi: 10.1002/prot.26609. Epub 2023 Oct 31.

Impact of AlphaFold on structure prediction of protein complexes: The CASP15-CAPRI experiment

Marc F Lensink  1 Guillaume Brysbaert  1 Nessim Raouraoua  1 Paul A Bates  2 Marco Giulini  3 Rodrigo V Honorato  3 Charlotte van Noort  3 Joao M C Teixeira  3 Alexandre M J J Bonvin  3 Ren Kong  4 Hang Shi  4 Xufeng Lu  4 Shan Chang  4 Jian Liu  5 Zhiye Guo  5 Xiao Chen  5 Alex Morehead  5 Raj S Roy  5 Tianqi Wu  5 Nabin Giri  5 Farhan Quadir  5 Chen Chen  5 Jianlin Cheng  5 Carlos A Del Carpio  6 Eichiro Ichiishi  7 Luis A Rodriguez-Lumbreras  8   9 Juan Fernandez-Recio  8   9 Ameya Harmalkar  10 Lee-Shin Chu  10 Sam Canner  10 Rituparna Smanta  10 Jeffrey J Gray  10   11 Hao Li  12 Peicong Lin  12 Jiahua He  12 Huanyu Tao  12 Sheng-You Huang  12 Jorge Roel-Touris  13 Brian Jimenez-Garcia  14 Charles W Christoffer  15 Anika J Jain  16 Yuki Kagaya  16 Harini Kannan  16   17 Tsukasa Nakamura  16 Genki Terashi  16 Jacob C Verburgt  16 Yuanyuan Zhang  15 Zicong Zhang  15 Hayato Fujuta  17 Masakazu Sekijima  18 Daisuke Kihara  15   16 Omeir Khan  19 Sergei Kotelnikov  20 Usman Ghani  19 Dzmitry Padhorny  20 Dmitri Beglov  19 Sandor Vajda  19 Dima Kozakov  20 Surendra S Negi  21 Tiziana Ricciardelli  22 Didier Barradas-Bautista  22 Zhen Cao  22 Mohit Chawla  22 Luigi Cavallo  22   23 Romina Oliva  24 Rui Yin  25   26 Melyssa Cheung  25   27 Johnathan D Guest  25   26 Jessica Lee  25   26 Brian G Pierce  25   26 Ben Shor  28 Tomer Cohen  28 Matan Halfon  28 Dina Schneidman-Duhovny  28 Shaowen Zhu  29 Rujie Yin  29 Yuanfei Sun  29 Yang Shen  29   30   31 Martyna Maszota-Zieleniak  32 Krzysztof K Bojarski  33 Emilia A Lubecka  33 Mateusz Marcisz  32 Annemarie Danielsson  32 Lukasz Dziadek  32 Margrethe Gaardlos  32 Artur Gieldon  32 Adam Liwo  32 Sergey A Samsonov  32 Rafal Slusarz  32 Karolina Zieba  32 Adam K Sieradzan  32 Cezary Czaplewski  32 Shinpei Kobayashi  34 Yuta Miyakawa  34 Yasuomi Kiyota  34 Mayuko Takeda-Shitaka  34 Kliment Olechnovic  35 Lukas Valancauskas  35 Justas Dapkunas  35 Ceslovas Venclovas  35 Bjorn Wallner  36 Lin Yang  37   38 Chengyu Hou  39 Xiaodong He  37   40 Shuai Guo  37 Shenda Jiang  37 Xiaoliang Ma  37 Rui Duan  41 Liming Qui  41 Xianjin Xu  41 Xiaoqin Zou  41   42   43   44 Sameer Velankar  45 Shoshana J Wodak  46
Affiliations

Impact of AlphaFold on structure prediction of protein complexes: The CASP15-CAPRI experiment

Marc F Lensink et al. Proteins. 2023 Dec.

Abstract

We present the results for CAPRI Round 54, the 5th joint CASP-CAPRI protein assembly prediction challenge. The Round offered 37 targets, including 14 homodimers, 3 homo-trimers, 13 heterodimers including 3 antibody-antigen complexes, and 7 large assemblies. On average ~70 CASP and CAPRI predictor groups, including more than 20 automatics servers, submitted models for each target. A total of 21 941 models submitted by these groups and by 15 CAPRI scorer groups were evaluated using the CAPRI model quality measures and the DockQ score consolidating these measures. The prediction performance was quantified by a weighted score based on the number of models of acceptable quality or higher submitted by each group among their five best models. Results show substantial progress achieved across a significant fraction of the 60+ participating groups. High-quality models were produced for about 40% of the targets compared to 8% two years earlier. This remarkable improvement is due to the wide use of the AlphaFold2 and AlphaFold2-Multimer software and the confidence metrics they provide. Notably, expanded sampling of candidate solutions by manipulating these deep learning inference engines, enriching multiple sequence alignments, or integration of advanced modeling tools, enabled top performing groups to exceed the performance of a standard AlphaFold2-Multimer version used as a yard stick. This notwithstanding, performance remained poor for complexes with antibodies and nanobodies, where evolutionary relationships between the binding partners are lacking, and for complexes featuring conformational flexibility, clearly indicating that the prediction of protein complexes remains a challenging problem.

Keywords: AlphaFold; CAPRI; CASP; blind prediction; deep learning; protein assemblies; protein complexes; protein-protein interaction.


Conflict of interest statement

The authors declare no conflicts of interest.

Figures
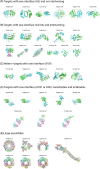
FIGURE 1
FIGURE 1
Pictorial representation of the targets of Round 54. The 37 targets of this prediction Round are grouped into five categories: (A) Homodimers without intertwining, (B) homodimers and homotrimers with intertwining, (C) heterodimers of which a special category are complexes with nanobodies (Nb) and antibodies (Ab, consisting of a heavy (H) and light (L) chain) (D), and (E) large homomeric and heteromeric assemblies. The targets are annotated with their CAPRI and CASP ID's. Note that T192/T1109 strictly speaking belongs to group (A), but it is only a point mutation away from T193/T1110, which shows intertwining, and was therefore assigned to group (B).
FIGURE 2
FIGURE 2
Examples of challenging homomeric targets with and without intertwining. (A) Association mode of T211/T1153, afforded by the Trp (orange)‐rich loops (red). (B) T197/T1121 monomer (cyan) and AF2 model (salmon), illustrating how the flexibility of the loop connecting the two domains affected the AF2‐M prediction results. (C) The T198/T1123 monomer (cyan) and AF2 model (salmon), illustrating how the flexibility of several loops affects the prediction results, here AF2. (D) Dimeric structures of the ancient protein reconstructions of T213/T1160 (left, yellow) and T214/T1161 (right, salmon), illustrating the changes in the interface between the subunits.
FIGURE 3
FIGURE 3
Examples of challenging heteromeric targets. (A) AF2 model of the less well‐structured YscX component of T191/H1106. (B) AF2 model of the PDI1P component of T212/H1157. Color coding of A and B identical to the one used by AlphaFold_DB. (C) The nanobody (Nb) binding modes to the CNPase (red) in targets T205/H1140 (green), T206/H1141 (cyan), T207/H1142 (magenta), T208/H1143 (yellow), and T209/H1144 (salmon). (D) The antibody (Ab, red and orange) binding modes to the SARS‐CoV‐2 nuclear capsid protein of targets T216/H1166 (green), T217/H1167 (cyan), T218/H1168 (magenta).
FIGURE 4
FIGURE 4
Details of the association mode and assessment units in T203/H1135 large assembly. (A) Shows the association mode of T203/H1135, which assembles into a trimer of trimers. This target was subdivided into 2 assessment units (AUs). AU203.1 is comprised of the minor or inner trimer featuring three interfaces, while AU203.2 represents the major or outer trimer, which consists of a single unique interface. Each minor trimer is formed by three SUN1 monomers that adopt three different conformations, shown in (B), while conserving their internal interface (interface T203.1). In addition, a protein fragment of IRAG2 (red) binds one of the SUN1 monomers (light blue; T203.2; 850 Å2), forming a secondary interface (T203.3; 750 Å2) to another monomer. The two (green) monomers of the minor trimer form the interface to a neighboring trimer, constituting the interface of AU203.2 (T203.4; 500 Å2), indicated by the dashed lines. (B) Shows the three conformations of the subunits of the minor trimer (dark green, light green, and light blue), plus the conformation found in the template trimer (blue; PDB 6R2I), which was found to overlap with the conformation binding the peptide. However, the alpha‐helical fragment of the peptide was not found in the template and without adopting the other two conformations of SUN1 it could not be accommodated into the minor trimer without clashes.
FIGURE 5
FIGURE 5
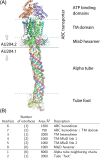
Details of the association mode and assessment units in T204/H1137 large assembly. (A) The assembly of T204/H1137, as resolved by cryo‐EM at 3.10 Å resolution. The bulk of the assembly is made up of six protein chains of different sequences, four of them (white, green, cyan, magenta) starting in the TM domain, all of them containing an MlaD domain and participating in the alpha‐helical tube, and two of them (yellow and salmon; those not in the TM domain) forming a C‐terminal domain annotated here as the tube foot. Whereas all interfaces were assessed, due to their structural similarity many of these interfaces have been grouped together, defining interfaces 1–8 as listed in (B), with the best result for any of the participating interfaces taken as the assessment result for that interface; the original number of interfaces is listed in parentheses. The interfaces are subsequently grouped into two assessment units AU204.1 and AU204.2 (see text for detail).
FIGURE 6
FIGURE 6
Details of the association mode and assessment units of the large assemblies in T219/T1170, T220/H1171, and T221/H1172. These targets are three different solved structures of the same complex: the RuvB hexamer, bound to a 15 bp dsDNA fragment, which was not included in the modeling problem. The RuvB hexamer accommodates zero (T219/T1170), one (T220/H1171), or two (T221/H1172) RuvA molecules. Shown are all the resolved structures (one for T219/T1170, two for T220/H1171, and four for T221/H1172) superimposed onto the dsDNA segment. Chains A–F of the RuvB hexamer exhibit a tight, rigid interface near the dsDNA and a looser, flexible interface away from it. These interfaces are grouped to a tight “super” interface T219.1 (A:B and B:C), an intermediate “super” interface T219.2 (C:D and A:F) and a loose “super” interface T219.3 (D:E and E:F) (see text). The interface definitions are the same for T220 and T221. These nine interfaces are grouped together in AU219. The binding of a RuvA molecule (chains G and H) to a RuvB monomer form interfaces T220.4 (and T221.4) grouped into AU220.
FIGURE 7
FIGURE 7
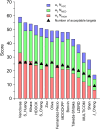
Performance of CASP and CAPRI predictor groups and prediction servers. The main graph shows the CAPRI performance scores of the top‐ranking CASP and CAPRI predictor and server groups in the CASP15‐CAPRI challenge evaluated here, broken off at the 70th group in the rank; server groups are listed in capital letters. The smaller graph shows the same plot for CASP and CAPRI predictor and server group 2 years earlier in the CASP14‐CAPRI assembly prediction challenge, broken off at the 23rd group. For both graphs, the height of each colored bar corresponds to the CAPRI score contributions of high, medium, or acceptable‐quality models. The total number of assessment units (AUs) for which at least an acceptable quality model was produced is indicated in the graph by a black triangle. CASP15‐CAPRI counted 38 AUs for 37 targets, CASP14‐CAPRI counted 16 AUs for 12 targets.
FIGURE 8
FIGURE 8
Performance of CAPRI scorer groups and scoring servers. CAPRI performance scores for all scorer groups, with scoring servers listed in capital letters. Legend as in Figure 7.
FIGURE 9
FIGURE 9
Global overview of performance for the 38 AUs (37 targets) of Round 54. Distribution of DockQ values of all the submissions of the Predictor ‐human and server groups‐ (purple; CASP and CAPRI; 5 models max), CAPRI Uploader groups (green; 100 models max), and Scorer groups (salmon; 10 models max). The best AF2‐M submission was taken as the standard for off‐the‐bench tools and is indicated by a red triangle. The box plots follow the matplotlib 3.1.2 defaults, with boxes from the first to the third quartile and a line at the median; whiskers are located at the upper resp. lower quartile plus or minus 1.5 the interquartile range and flier points are those outside the whiskers. The lower horizontal axis indicates the CAPRI ID and the upper horizontal axis the target CASP ID.
FIGURE 10
FIGURE 10
fnat (interface recall) as a function of S‐rms (side‐chain rms). Each point in the Figure represents the best model of a predictor group for an individual interface of a specific target, color‐coded according to model quality; incorrect and acceptable models are excluded. The top panel shows the data for targets of CASP14/CAPRI Round 50, the bottom panel for CASP15/CAPRI Round 54. The regions outlined by the short‐dashed and long‐dashed lines feature the best models, with medium‐quality models showing an S‐rms below 3.5 Å and fnat above 30%, and high‐quality models showing an S‐rms below 2.0 Å and an fnat above 60%. Some interfaces feature S‐rms values below 1.0 Å; those all belong to T203.1 (interface 1 of targets T203). The inset shows the interface of the model with the lowest S‐rms, produced by GuijunLab (target chains in red and orange, prediction chains in teal blue and marine blue; non‐interface residues in dark gray and light gray for target and prediction, respectively); interface residues—those that have any atom within 5 Å of the other chain—are shown in wireframe.

References

    1. Alberts B. The cell as a collection of protein machines: preparing the next generation of molecular biologists. Cell. 1998;92(3):291‐294. - PubMed
    1. Barabasi AL, Gulbahce N, Loscalzo J. Network medicine: a network‐based approach to human disease. Nat Rev Genet. 2011;12(1):56‐68. - PMC - PubMed
    1. Ideker T, Sharan R. Protein networks in disease. Genome Res. 2008;18(4):644‐652. - PMC - PubMed
    1. Berman H, Henrick K, Nakamura H. Announcing the worldwide Protein Data Bank. Nat Struct Biol. 2003;10(12):980. - PubMed
    1. Bai XC, McMullan G, Scheres SH. How cryo‐EM is revolutionizing structural biology. Trends Biochem Sci. 2015;40(1):49‐57. - PubMed

Publication types