. 2023 Dec 8;8(23):e170105.
doi: 10.1172/jci.insight.170105.

Diabetes-associated breast cancer is molecularly distinct and shows a DNA damage repair deficiency

Affiliations

Diabetes-associated breast cancer is molecularly distinct and shows a DNA damage repair deficiency

Gatikrushna Panigrahi et al. JCI Insight. .

Abstract

Diabetes commonly affects patients with cancer. We investigated the influence of diabetes on breast cancer biology using a 3-pronged approach that included analysis of orthotopic human tumor xenografts, patient tumors, and breast cancer cells exposed to diabetes/hyperglycemia-like conditions. We aimed to identify shared phenotypes and molecular signatures by investigating the metabolome, transcriptome, and tumor mutational burden. Diabetes and hyperglycemia did not enhance cell proliferation but induced mesenchymal and stem cell-like phenotypes linked to increased mobility and odds of metastasis. They also promoted oxyradical formation and both a transcriptome and mutational signatures of DNA repair deficiency. Moreover, food- and microbiome-derived metabolites tended to accumulate in breast tumors in the presence of diabetes, potentially affecting tumor biology. Breast cancer cells cultured under hyperglycemia-like conditions acquired increased DNA damage and sensitivity to DNA repair inhibitors. Based on these observations, we conclude that diabetes-associated breast tumors may show an increased drug response to DNA damage repair inhibitors.

Keywords: Breast cancer; Diabetes; Metabolism; Oncology.


Conflict of interest statement

Conflict of interest: The authors have declared that no conflict of interest exists.

Figures

Figure 1
Figure 1. Hyperglycemia induces robust metabolite alterations in tumor xenografts.
(A) Unsupervised PCA using the metabolite data obtained from xenografts grown in diabetic (_D) and nondiabetic mice (_ND). The plot shows data points for each of the MDA-MB-231, MDA-MB-468, and Hs578T xenografts and highlights the separation by diabetes status. (B) Heatmaps emphasizing the difference in intratumor metabolite abundance between diabetic and nondiabetic xenografts (FDR cutoff < 0.3 for inclusion of differential metabolites). The plots show the data from MDA-MB-231, MDA-MB-468, and Hs578T xenografts. (C) Venn diagram with 71 metabolites with levels altered by diabetes across MDA-MB-231, MDA-MB-468, and Hs578T xenografts (FDR < 0.05). Fifty-three of them were consistently upregulated, and 14 were downregulated in all xenografts of diabetic mice. (D) Intratumor levels of the diabetes markers, glucose, and 1,5 anhydroglucitol (1,5 AG), in MDA-MB-231, MDA-MB-468, and Hs578T xenografts by diabetes status. Data represent mean ± SD of log transformed relative abundance levels (n = 4 each group), with Student’s t test for significance testing.
Figure 2
Figure 2. A distinct transcriptome profile in breast tumors of patients with diabetes.
(A) Heatmap highlighting the difference in gene expression for breast tumors from diabetic (yes) and nondiabetic (no) patients (FDR < 0.05 for inclusion of differentially expressed transcripts, covariate adjusted). (B) Enrichment of differentially expressed genes (diabetic versus nondiabetic, covariate adjusted) in GSEA Hallmark gene sets (FDR < 0.25). The y axis represents the enriched gene sets (either positive or negative), and the x axis represents the normalized enrichment scores (NES) for each gene set. (C) Enrichment of differentially expressed genes (diabetic versus nondiabetic, covariate adjusted) in GSEA KEGG gene sets (FDR < 0.25). Red boxes highlight key pathways that are altered by diabetes and described in the text.
Figure 3
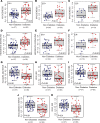
Figure 3. Activity scores of key pathways altered in breast tumors of patients with diabetes.
(AF) Myogenesis and hedgehog signaling score in either all, ER+, or ER tumors by diabetes status. (GK) Hallmark DNA repair (G), KEGG Base Excision Repair pathway (BER) score (H), KEGG Homologous Recombination (I), KEGG Mismatch Repair (J), and KEGG Nucleotide Excision Repair (NER) pathway scores (K) in breast tumors by diabetes status. (AK) Single-sample pathway scores were obtained from ssGSEA with adjustments for covariates (age, BMI, race, stage, and ER status). The significance of the diabetes status in influencing the activity scores was assessed via multivariable linear regression to control for covariates.
Figure 4
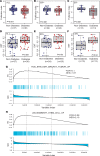
Figure 4. Diabetes and hyperglycemia promote mesenchymal and stem cell differentiation.
(AC) Tumor proliferation index in ER+ and ER breast tumors by diabetes status. Significance testing with Wilcoxon’s rank-sum test. (DF) Hallmark-annotated EMT pathway scores (ssGSEA based and covariate adjusted) in ER+ and ER tumors by diabetes status; Wilcoxon’s test was used. (G) Enrichment of differentially expressed genes (diabetic versus nondiabetic; covariate adjusted) in GSEA gene set HOLLERN_EMT_BREAST_TUMOR_UP. Signature is up with diabetes. (H) Enrichment of differentially expressed genes (diabetic versus nondiabetic; covariate-adjusted) in GSEA gene set LIM_MAMMARY_STEM_CELL_UP. Signature is up with diabetes.
Figure 5
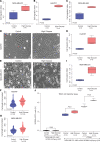
Figure 5. Hyperglycemia induces breast cancer cell migration, invasion, and stemness.
(AC) Migration of breast cancer cells (MDA-MB-231, Hs578T, MDA-MB-468) under hyperglycemia. Shown are data for the 24-hour time point. Data represent mean ± SD of 4 replicates; Student’s t test was used. (D and E) Hs578T and MDA-MB-231 cells cultured under hyperglycemia develop an elongated morphology. Total original magnification, ×200. The scale bar is 100 µm. (F and G) Quantitative analysis of the elongated cell morphology in Hs578T and MDA-MB-231 cells cultured under hyperglycemia using the ImageJ software (NIH). Data represent average length of 100 cells from 5 different representative areas in each group; Wilcoxon’s test was used. (H) Matrigel invasion by Hs578T breast cancer cells under hyperglycemia. Shown are data for the 24-hour time point. Data represent mean ± SD of 5 replicates; Student’s t test was used. (I) Matrigel invasion by MDA-MB-231 breast cancer cells under hyperglycemia. Shown are data for the 24-hour time point. Data represent mean ± SD of 5 replicates; Student’s t test was used. (J) MDA-MB-231-LM2 cells harboring a stemness reporter were cultured with or without hyperglycemia. Number of SORE6+ cells among cultured MDA-MB-231-LM2-SORE6-mcherry breast cancer cells exposed to either 5 mM glucose (control) or hyperglycemia (25 mM glucose) for 48 hours. Hyperglycemia increases the number of SORE6+ cells, which is indicative of increased stemness. Addition of the positive control compound, TRULI, a Lats1/2 kinase inhibitor, increases the stemness signal. We did not observe SORE6+ cells among the control vector cells (MDA-MB-231-LM2-mCMV-mcherry) when cultured with or without 25 mM glucose. Data represent mean ± SD; Student’s t test was used for statistical analysis.
Figure 6
Figure 6. Hyperglycemia induces oxidative stress in breast cancer cells.
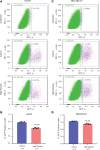
(AD) FACS analysis shows increased mitochondrial superoxide production (with MitoSOX) in breast cancer cells cultured under hyperglycemia. Shown are representative flow cytometry experiments for the Hs578T (A) and MDA-MB-231 (C) cell lines. There is a shift toward increased MitoSOX under hyperglycemia. Quantification of FACS analysis data for Hs578T and MDA-MB-231 cells are shown in B and D, respectively. MitoSOX fluorescence compared control versus hyperglycemia with 5 repeats; Student’s t test was used. For normalization and display, we set control values as 1. (EH) Superoxide radical scavenger, Mitotempo (200 μM), inhibits hyperglycemia-induced migration of Hs578T and MDA-MB-231 cells. Each time point shows mean ± SD of 4 replicates. ANOVA with post hoc test for statistical analysis. *P < 0.05, **P < 0.01, ***P < 0.001.
Figure 7
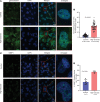
Figure 7. Hyperglycemia induces DNA damage in breast cancer cells.
(A) Representative immunofluorescence images of γH2AX staining in Hs578T cells under hyperglycemia. Scale bar: 20 μm for γH2AX, DAPI, and merged images. Original magnification for the enlarged image is 25×. (B) Quantification of γH2AX in Hs578T cells comparing control versus hyperglycemia using ImageJ software. Data show mean ± SD of normalized fluorescence from 50 nuclei taken from 5 different areas for each group; Student’s t test was used for significance testing. (C) Representative immunofluorescence images of 53BP1 staining in Hs578T cells under hyperglycemia. Scale bar: 20 μm. Original magnification for the enlarged image is 25×. (D) Quantification of 53BP1 in Hs578T cells comparing control versus hyperglycemia using ImageJ software. Data represent mean ± SD of the average percentage of localized 53BP1 expression in positive nuclei in each group, using n = 5 images from each group and Student’s t test.
Figure 8
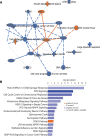
Figure 8. Diabetes affects DNA repair capacity, shown by IPA.
IPA with 461 genes whose expression is commonly altered by diabetes/hyperglycemia in both patient tumors and xenografts. (A) Summary graph of the IPA indicates activation of DNA damage signaling like “Formation of gamma H2AX nuclear focus” in the presence of diabetes. Blue indicates “inhibition” and orange indicates “activation” of a process. (B) Pathway enrichment analyses in IPA. Blue indicates “inhibition” and orange indicates “activation” of a pathway/process by diabetes. “Role of BRCA1 in DNA damage response” is the top pathway indicated to be inhibited by diabetes.
Figure 9
Figure 9. Hyperglycemia impairs DNA repair capacity in breast cancer cells.
(AD) Decreased NHEJ DNA repair capacity under hyperglycemia. Breast cancer cells (Hs578T and MDA-MB-231) cultured under high glucose showed a decrease in the nonhomologous end joining (NHEJ) DNA repair capacity, as measured by a reporter assay. A decrease in GFP+ cells in the high-glucose groups corresponds to a decrease in DNA repair capacity. A and C represent the FACS analysis of Hs578T and MDA-MB-231 cells, respectively. The graphs show the quantification of FACS analysis-based data for Hs578T and MDA-MB-231 cells in B and D, respectively. Data represent mean ± SD of the percent of GFP+ cells comparing hyperglycemia (25 mM glucose) versus control (5 mM glucose, n = 4 each), with significance testing by Student’s t test.
Figure 10
Figure 10. Hyperglycemia increases sensitivity to drugs targeting the DNA damage repair pathway.
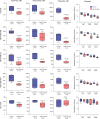
Increased sensitivity of 5 human breast cancer cell lines to DNA damage repair inhibitors under hyperglycemia. Shown are the IC50 values as nM concentrations for AZD7762, berzosertib, and etoposide comparing cells cultured under control conditions (5 mM glucose) versus high glucose (25 mM glucose [hyperglycemia]). Panel at the right shows the sensitivity to 1, 10, and 20 μM concentrations of olaparib comparing control versus high glucose with normalized BrdU incorporation (absorbance at 370 nm) as a readout. Cell viability was measured with the BrdU incorporation assay. Data are shown as mean ± SD, with Wilcoxon’s rank-sum test used for significance testing.
Figure 11
Figure 11. Mutational signatures in patients with breast cancer with diabetes.
(A) Mutational trinucleotide frequency distribution in breast tumors from patients without diabetes (ND, top), with diabetes developing after the tumor resection (pre-D, center), and with diabetes at the time of tumor resection (D, bottom). Due to strand complementarity, 2 equivalent sets of annotations are possible, either based on the substitution of purines (blue) or pyrimidines (red). There are no obvious differences by diabetes status. (B) Heatmap showing signature age-adjusted weights by diabetes status (top bar) obtained from nonnegative least squares mapping of individual samples (columns) versus reference signatures (rows) from the COSMIC catalogs and the Compendium of Mutational Signatures of Environmental Agents. Yellow indicates upregulation of a signature in a sample. D, n = 38; pre-D, n = 7; ND, n = 71.
Figure 12
Figure 12. Mutational landscape of patients with breast cancer with diabetes.
Oncoplot showing 17 mutated genes (rows) across 116 subjects (columns) split by diabetes status. Within each group, individuals were ordered in waterfall fashion. Included genes are those mutated in > 5% of the samples. Diabetic, n = 38; diabetic after surgery, n = 7; nondiabetic, n = 71. Post-coll, patients developed diabetes after tumors were collected.

References

    1. Sarfati D, et al. The impact of comorbidity on cancer and its treatment. CA Cancer J Clin. 2016;66(4):337–350. doi: 10.3322/caac.21342. - DOI - PubMed
    1. Renzi C, et al. Comorbid chronic diseases and cancer diagnosis: disease-specific effects and underlying mechanisms. Nat Rev Clin Oncol. 2019;16(12):746–761. doi: 10.1038/s41571-019-0249-6. - DOI - PubMed
    1. Panigrahi G, Ambs S. How comorbidities shape cancer biology and survival. Trends Cancer. 2021;7(6):488–495. doi: 10.1016/j.trecan.2020.12.010. - DOI - PMC - PubMed
    1. Zhao XB, Ren GS. Diabetes mellitus and prognosis in women with breast cancer: a systematic review and meta-analysis. Medicine (Baltimore) 2016;95(49):e5602. doi: 10.1097/MD.0000000000005602. - DOI - PMC - PubMed
    1. Shao S, et al. Diabetes and overall survival among breast cancer patients in the U.S. Military Health System. Cancer Epidemiol Biomarkers Prev. 2018;27(1):50–57. doi: 10.1158/1055-9965.EPI-17-0439. - DOI - PMC - PubMed

Publication types