. 2024 Jan 2;134(1):e157165.
doi: 10.1172/JCI157165.

Single-cell transcriptomics and chromatin accessibility profiling elucidate the kidney-protective mechanism of mineralocorticoid receptor antagonists

Affiliations

Single-cell transcriptomics and chromatin accessibility profiling elucidate the kidney-protective mechanism of mineralocorticoid receptor antagonists

Amin Abedini et al. J Clin Invest. .

Abstract

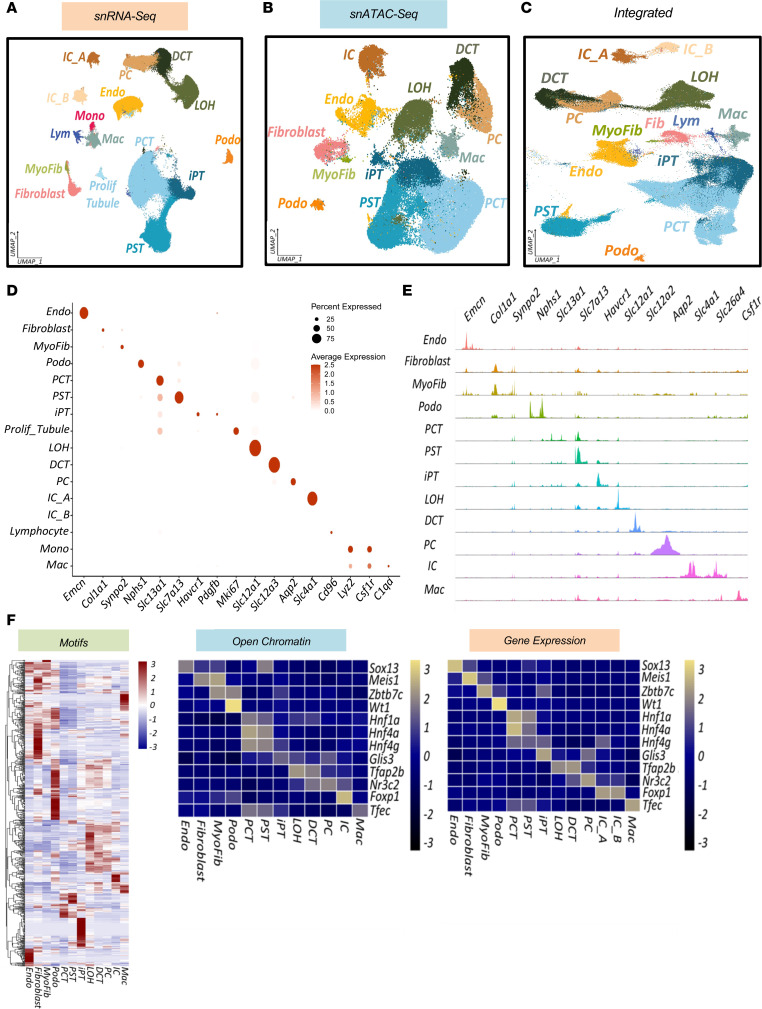
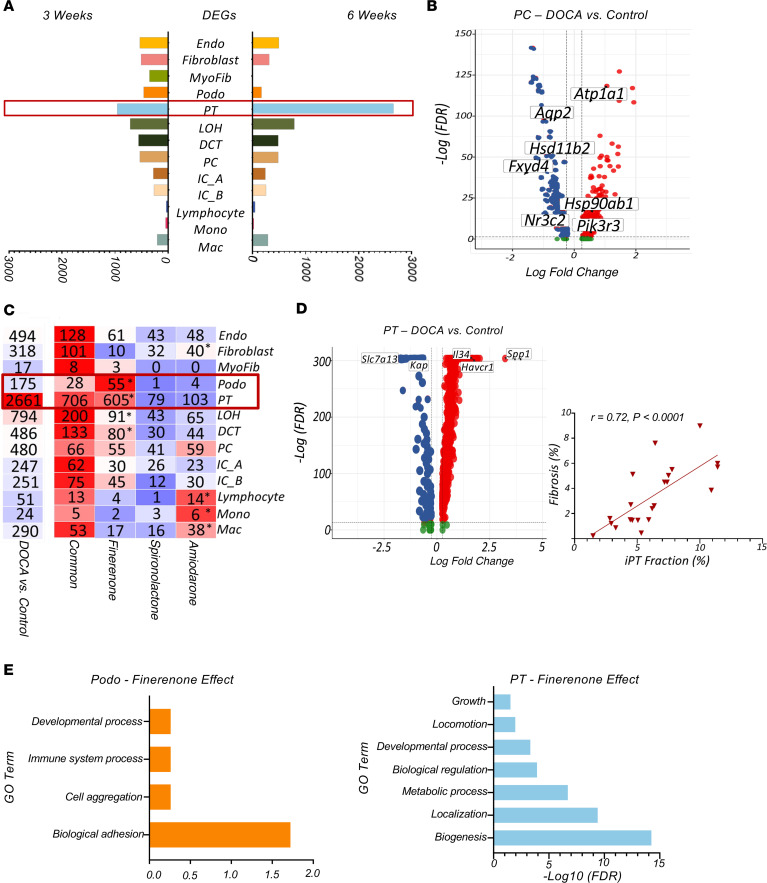
Mineralocorticoid excess commonly leads to hypertension (HTN) and kidney disease. In our study, we used single-cell expression and chromatin accessibility tools to characterize the mineralocorticoid target genes and cell types. We demonstrated that mineralocorticoid effects were established through open chromatin and target gene expression, primarily in principal and connecting tubule cells and, to a lesser extent, in segments of the distal convoluted tubule cells. We examined the kidney-protective effects of steroidal and nonsteroidal mineralocorticoid antagonists (MRAs), as well as of amiloride, an epithelial sodium channel inhibitor, in a rat model of deoxycorticosterone acetate, unilateral nephrectomy, and high-salt consumption-induced HTN and cardiorenal damage. All antihypertensive therapies protected against cardiorenal damage. However, finerenone was particularly effective in reducing albuminuria and improving gene expression changes in podocytes and proximal tubule cells, even with an equivalent reduction in blood pressure. We noted a strong correlation between the accumulation of injured/profibrotic tubule cells expressing secreted posphoprotein 1 (Spp1), Il34, and platelet-derived growth factor subunit b (Pdgfb) and the degree of fibrosis in rat kidneys. This gene signature also showed a potential for classifying human kidney samples. Our multiomics approach provides fresh insights into the possible mechanisms underlying HTN-associated kidney disease, the target cell types, the protective effects of steroidal and nonsteroidal MRAs, and amiloride.

Keywords: Chronic kidney disease; Genetics; Molecular genetics; Nephrology.


Conflict of interest statement

Conflict of interest: HC and PK are employees of Bayer AG, Pharmaceuticals.

Figures

Figure 1
Figure 1. MRAs protect against DOCA-salt–induced cardiorenal damage.
(A) Study overview. Rats were divided into 5 treatment groups: sham; DOCA plus vehicle; DOCA plus finerenone; DOCA plus spironolactone; and DOCA plus amiloride. UNX, uninephrectomized. (B) Clinical and biochemical parameters in the experimental rat groups, including SBP and DBP, BUN, creatinine (Cr), urinary albumin creatinine ratio (UACR), kidney-to-heart weight ratio, and renal fibrosis. The x axis shows the weeks following the surgery, and the y axis shows the measurement values. One-way ANOVA was used to compare all groups, and the 2-tailed Student’s t test was used to compare each group with the DOCA-salt group. For statistical comparison, log-transformed data were used to determine the UACR. *P < 0.05 and **P < 0.01, for differences in the parameters measured between sham-, finerenone-, spironolactone-, and amiloride-treated rats compared with DOCA-treated rats as follows: Error bars indicate the SEM. (C) Representative H&E-stained kidney and heart sections from animals in the experimental groups. Scale bars: 100 μm (heart); 100 μm (kidney) and 50 μm (kidney, enlarged insets). Original magnification, ×20. (D) Representative Picrosirius red staining of kidney sections from animals in the experimental groups. Scale bars: 100 μm. Original magnification, ×20.
Figure 2
Figure 2. The single-cell multiomics landscape of healthy and diseased rat kidneys.
(A) UMAP of 310,218 rat kidney snRNA-Seq data. (B) UMAP of 53,298 rat kidney snATAC-Seq data. (C) UMAP of integrated snRNA-Seq and snATAC-Seq of rat kidneys. (D) Bubble dot plots of marker genes used for cell-type annotation in the snRNA-Seq. The size of the dot indicates the percentage of positive cells, and the darkness of the color indicates the average expression. (E) Fragment coverage (frequency of Tn5 insertion) in each snATAC-Seq cluster at the cell-type marker gene promoter site. (F) Heatmap of average chromVAR motif activity for each cell type (far left panel). The color scale shows the z score scaled by row. Chromatin accessibility and gene expression of representative motifs of each cluster are shown in the middle and right panels, respectively. The color scheme of the heatmap is based on z score distribution. Each row represents a gene, and each column represents a cell type. Endo, endothelial cells; MyoFib, myofibroblasts; Podo, podocytes; Prolif_Tubule, proliferative tubule cells; Mono, monocytes; Mac, macrophages.
Figure 3
Figure 3. MR target cell types and gene-regulatory network in rat kidneys.
(A) Feature plots of open chromatin, motif in open chromatin, and gene expression of Nr3c2 (MR), and Nr3c1 (GR), MR target genes, and GR target genes. Expression levels of MR target genes and GR target genes are based on the mean expression in each cell type. (B) Bubble plots of open chromatin, motif, and gene expression of Nr3c2 (MR) and Nr3c1 (GR), including their target genes, with the mean expression displayed for each cell type. (C) Bubble dot plots of mineralocorticoid target genes and the GR (Nr3c1) in the snRNA-Seq data set before and after subclustering of DCT and PC cells. The size of the dots indicates the percentage of positive cells, and the darkness of the color indicates average expression. (D) Schematic of MR target genes affected by DOCA in the DOCA-salt rat nephropathy model. Genes are colored blue (lower expression), red (higher expression), or white (unchanged expression). Notably, Atp1a1 and Atp1b1 showed increased expression, whereas Hsd11b2 expression was lower in all cells. Pik3r3 expression was higher in PC cells. ENaC genes (Scnn1a, Scnn1b, Scnn1g), Wnk1, and Aqp2 showed decreased expression. ROMK, renal outer medullary potassium channel; Nox4, NADPH oxidase 4.
Figure 4
Figure 4. MRA and amiloride target genes, cell types, and pathways.
(A) Number of DEGs between DOCA-treated and control groups in all kidney cell types 6 weeks and 3 weeks after DOCA administration. (B) Volcano plot of DEGs between the DOCA and control groups in PC cells at 6 weeks on DOCA. (C) Number of DEGs between control and DOCA groups in each cell type. The number of genes was normalized by all drugs or by the specific drugs finerenone, spironolactone, or amiloride. The color indicates a heatmap, more DEGs are in red, fewer in blue. Asterisks indicate significant DEG differences (normalized genes), calculated using the χ2 test (P < 0.05). (D) Upper panel shows a volcano plot of DEGs between the DOCA and control groups in PT cells at 6 weeks on DOCA. Lower panel shows the correlation between iPT fractions and renal fibrosis in all samples using Pearson’s correlation. (E) GO analysis of the genes affected by finerenone in podocytes and PT cells using DAVID. The enriched pathway is shown by the –log (FDR) of each pathway.
Figure 5
Figure 5. Genome-wide gene expression changes in whole-kidney samples from DOCA-treated rats given MRAs.
(A) Number of DEGs between DOCA-treated and control groups by bulk RNA-Seq analysis. (B) Enrichment of genes showing lower expression with DOCA in PST cells in the snRNA-Seq and snATAC-Seq data sets. The color scheme of the heatmap is based on z score distribution. Each row represents a gene, and each column represents a cell type. Yellow indicates cell-type–enriched genes. (C) Expression of 25 genes showing higher or lower expression levels in DOCA versus control groups in the bulk RNA-Seq data set. The color scheme of the heatmap is based on z score distribution. Each row represents a gene, and each column represents a rat sample. Black and red colors indicate control and DOCA-treated rats, respectively. (D) Volcano plot of DEGs between DOCA and control groups in the bulk RNA-Seq data. (E) Cell-type expression (snRNA-Seq and snATAC-Seq) of the top upregulated DEGs in DOCA versus control groups identified in the bulk analysis. The color scheme of the heatmap is based on z score distribution; yellow indicates higher expression, while blue indicates lower expression. Each row represents a gene, and each column represents a cell type.
Figure 6
Figure 6. Principal cells and PT cells are the main target of mineralocorticoids and MRAs.
(A) Overview of the tensor decomposition analysis. All rat samples were included in the analysis. (B) Sample score heatmap for decomposition of the snRNA-Seq data showing each sample and its loading score for each factor (lower panel). Colors on the right indicate sample groups. Colors in the bottom of the heatmap indicate each identified factor and its association with phenotypes. Each row represents a phenotype, and the color indicates the P value for the factor and phenotype association using univariate linear model F tests (upper panel). Two samples were filtered by the analysis. (C) Heatmaps showing the cell type gene loading scores of genes in factors 1 and 4. Some of the genes are highlighted. (D) Single-nucleus WGCNA of PC, PST, and iPT cells identified gene expression modules in cell types (top panel). The top representative genes in each cell-type–specific module are highlighted. Bubble plots indicate gene expression levels of the genes in each module in each cell type (middle panel) calculated by the average expression of all genes in a module in a specific cell type. The lower panel shows the module scores per condition for each cell type.
Figure 7
Figure 7. Cellular trajectory of PST and iPT cells highlights Spp1, Il34, and Pdgfb.
(A) (Left panel) UMAP representations of PT cell subclustering and iPT cell differentiation trajectory from PST cells in snRNA-Seq. Cells are colored according to pseudotime, and the arrow indicates the direction of the pseudotime. (Right panel) UMAP representations of gene expression of Spp1, Il34, and Pdgfb during trajectory (red dots indicate the expression of each gene in the cells). (B) (Left panel) UMAP representations of PT cell subclustering and iPT cell differentiation trajectory from PST cells in snATAC-Seq. Cells are colored according to pseudotime, and the arrow indicates the direction of the pseudotime. (Right panel) UMAP representations of gene activity of Spp1, Il34, and Pdgfb during trajectory (red dots indicate the gene activity calculated on the basis of chromatin accessibility). (C) Bubble dot plot of the expression of Spp1, Il34, and Pdgfb genes and their receptors Itgav, Cd44, Csf1, and Pdgfrb in different cell types and groups. The size of the dot indicates the percentage of positive cells, and the darkness of the color indicates average expression.
Figure 8
Figure 8. iPT cell signature can classify disease severity in human diabetic and hypertensive kidney tissue samples.
(A) Correlations with fibrosis between SPP1, IL34, and PDGFB in microdissected human kidney tubule samples. The x axis represents normalized (log transcripts per million [TPM]) gene expression, and the y axis represents the fibrosis score (log-transformed). Each dot indicates 1 sample. Spearman’s test and correlation coefficient (r) as well as the regression line are shown in each plot. *P < 0.05, **P < 0.01, and ***P < 0.0001 (B) Schematic overview of the experiments. The homologous genes for the iPT gene signature in rats were used to cluster 991 human kidney microdissected tubules. (C) The 3 distinct human kidney clusters were identified on the basis of the iPT signature using hierarchical clustering. The 3 main clusters in the dendrogram are shown in different colors. Graphs represent the clinical information on samples from the 3 clusters. The χ2 test for nonparametric and 1-way ANOVA for parametric data were used for statistical comparisons. Error bars indicate the SD.

References

    1. Vart P, et al. National trends in the prevalence of chronic kidney disease among racial/ethnic and socioeconomic status groups, 1988-2016. JAMA Netw Open. 2020;3(7):e207932. doi: 10.1001/jamanetworkopen.2020.7932. - DOI - PMC - PubMed
    1. Qiu C, et al. Renal compartment-specific genetic variation analyses identify new pathways in chronic kidney disease. Nat Med. 2018;24(11):1721–1731. doi: 10.1038/s41591-018-0194-4. - DOI - PMC - PubMed
    1. Rhee CM, Kovesdy CP. Epidemiology: spotlight on CKD deaths—increasing mortality worldwide. Nat Rev Nephrol. 2015;11(4):199–200. doi: 10.1038/nrneph.2015.25. - DOI - PMC - PubMed
    1. [No authors listed] Addendum. 11. Microvascular complications and foot care: standards of medical care in diabetes-2021: Erratum for Diabetes Care 2021;44(Suppl. 1):S151–S167. Diabetes Care. 2021;44(9):2186–2187. doi: 10.2337/dc21-ad09b. - DOI - PubMed
    1. Bakris GL, et al. Effect of finerenone on chronic kidney disease outcomes in type 2 diabetes. N Engl J Med. 2020;383(23):2219–2229. doi: 10.1056/NEJMoa2025845. - DOI - PubMed

Publication types