. 2024 Jan 16;84(2):291-304.
doi: 10.1158/0008-5472.CAN-23-0184.

Metabolomic Rewiring Promotes Endocrine Therapy Resistance in Breast Cancer

Affiliations

Metabolomic Rewiring Promotes Endocrine Therapy Resistance in Breast Cancer

Songyeon Ahn et al. Cancer Res. .

Abstract

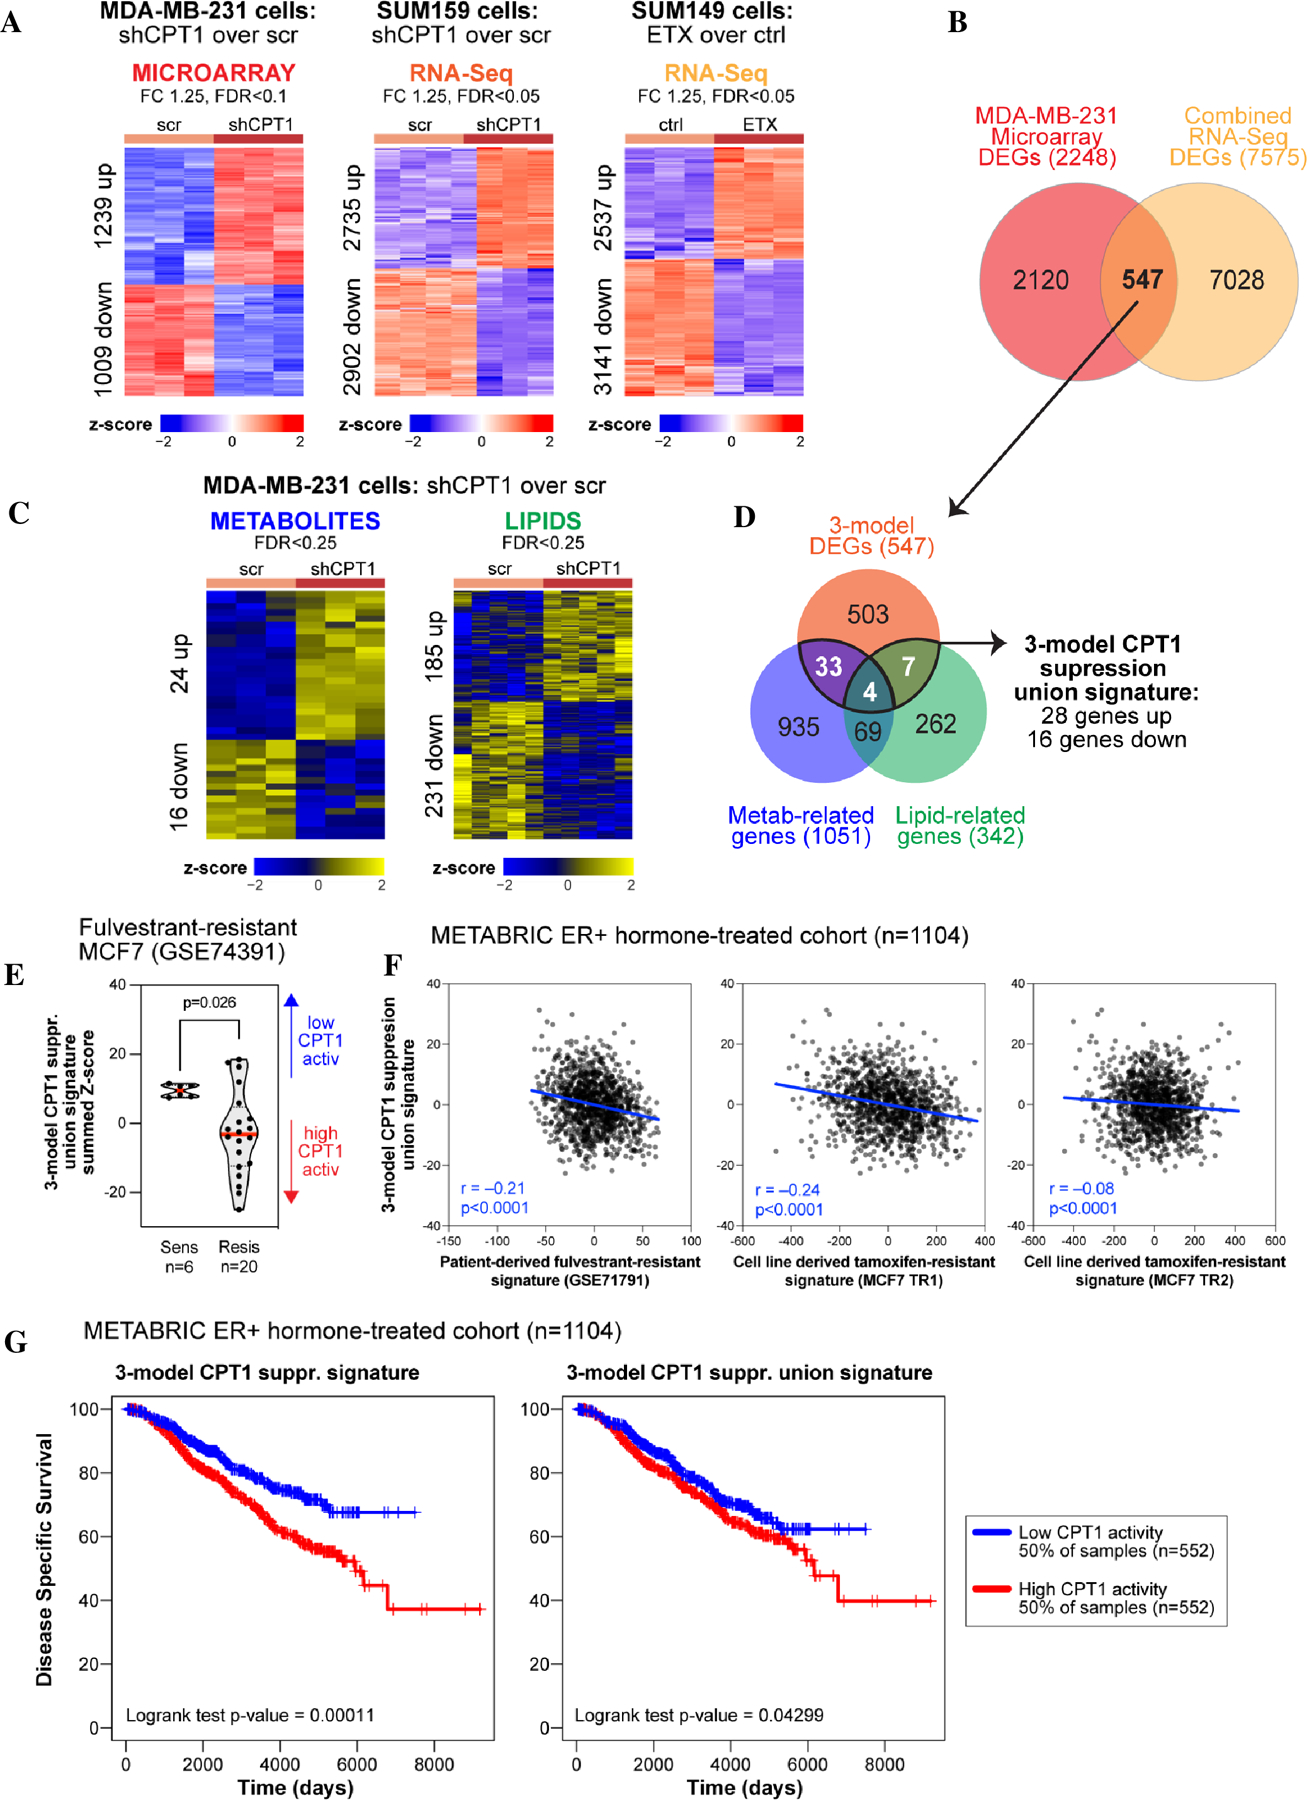
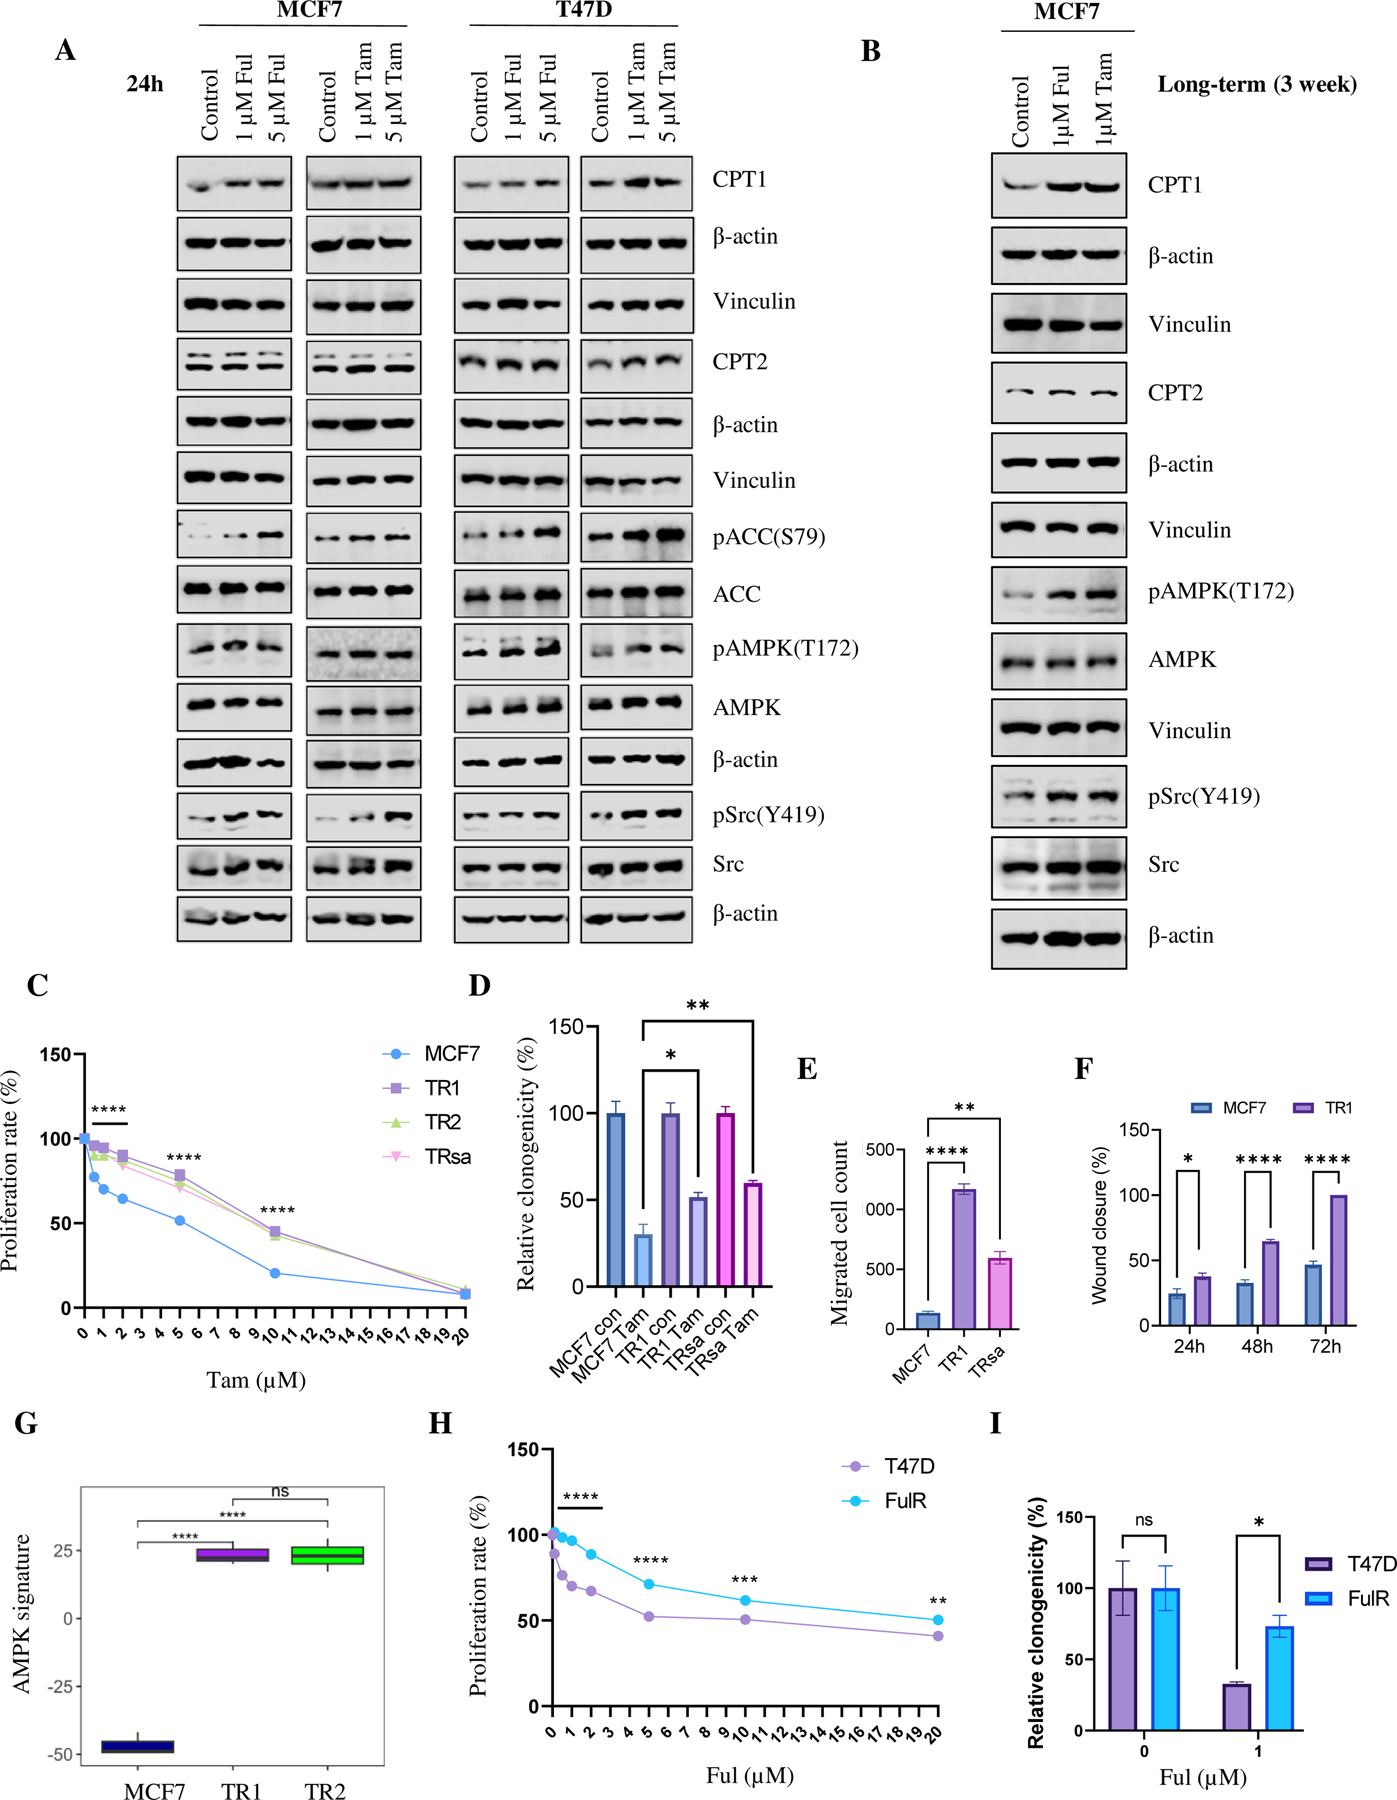
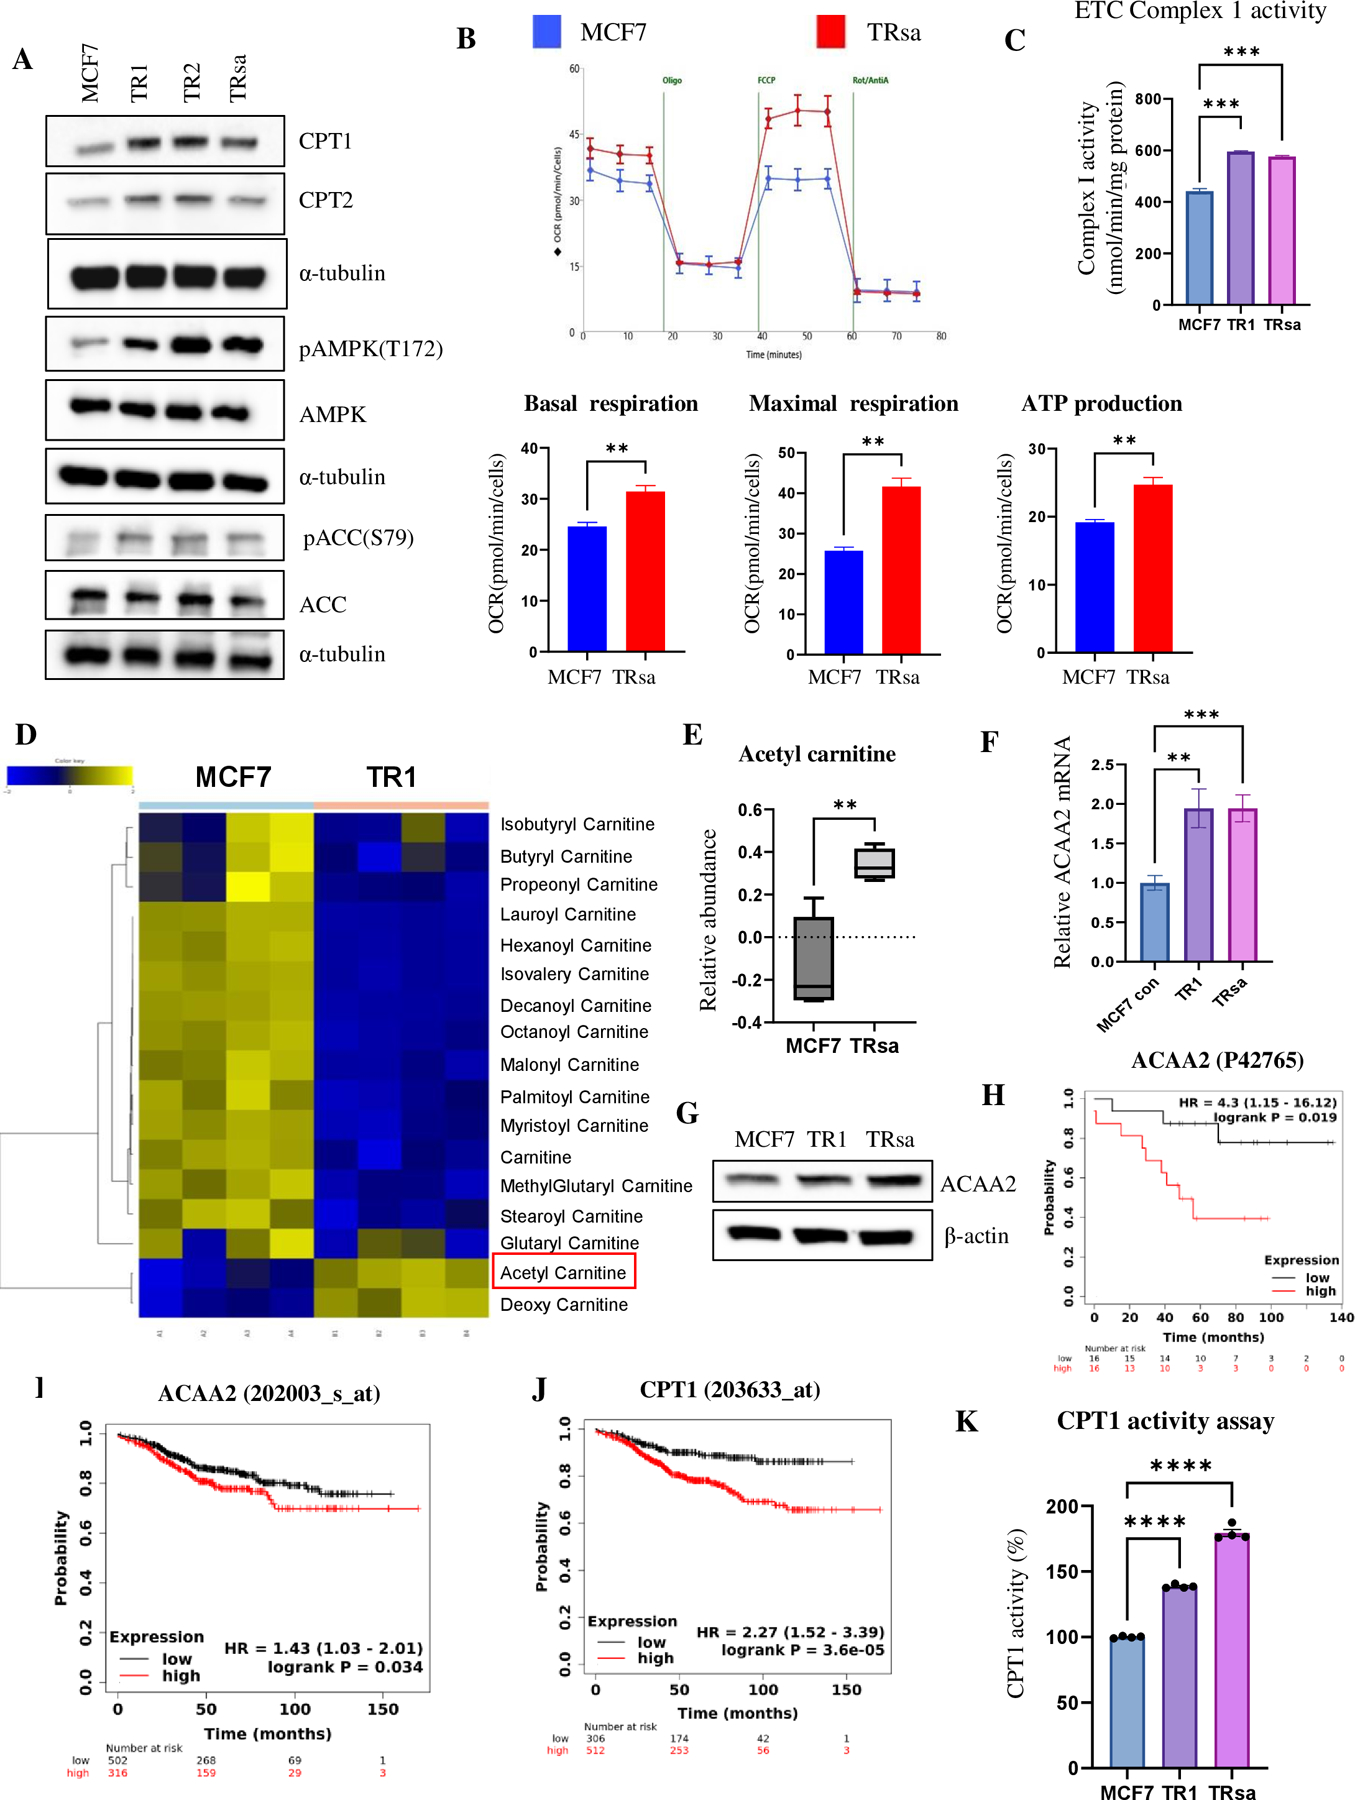
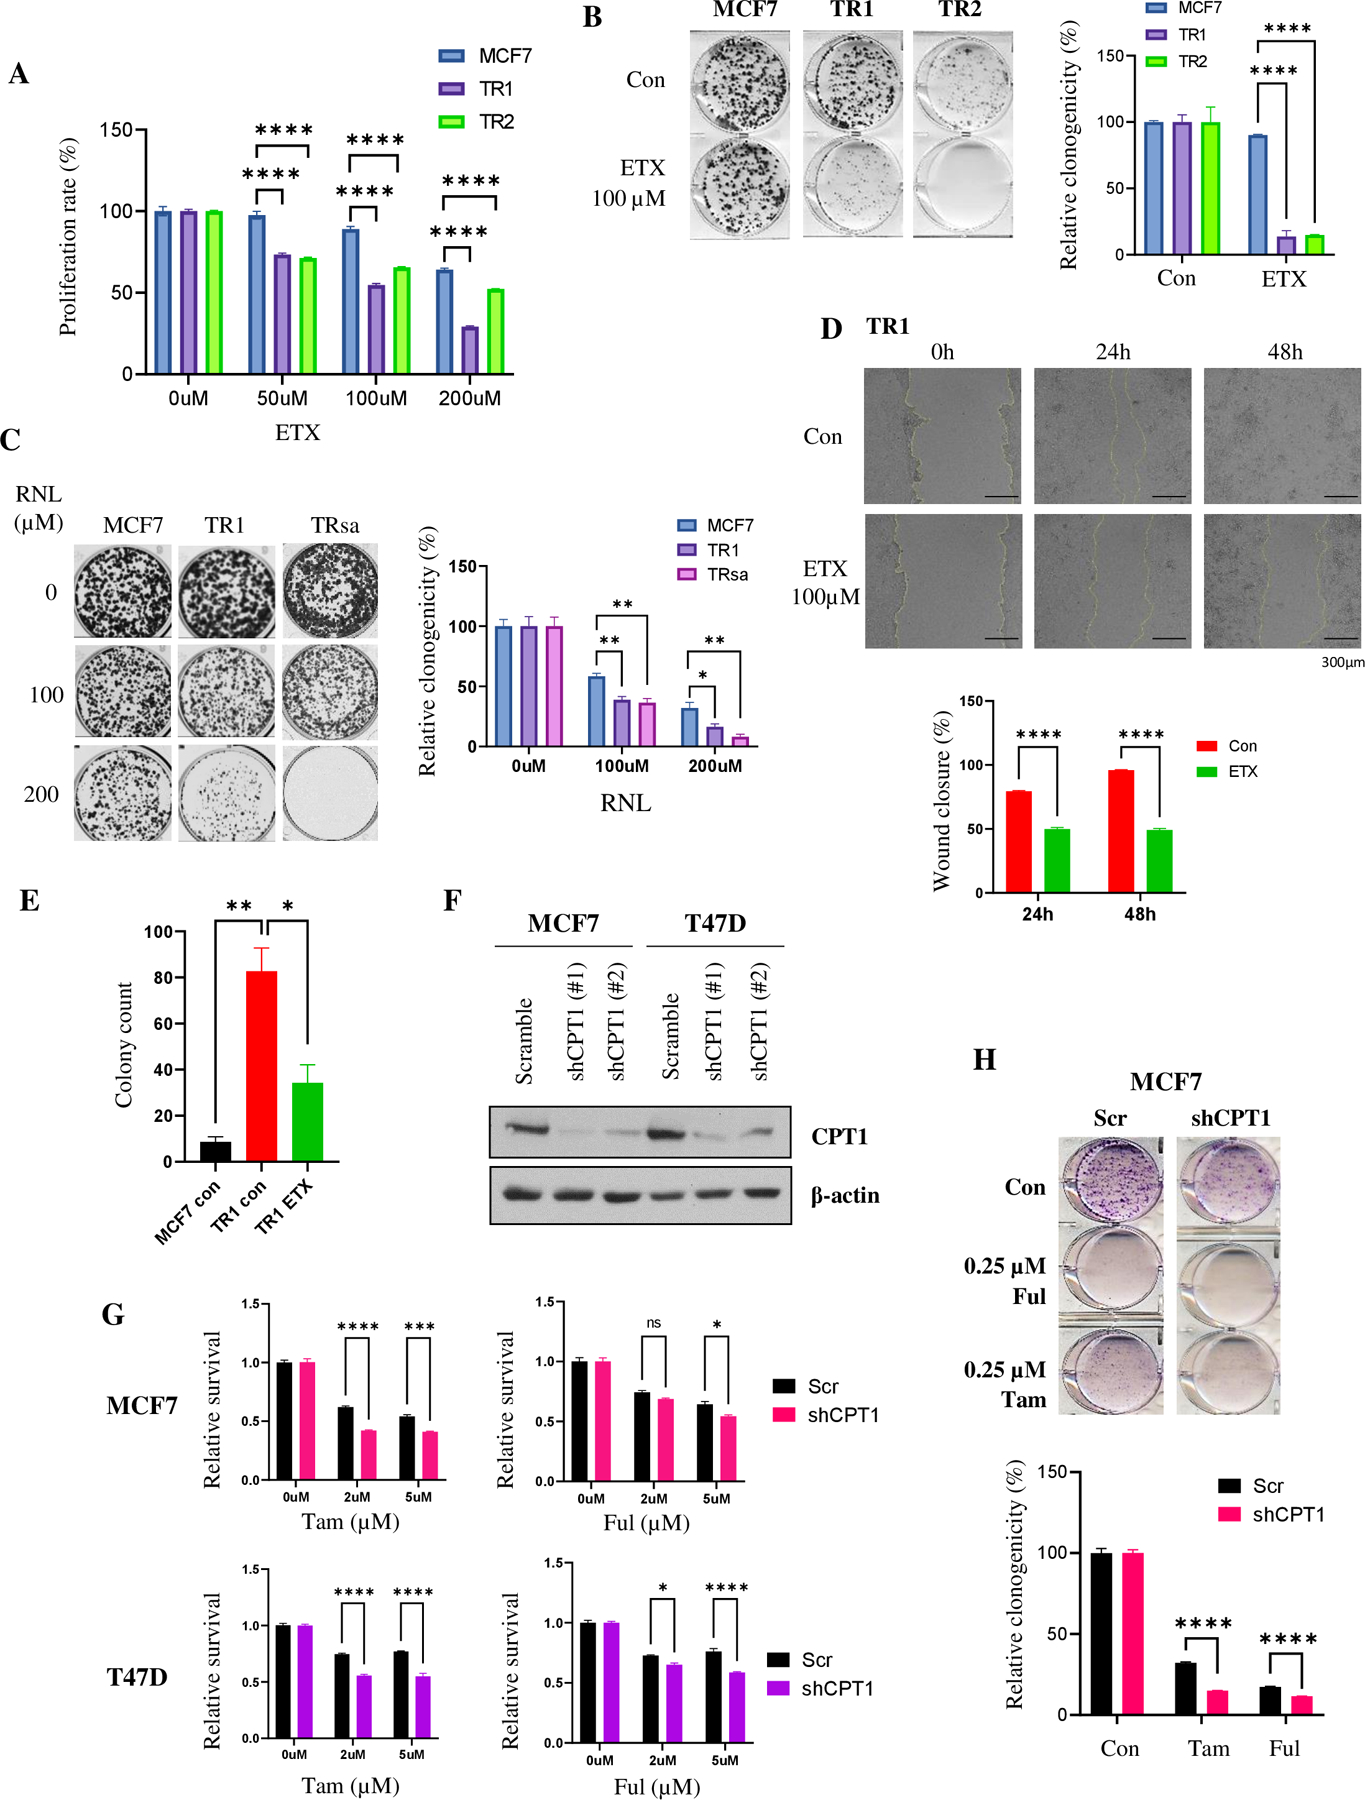
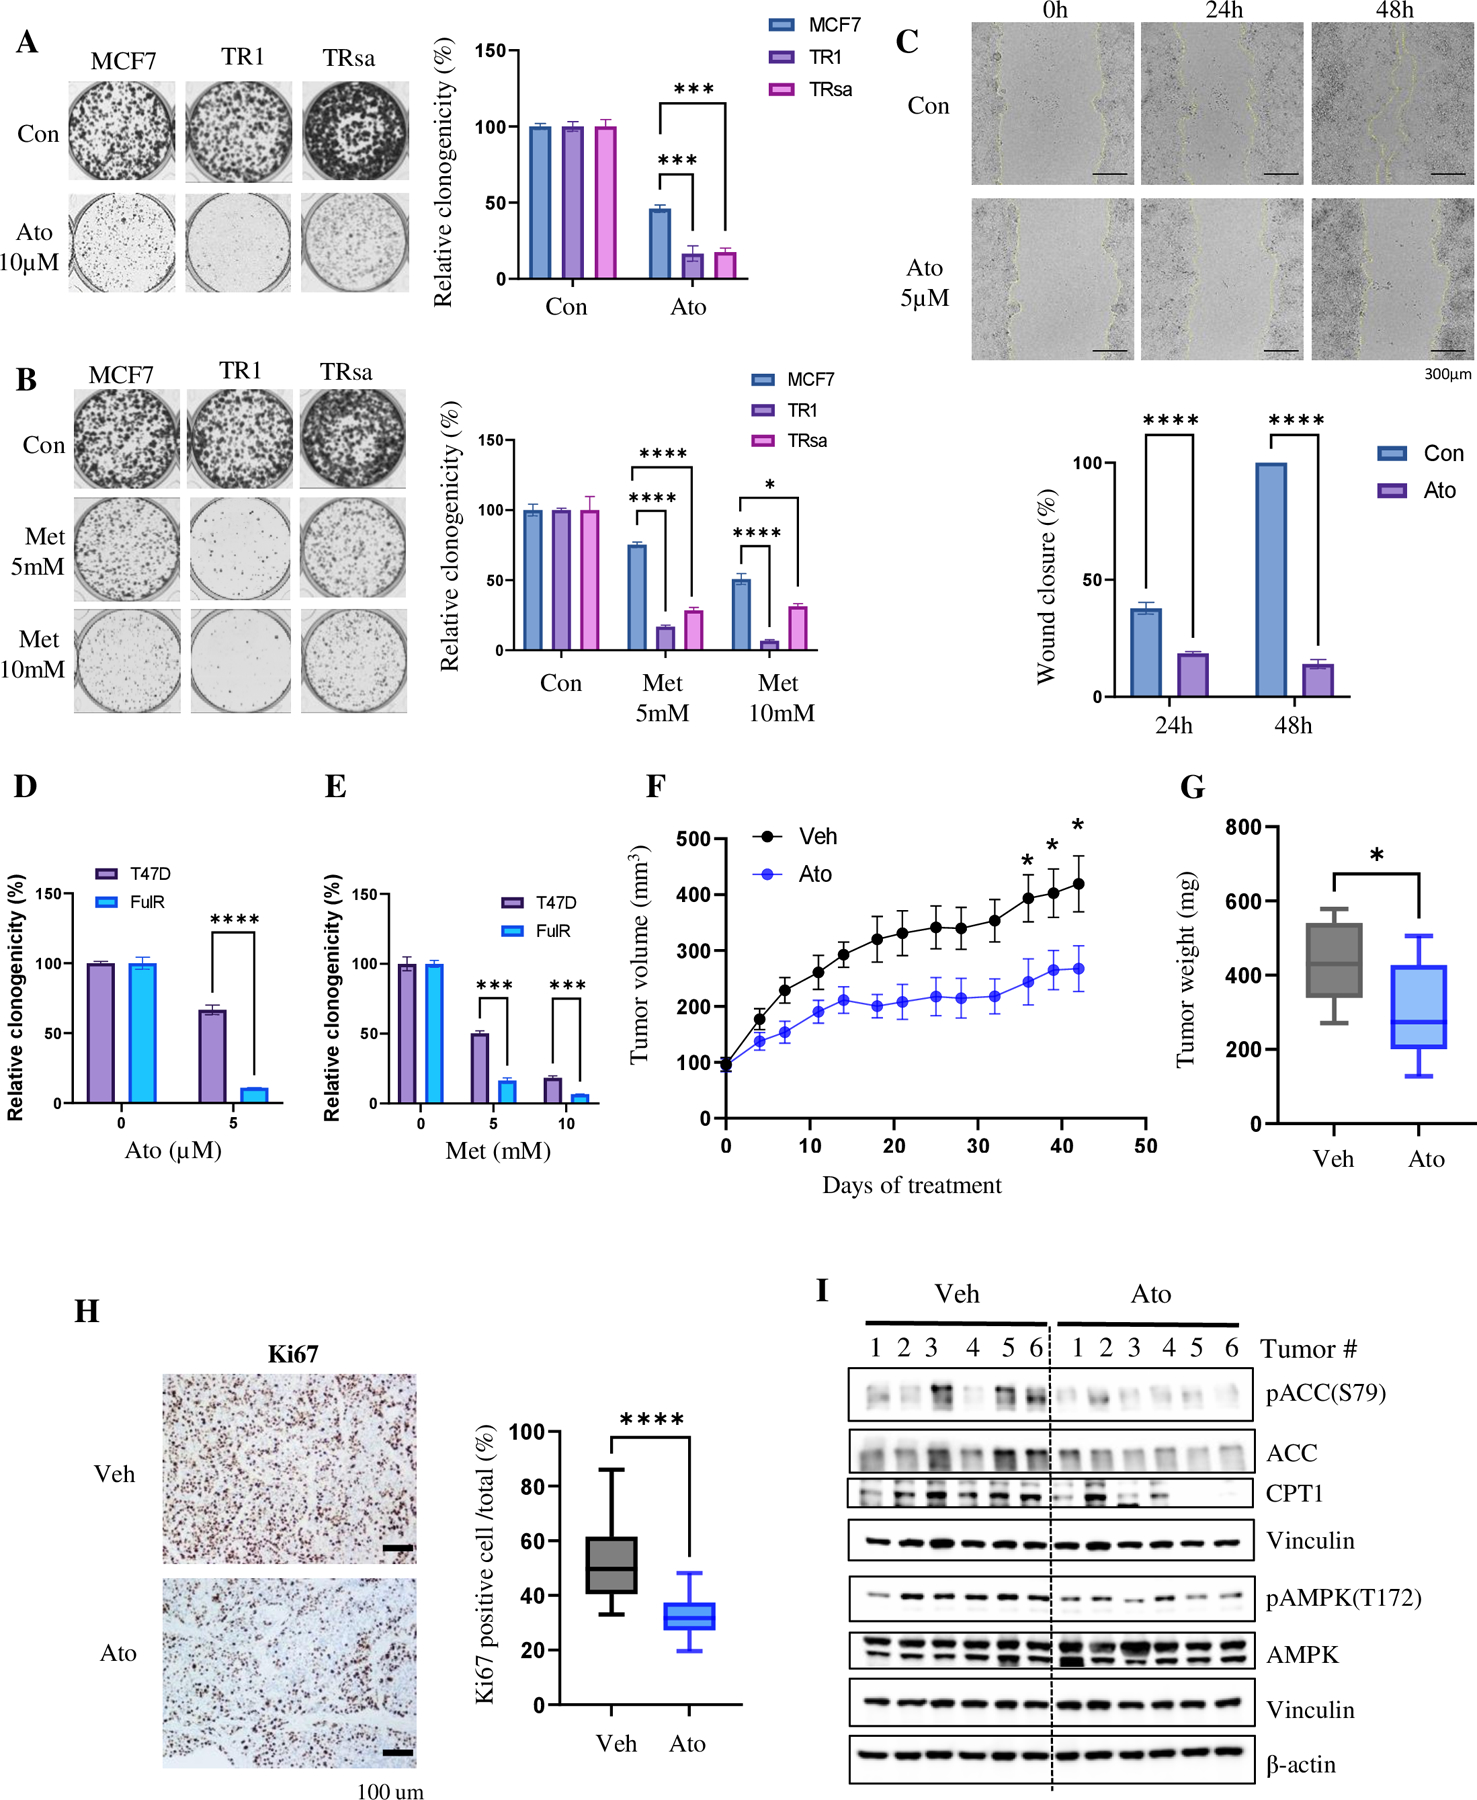
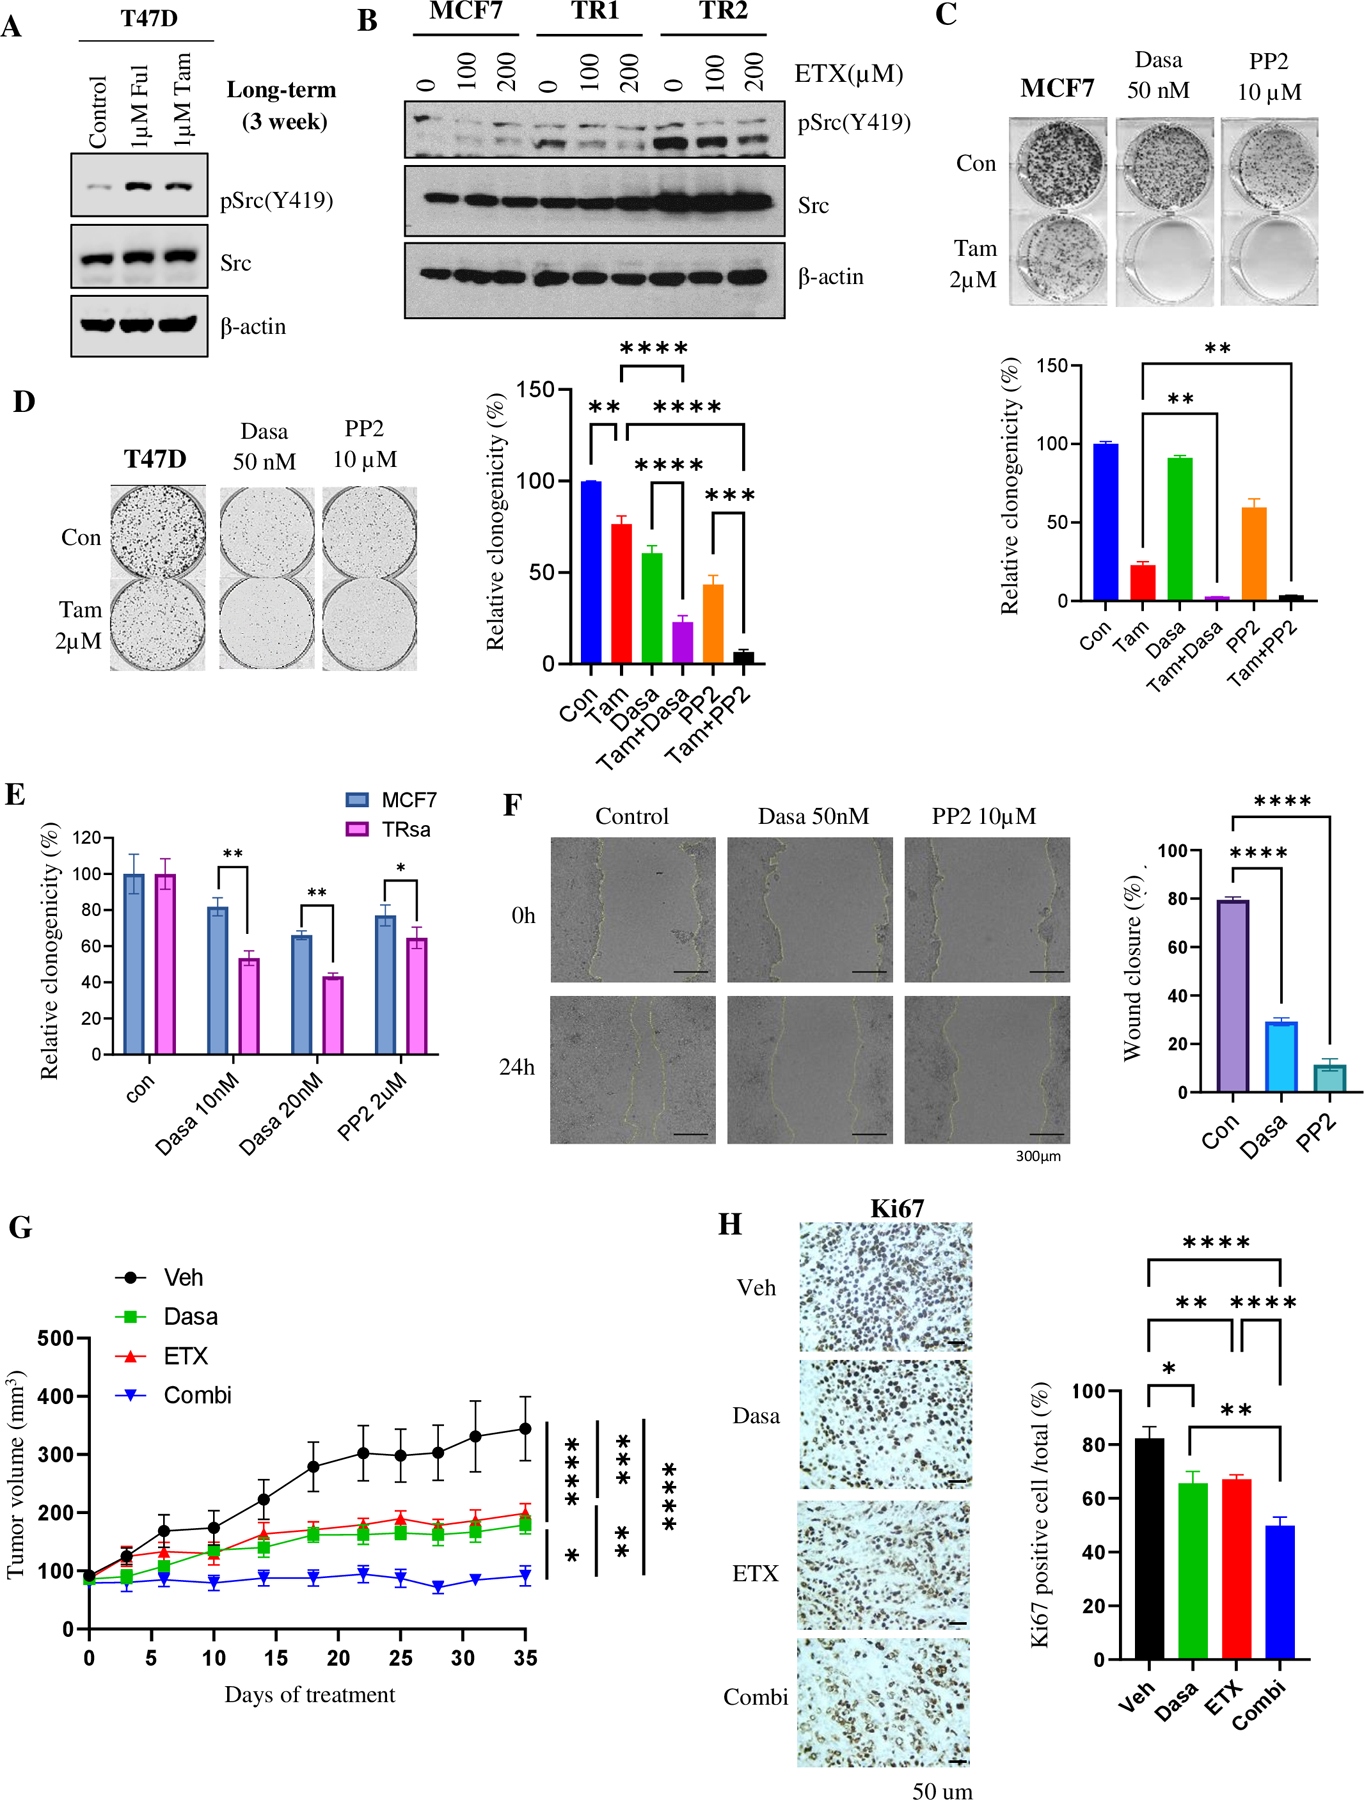
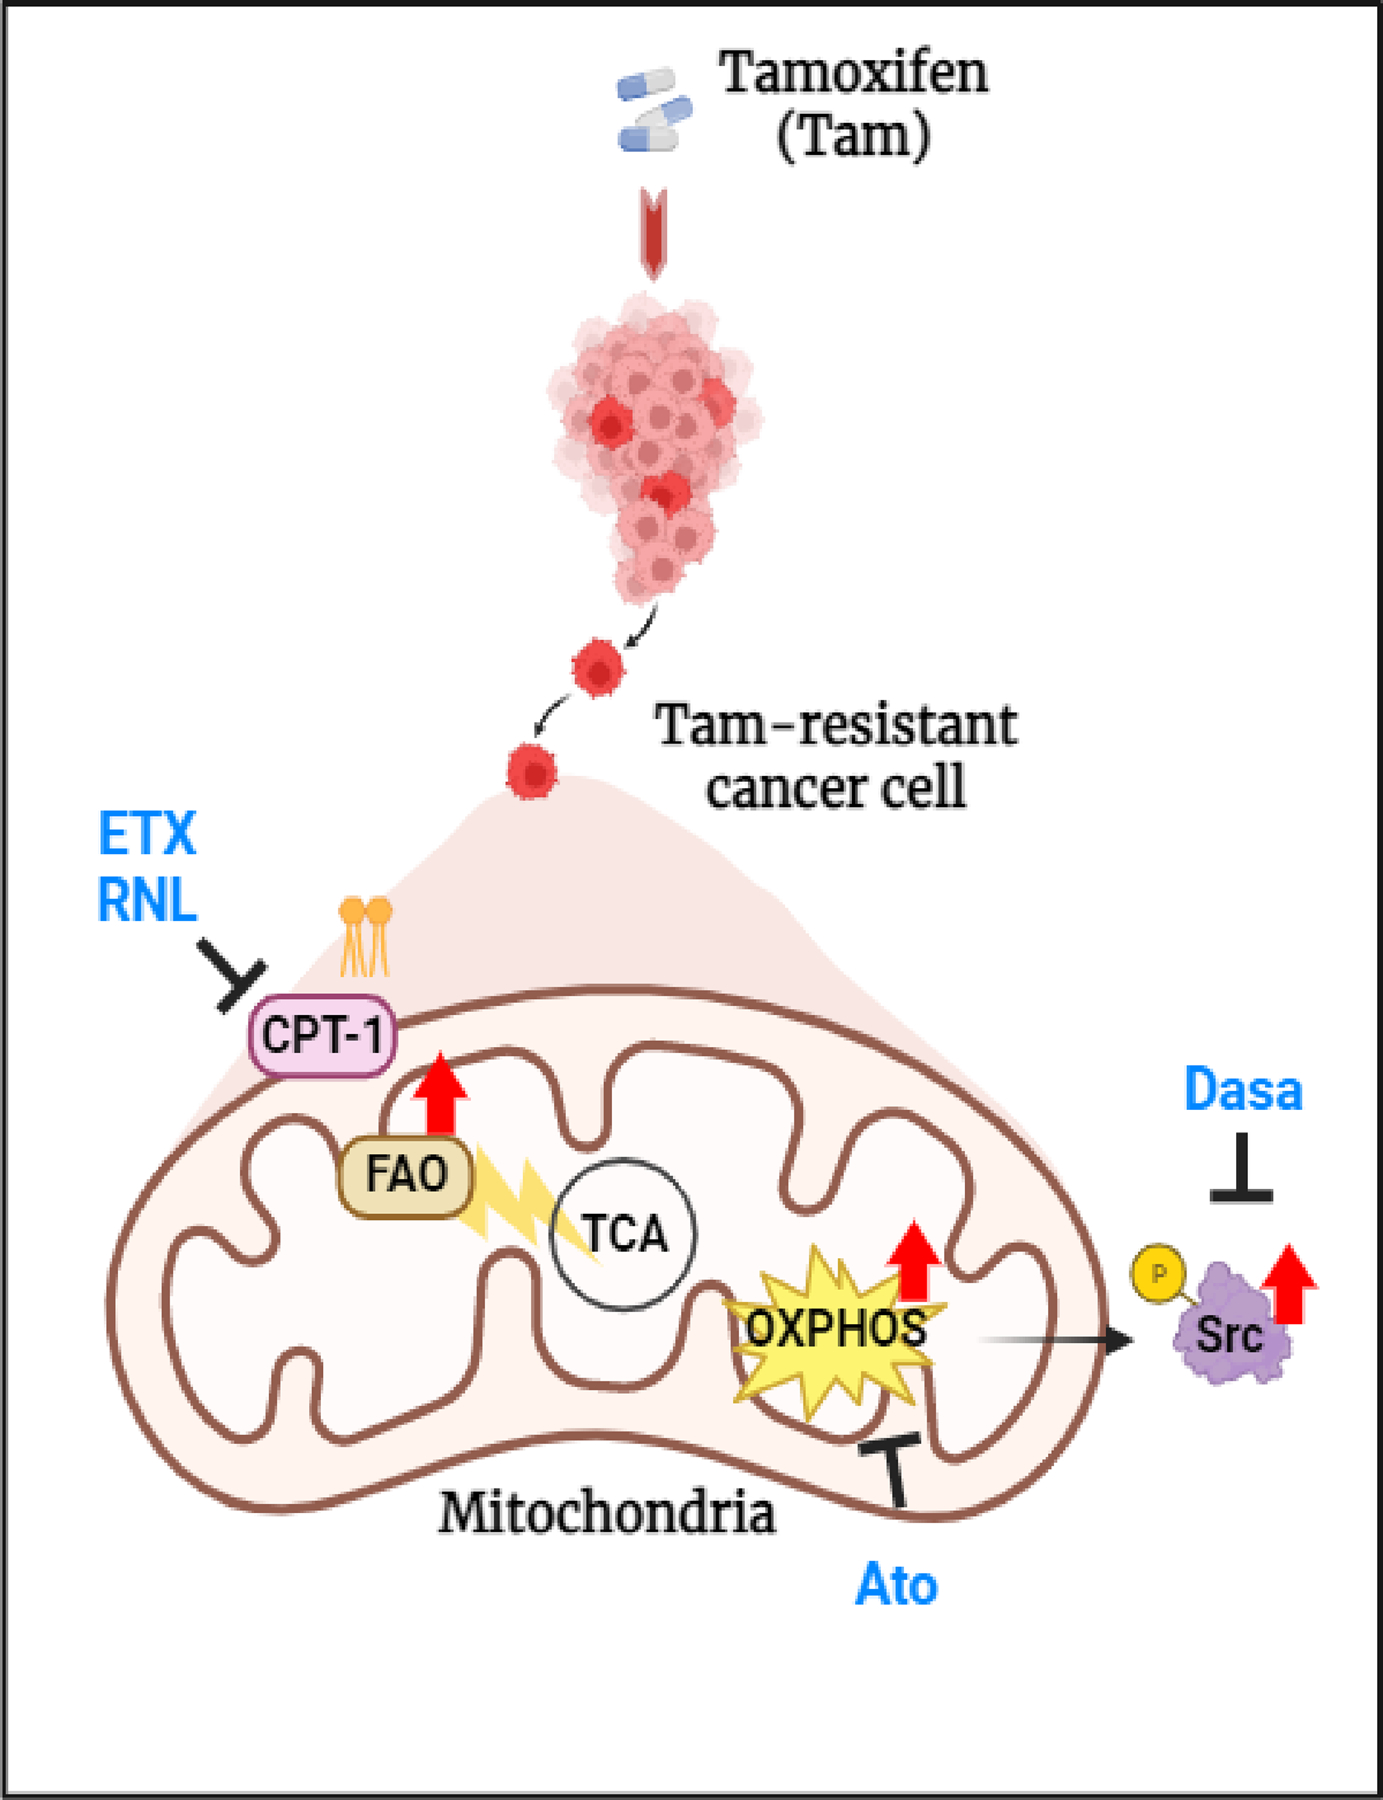
Approximately one-third of endocrine-treated women with estrogen receptor alpha-positive (ER+) breast cancers are at risk of recurrence due to intrinsic or acquired resistance. Thus, it is vital to understand the mechanisms underlying endocrine therapy resistance in ER+ breast cancer to improve patient treatment. Mitochondrial fatty acid β-oxidation (FAO) has been shown to be a major metabolic pathway in triple-negative breast cancer (TNBC) that can activate Src signaling. Here, we found metabolic reprogramming that increases FAO in ER+ breast cancer as a mechanism of resistance to endocrine therapy. A metabolically relevant, integrated gene signature was derived from transcriptomic, metabolomic, and lipidomic analyses in TNBC cells following inhibition of the FAO rate-limiting enzyme carnitine palmitoyl transferase 1 (CPT1), and this TNBC-derived signature was significantly associated with endocrine resistance in patients with ER+ breast cancer. Molecular, genetic, and metabolomic experiments identified activation of AMPK-FAO-oxidative phosphorylation (OXPHOS) signaling in endocrine-resistant ER+ breast cancer. CPT1 knockdown or treatment with FAO inhibitors in vitro and in vivo significantly enhanced the response of ER+ breast cancer cells to endocrine therapy. Consistent with the previous findings in TNBC, endocrine therapy-induced FAO activated the Src pathway in ER+ breast cancer. Src inhibitors suppressed the growth of endocrine-resistant tumors, and the efficacy could be further enhanced by metabolic priming with CPT1 inhibition. Collectively, this study developed and applied a TNBC-derived signature to reveal that metabolic reprogramming to FAO activates the Src pathway to drive endocrine resistance in ER+ breast cancer.

Significance: Increased fatty acid oxidation induced by endocrine therapy activates Src signaling to promote endocrine resistance in breast cancer, which can be overcome using clinically approved therapies targeting FAO and Src.


Conflict of interest statement

Conflicts of interest

The authors of this manuscript have no conflict of interest to declare

Figures

Figure 1.
Figure 1.. Multi-omics integration of transcriptomics, metabolomics, and lipidomics revealed a TNBC-derived gene signature associated with resistance to endocrine therapy in ER+ BC.
(A) MDA-MB-231 transfected with shScrambled (scr) or shCPT1 were profiled using microarray transcriptomics. Control (ctrl) and ETX treated SUM149 cells and SUM159 cells stably infected with scrambled or shCPT1 were profiled using RNA-Sequencing. Significant differentially expressed features shown as heatmaps. (B) A 3-model CPT1 suppression gene signature was derived, using MDA-MB-231, SUM159, and SUM149 gene expression data. (C) Scr or shCPT1 MDA-MB-231 cells were profiled using targeted metabolomics and unbiased lipidomics, with significant differentially expressed features shown as heatmaps. (D) A 3-model CPT1 suppression union signature was derived by overlapping 3-model CPT1 suppression gene signature with metabolic- and lipidomic- associated genes in MDA-BM-231 cells based on the CPT1 inhibition. (E) Distributions of the 3-model CPT1 suppression union signature activity in Ful-resistant MCF7 cells. (F) A Ful resistance signature was developed from BC patient tissue biopsies (GSE71791) and Tam resistance signatures were developed from two Tam resistant MCF7 cells (TR1 and TR2). Activity score correlation between the 3-model CPT1 suppression union signature and the three endocrine resistance signatures were computed over the patient tissue biopsies transcriptomic profiles from the METABRIC BC ER+ hormone-treated dataset. (G) Prognostic associations with disease-specific survival are shown for the 3-model CPT1 suppression gene signature and the 3-model CPT1 suppression union signature in the METABRIC BC ER+ hormone-treated dataset.
Figure 2.
Figure 2.. Activation of FAO signaling pathway after endocrine therapy in ER+ BC
(A) WB analysis of FAO-related and Src proteins in MCF7 and T47D cells treated with Tam or Ful for 24h. β-actin and vinculin were used as loading controls. (B) WB of FAO-related and Src proteins in in MCF7 cells treated with Tam or Ful for three weeks. β-actin and vinculin were used as loading controls. (C) Quantification of SRB proliferation assay of MCF7, TR1, TR2, and TRsa cells after Tam therapy (n=3). (D) Quantification of clonogenic potential of MCF7 and TR cells after Tam (1 µM) therapy (n=3). (E) Quantification of migrated cells from MCF7 and TR cells in the transwell migration assay (n=3). (F) Quantification of wound healing distance in a scratch assay (n=4). (G) Microarray data analysis shows significant increase in the activity of AMPK signature in TR1 and TR2 cells compared to control MCF7 cells (n=3). (H) Quantification of SRB assay of T47D and FulR cells after Ful treatment (n=4). (I) Quantification of clonogenic potential of T47D and FulR cells after Ful (1 µM) treatment (n=3). Data are presented as mean S.E.M., *p < 0.05, ** p <0.01, *** p <0.001, **** p <0.0001, D-F, I: Two-tailed student t-test, C:two-way ANOVA compared to MCF7, H: two-way ANOVA compared to T47D.
Figure 3.
Figure 3.. Increased FAO metabolism in TR cells.
(A) WB analysis of FAO-related proteins in MCF7 and TR cells. α-tubulin was used as a loading control. (B) Seahorse analysis of MCF7 and TR cells to determine the oxygen consumption rate (OCR). Basal respiration, maximal respiration, and ATP production were calculated from the Seahorse assay (n=3). (C) Complex1 activity of MCF7 and TR cells was measured using the ETC assay (n=3). (D) Metabolomics analysis of carnitines in MCF7 and TR1 cells. Acetyl carnitine is marked by a red box. (E) Boxplot of acetyl carnitine levels from the metabolomic analysis of MCF7 and TRsa cells (n=4). (F) qPCR analysis of relative mRNA levels of ACAA2 in MCF7 and TR cells (n=6). (G) WB analysis of ACAA2 protein in MCF7 and TR cells. β-actin was used as a loading control. (H) KM overall survival plot of ER+ BC patients (n=32) separated by the median ACAA2 protein expression in tumors. (I-J) KM distant metastasis-free survival plots of endocrine therapy treated ER+ BC patients (n=818), separated by median ACAA2 (I) or CPT1 (J) mRNA expression in the primary tumors. (K) CPT1 enzymatic activity in MCF7 and TR cells in lipid-depleted serum medium. Data are presented as mean S.E.M. *p < 0.05, ** p <0.01, *** p <0.001 using a two-tailed student t-test.
Figure 4.
Figure 4.. TR cells have increased sensitivity to FAO inhibition
(A) SRB proliferation assay of MCF7 and TR cells treated with ETX (n=6). (B) & (C) Clonogenic assay of MCF7 and TR cells treated with ETX (B) or RNL (C) (n=3). (D) Wound healing analysis of TR cells after treatment with ETX (n=4). (E) Quantification of anchorage-independent growth analysis using soft agar colony formation assay (n=3). (F) WB confirmation of decreased CPT1 protein expression in shCPT1 knockdown in MCF7 and T47D cells. β-actin was used as a loading control. (G) & (H) Analysis of cell viability using MTT assay (G) and clonogenicity using clonogenic assay (H) after Tam and Ful treatment in shScrambled or shCPT1 ER+ BC cells (n=3). Data are presented as mean S.E.M., *p < 0.05, ** p <0.01, *** p <0.001, **** p <0.0001, A, B, D, and G: two-way ANOVA, C, E and H: two-tailed student t-test.
Figure 5.
Figure 5.. FAO and OXPHOS inhibitors suppress in vivo growth potential of TR cells
(A & B) Clonogenic assay of MCF7 and TR cells after treatment with OXPHOS inhibitors Ato (A) and Met (B) (n=3). (C) Wound healing assay of TR1 cells after treatment with Ato (n=4). (D & E) Clonogenic assay of T47D and FulR cells after treatment with OXPHOS inhibitors Ato (D; control n=6, Ato n=3) and Met (E; control: n=6, Met: n=3). (F-H) In vivo Ato therapy in TRsa cells. (F) Tumor growth curve of mice with TR cell xenografts treated with vehicle or Ato (50mg/kg, 5 times/week, p.o., n=6). All mice received Tam (2mg/kg, 5 times/week, p.o.). (G) Tumor weight at the end point (n=6). (H) IHC analysis of Ki67 in tumor tissues and quantification of Ki67 positive cells (n=6 tumors x 3 representative areas). (I) WB analysis of the tumor tissues from Fig. 5F. Vinculin and ß-actin are loading controls. Data are presented as mean S.E.M., *p < 0.05, ** p <0.01, *** p <0.001, **** p <0.0001, A-C & F =Two -way ANOVA; D-E & H = two-tailed student t-test, G = one-tailed student t-test.
Figure 6.
Figure 6.. TR cells depend on FAO-induced Src activation
(A) WB of pSrc (Y419) and Src in MCF7 cells treated with Tam for 2-weeks. Vinculin was used as a loading control. (B) WB of pSrc (Y419) and Src levels in MCF7 and TR cells treated with ETX for 24 hours. β-actin was used as a loading control. (C & D) Clonogenic assay of MCF7 (C) and T47D (D) cells after treatment with Tam and Src inhibitors alone or in combination (n=3). (E) Quantification of the clonogenic assay in MCF7 or TRsa cells after treatment with Src inhibitors (Dasa or PP2) (n=3). (F) Wound healing assay of TR1 cells after treatment with Src inhibitors (n=4). (G) Tumor growth curve of TRsa cell xenografts treated with Dasa (20mg/kg, 3 times/week, p.o., n=6), ETX (50mg/kg, 3 times/week, i.p., n=6) or combination of Dasa + ETX (n=6). All mice received Tam (2mg/kg, 5 times/week, p.o.). (H) IHC analysis of Ki67 in tumor tissue from Fig 5G (n=4 tumors x 3 representative areas). Data are presented as mean S.E.M., *p < 0.05, ** p <0.01, *** p <0.001, **** p <0.0001, C, D, F & H= One-way ANOVA, E= Two-tailed student t-test, G= Two -way ANOVA
Fig7.
Fig7.. Hypothetical model of metabolic reprogramming of FAO-driven endocrine therapy resistance mechanism in ER+ BC
(Created with BioRender.com).

References

    1. Anurag M, Ellis MJ, Haricharan S. DNA damage repair defects as a new class of endocrine treatment resistance driver. Oncotarget 2018;9:36252–3 - PMC - PubMed
    1. Clarke R, Liu MC, Bouker KB, Gu Z, Lee RY, Zhu Y, et al. Antiestrogen resistance in breast cancer and the role of estrogen receptor signaling. Oncogene 2003;22:7316–39 - PubMed
    1. Herynk MH, Fuqua SA. Estrogen receptor mutations in human disease. Endocr Rev 2004;25:869–98 - PubMed
    1. deGraffenried LA, Friedrichs WE, Russell DH, Donzis EJ, Middleton AK, Silva JM, et al. Inhibition of mTOR activity restores tamoxifen response in breast cancer cells with aberrant Akt Activity. Clin Cancer Res 2004;10:8059–67 - PubMed
    1. Mills JN, Rutkovsky AC, Giordano A. Mechanisms of resistance in estrogen receptor positive breast cancer: overcoming resistance to tamoxifen/aromatase inhibitors. Curr Opin Pharmacol 2018;41:59–65 - PMC - PubMed

Publication types

MeSH terms