. 2023 Oct 31;13(1):18758.
doi: 10.1038/s41598-023-44212-5.

A hybrid CNN-Random Forest algorithm for bacterial spore segmentation and classification in TEM images

Affiliations

A hybrid CNN-Random Forest algorithm for bacterial spore segmentation and classification in TEM images

Saqib Qamar et al. Sci Rep. .

Abstract

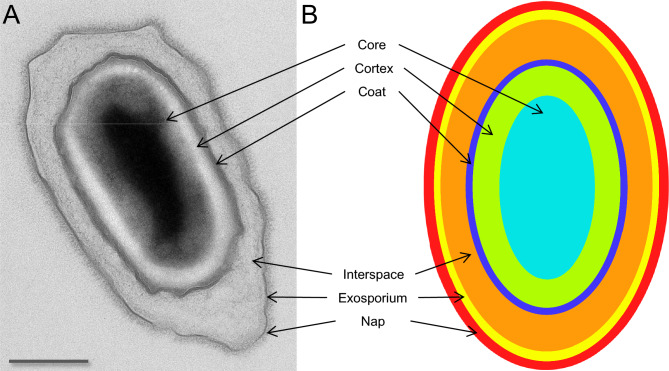
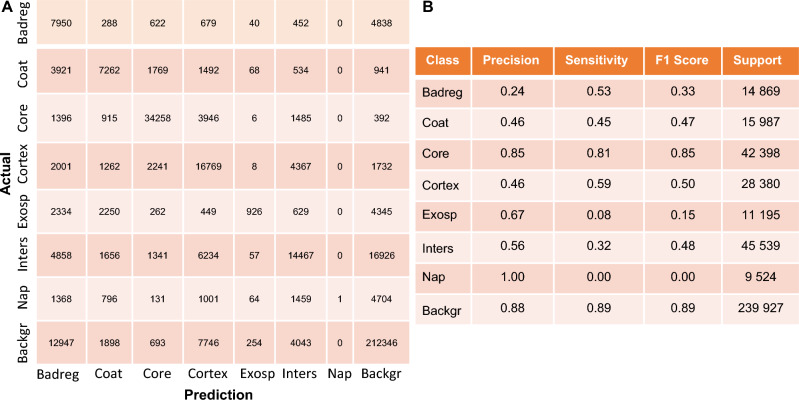
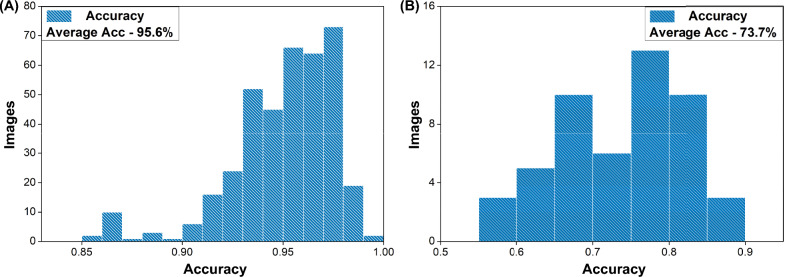
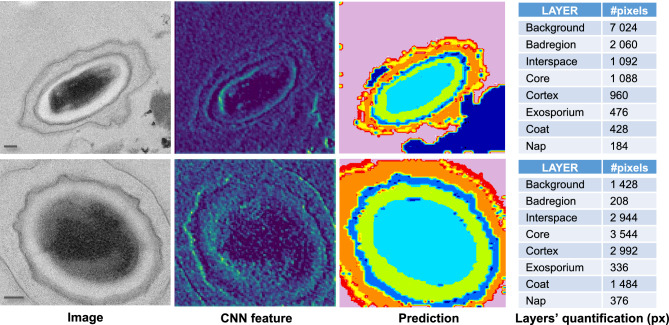
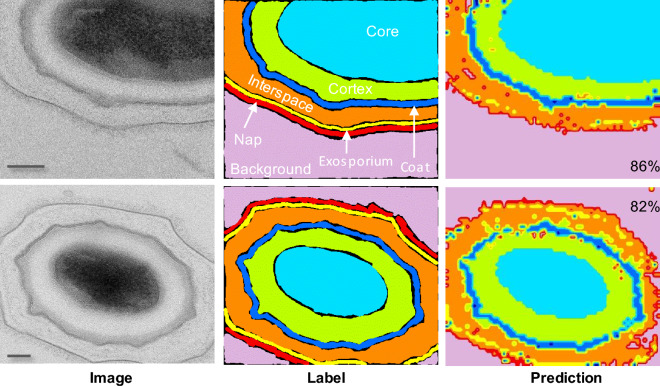
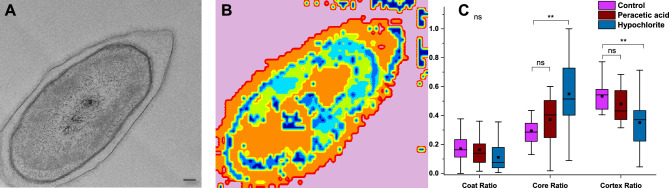
We present a new approach to segment and classify bacterial spore layers from Transmission Electron Microscopy (TEM) images using a hybrid Convolutional Neural Network (CNN) and Random Forest (RF) classifier algorithm. This approach utilizes deep learning, with the CNN extracting features from images, and the RF classifier using those features for classification. The proposed model achieved 73% accuracy, 64% precision, 46% sensitivity, and 47% F1-score with test data. Compared to other classifiers such as AdaBoost, XGBoost, and SVM, our proposed model demonstrates greater robustness and higher generalization ability for non-linear segmentation. Our model is also able to identify spores with a damaged core as verified using TEMs of chemically exposed spores. Therefore, the proposed method will be valuable for identifying and characterizing spore features in TEM images, reducing labor-intensive work as well as human bias.


Conflict of interest statement

The authors declare no competing interests.

Figures

Figure 1
Figure 1
TEM micrograph (A) and structure model (B) showing the layer structure of bacterial spores. From the central spore core, the layers are in ascending order; cortex, coat, interspace, exosporium, and nap. The nap is the outermost layer consisting of thin short hair-like fibers. Scale bar is 500 nm.
Figure 2
Figure 2
Proposed combined approach of CNN and RF. The CNN extract features from the data and RF classifies data based on a large number of decision trees.
Algorithm 1
Algorithm 1
Proposed Approach Pseudo code
Figure 3
Figure 3
Classification performance for different spore layers based on the testing data set (A). Each cell shows the number of classified instances by the model, as compared to ground truth data. The diagonal cells show the correctly classified instances for a class. From this we evaluated the precision, sensitivity, and F1-score for each individual class (B).
Figure 4
Figure 4
Distribution of the accuracy for the model when analysing all the individual images. (A) Shows the distribution for the training data and (B) the testing data.
Figure 5
Figure 5
Comparative image showing TEM images of two spores, their respective layers as labeled, and their layers as predicted by our model. The final segmentation map is a 128 x 104 matrix, with each entry representing a pixel in the spore sample. Right-side matrix shows segmentation for each individual class. Scale bars are 100 nm.
Figure 6
Figure 6
A sample of TEMs, CNN features, and predictions. The final segmentation map is a 128×104 matrix, with each entry representing a pixel in the spore sample. Right-side matrix shows segmentation for each individual class. The color coding for classification is “Badreg (dark blue),” “coat (blue),” “core (light blue),” “cortex (green),” “exosporium (yellow),” “interspace (orange),” “nap (red),” and “background (violet)”. The percentage indicates the accuracy of the prediction. Scale bar is 100 nm.
Figure 7
Figure 7
Assessing the spore layers integrity of sodium hypochlorite and peracetic acid exposed spores. A TEM image of a sodium hypochlorite exposed spore is shown in (A). The model’s classification is shown in (B). Coat, core, and cortex ratio for control spores, and hypochlorite as well as peracetic acid exposed spores. (C) shows the relative areas of the spore coat (n = 33), core (n = 22), and cortex (n = 21). There was no significant difference in the coat ratio across the samples (indicated with “ns”), however, the hypochlorite-treated samples showed a significantly different core ratio (p = 0.0014) and cortex ratio (p = 0.0095). Scale bar is 100 nm.

References

    1. Driks A. The dynamic spore. Proc. Natl. Acad. Sci. 2003;100:3007–3009. doi: 10.1073/pnas.0730807100. - DOI - PMC - PubMed
    1. Setlow P. Spores of bacillus subtilis: Their resistance to and killing by radiation, heat and chemicals. J. Appl. Microbiol. 2006;101:514–525. doi: 10.1111/j.1365-2672.2005.02736.x. - DOI - PubMed
    1. Magill SS, et al. Changes in prevalence of health care-associated infections in US hospitals. N. Engl. J. Med. 2018;379:1732–1744. doi: 10.1056/NEJMoa1801550. - DOI - PMC - PubMed
    1. Andersson A, Granum PE, Rönner U. The adhesion of bacillus cereus spores to epithelial cells might be an additional virulence mechanism. Int. J. Food Microbiol. 1998;39:93–99. doi: 10.1016/S0168-1605(97)00121-9. - DOI - PubMed
    1. Manchee RJ, Broster M, Anderson IS, Henstridge R, Melling J. Decontamination of bacillus anthracis on Gruinard island? Nature. 1983;303:239–240. doi: 10.1038/303239a0. - DOI - PubMed

Publication types