. 2023 Oct 31;13(1):18734.
doi: 10.1038/s41598-023-45418-3.

HOPS, CORVET and newly-identified Hybrid tethering complexes contribute differentially towards multiple modes of endocytosis

Affiliations

HOPS, CORVET and newly-identified Hybrid tethering complexes contribute differentially towards multiple modes of endocytosis

Seigo Terawaki et al. Sci Rep. .

Abstract

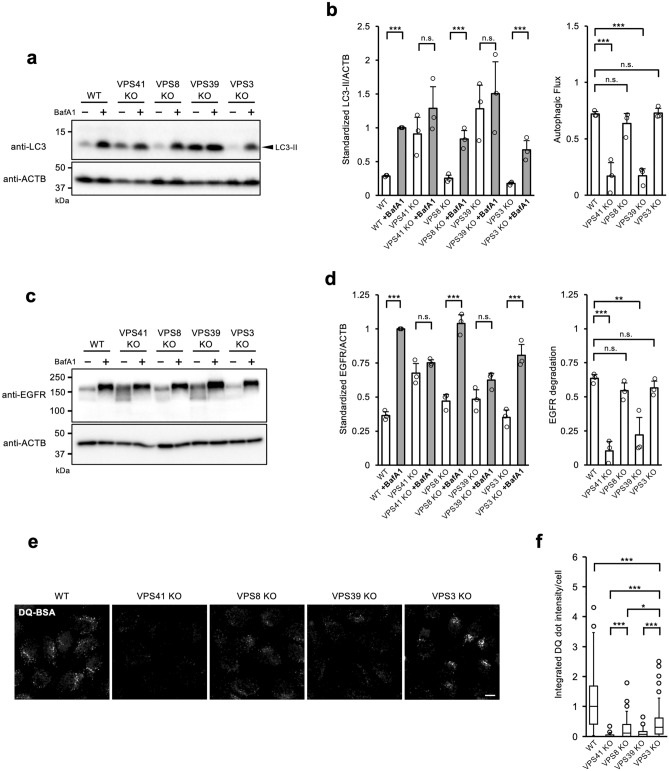
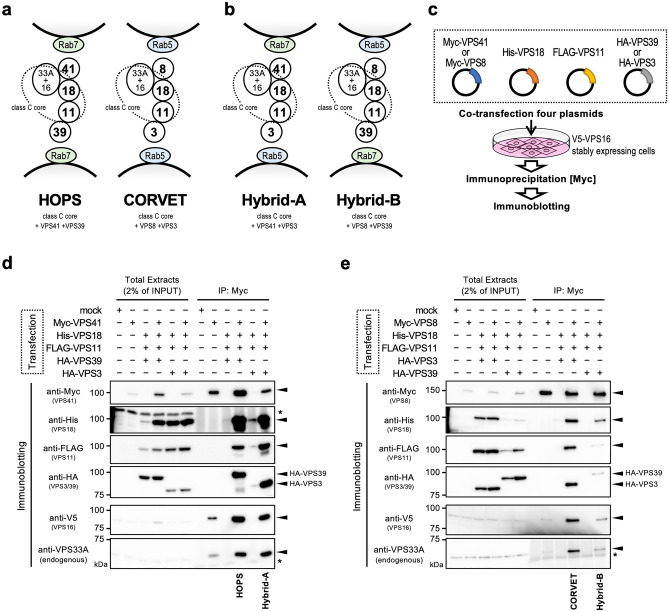
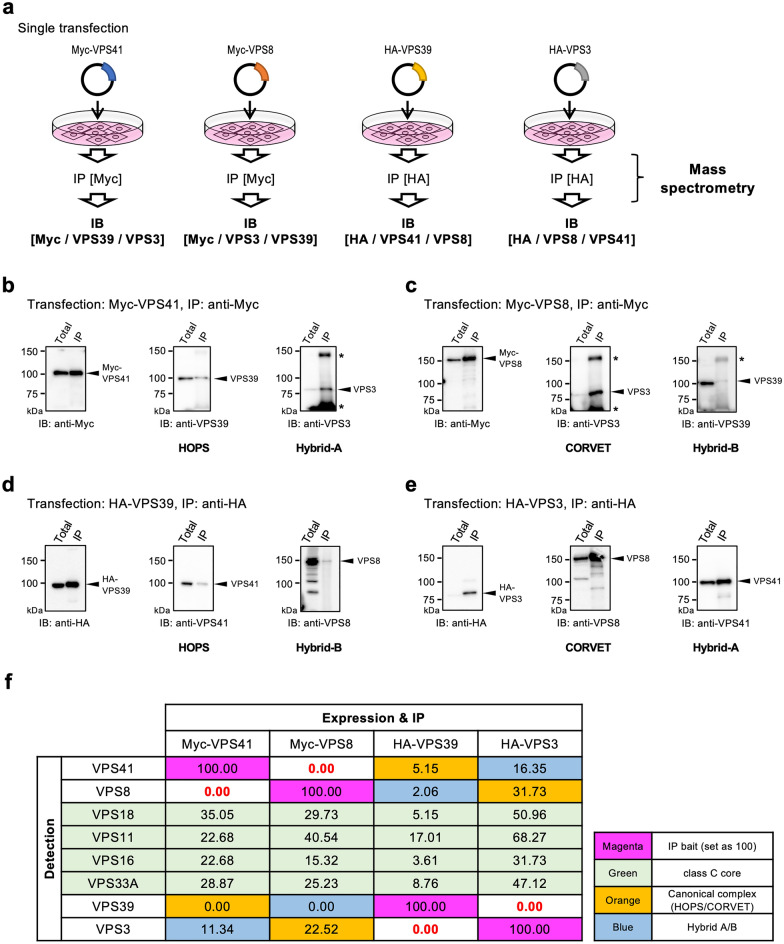
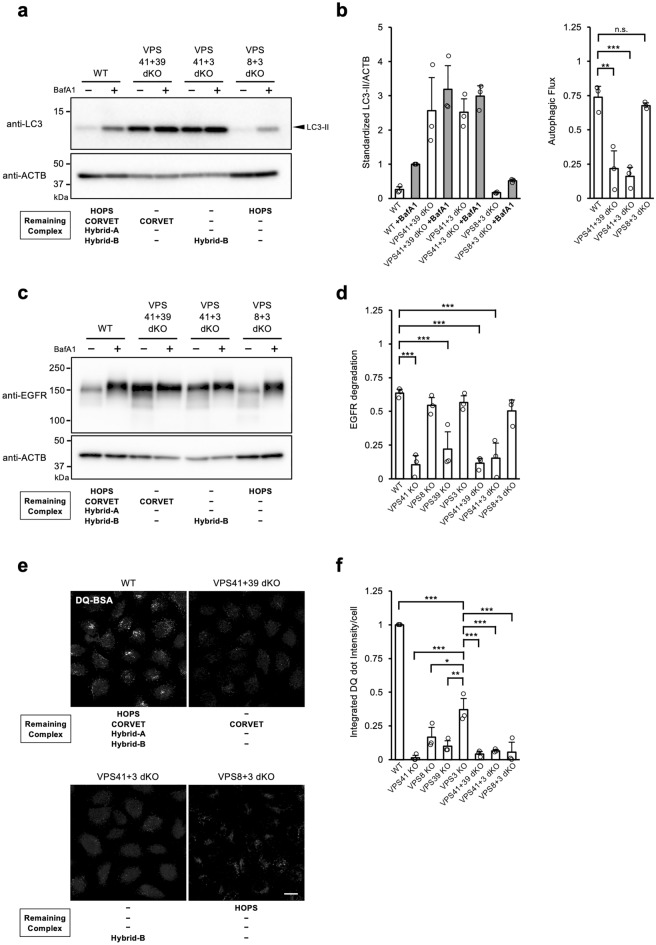
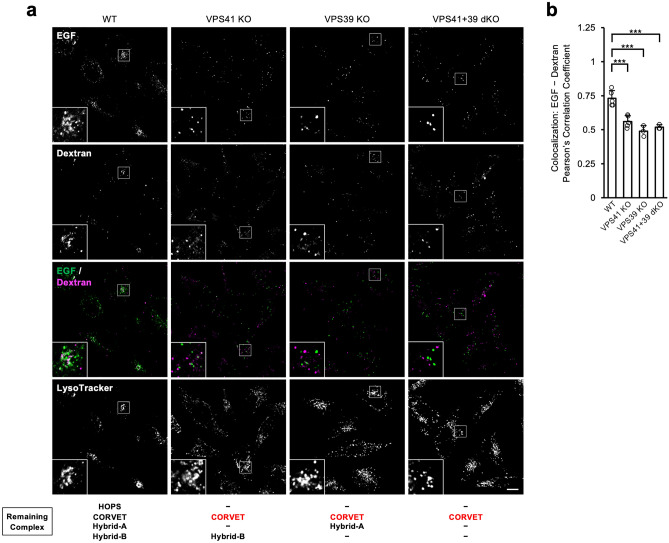
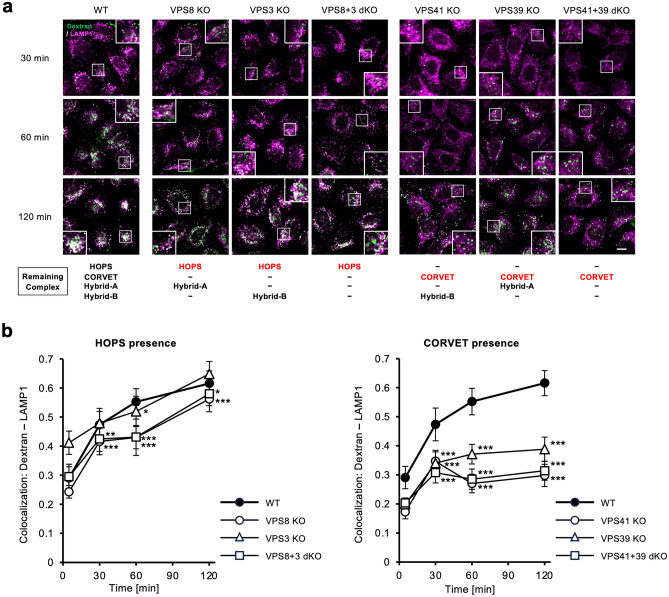
Vesicular transport driven by membrane trafficking systems conserved in eukaryotes is critical to cellular functionality and homeostasis. It is known that homotypic fusion and vacuole protein sorting (HOPS) and class C core endosomal vacuole tethering (CORVET) interact with Rab-GTPases and SNARE proteins to regulate vesicle transport, fusion, and maturation in autophagy and endocytosis pathways. In this study, we identified two novel "Hybrid" tethering complexes in mammalian cells in which one of the subunits of HOPS or CORVET is replaced with the subunit from the other. Substrates taken up by receptor-mediated endocytosis or pinocytosis were transported by distinctive pathways, and the newly identified hybrid complexes contributed to pinocytosis in the presence of HOPS, whereas receptor-mediated endocytosis was exclusively dependent on HOPS. Our study provides new insights into the molecular mechanisms of the endocytic pathway and the function of the vacuolar protein sorting-associated (VPS) protein family.


Conflict of interest statement

The authors declare no competing interests.

Figures

Figure 1
Figure 1
Phenotypic differences in autophagic flux and endocytosis in VPS KO cells. (a) LC3 flux in VPS KO HeLa-Kyoto cells. WT and VPS KO cells were cultured in the absence or presence of BafA1 for 2 h. Total cell extracts were analysed for LC3 and β-actin (ACTB) by western blotting. Representative blots are shown from 3 independent experiments. (b) Quantitative analysis of band intensities in panel (a). Intensities of LC3 divided by ACTB were normalized to BafA1-treated WT cell samples as 1. Autophagic flux shown in the right panel was calculated as follows: (LC3BafA1+–LC3BafA1−)/LC3BafA1+. Mean and S.D. are shown. Overlayed-circle represents each data point. Statistics were calculated by one-way ANOVA followed by post hoc Tukey’s test. (c) Receptor-mediated endocytosis in VPS KO HeLa-Kyoto cells. WT and VPS KO cells were stimulated with 100 ng/mL of EGF for 2 h in the absence or presence of BafA1. The whole cell lysates were analysed for EGFR and ACTB by western blotting. Representative blots are shown from 3 independent experiments. (d) Quantitative analysis of band intensities in panel (c). Mean and S.D. from 3 independent experiments are shown. EGFR degradation was determined by the following formula: (EGFRBafA1+–EGFRBafA1−)/EGFRBafA1+. Overlayed-circle represents each data point. Statistics were calculated by one-way ANOVA followed by post hoc Tukey’s test. (e) DQ Red-labelled BSA was incorporated into WT and VPS KO HeLa-Kyoto cells for 4 h and fluorescent images of activated DQ Red were acquired by confocal microscopy. A representative image from each sample is shown. Bars = 10 µm. (f) Quantitative analysis of DQ Red-BSA intensity in panel (e). Five images for each cell were captured, and analysed by Cell Profiler™. Integrated fluorescence intensities of DQ Red for each cell are normalized to the median value of WT and are displayed as a box-and-whisker plot. The whisker shows either the range of the data points or 1.5 IQR at maximum. Each circle represents the outlier that is outside of the whisker range. The Boxes represent the upper quartile (top line), median (middle bar), and lower quartile (bottom line), respectively. The counted cells for WT; n = 57, VPS41 KO; n = 40, VPS8 KO; n = 44, VPS39 KO; n = 50, VPS3 KO; n = 56. Statistics were calculated by the Kruskal–Wallis test followed by the Mann–Whitney U test with Holm correction. * p < 0.05, ** p < 0.01, *** p < 0.001, and n.s.; not significant.
Figure 2
Figure 2
“Hybrid” complexes composed of the subunits of HOPS/CORVET. (a,b) Schematic representation of HOPS and CORVET (a), and non-canonical tethering complexes named Hybrid-A and Hybrid-B (b) interacting with Rab5- or Rab7-positive vesicles. (c) Experimental strategies to reconstitute and immunoprecipitate the tethering complexes with over-expressed subunits with different tags. (d,e) The HOPS/CORVET subunits which can form a complex with Myc-VPS41 (d) or Myc-VPS8 (e) were determined by immunoprecipitation (IP) analyses. A combination of the introduced plasmids for each lane is shown on the top of the blots. The left half of each panel shows input control without IP. The expected bands of each blot were indicated by arrowheads on the right side. The name of the complex corresponding to each band combination detected after IP is shown at the bottom. An asterisk (*) represents a non-specific band.
Figure 3
Figure 3
Detections of the endogenous canonical and non-canonical tethering complexes by mass spectrometry. (a) An experimental workflow. One tagged-VPS protein at either end of the tethering complex was over-expressed in WT HeLa-Kyoto cells. Endogenous proteins interacting with exogenously expressed VPS41, VPS8, VPS39, or VPS3 were pulled down by anti-Tag antibody and Protein-G magnetic beads. (be) IP-check before Mass spectropetry analysis by western blotting. Interactions with the expected partner proteins for VPS41 (b), VPS8 (c), VPS39 (d), and VPS3 (e) were confirmed by immunoblotting (arrowheads). The relevant complex is shown at the bottom for each panel. Asterisks (*) represent non-specific bands. (f) The relative abundance of each tethering complex subunit based on the signal intensities from the mass spectrometric analysis is shown. Each value is shown as a relative value to the over-expressed subunit which served as the bait as 100. The meaning of the background colouring of cells is shown in the legend on the right side.
Figure 4
Figure 4
Involvement of the Hybrid complexes in endocytosis progression. (a) Autophagic flux in the VPS dKO cells. Cells were cultured in the absence or presence of BafA1 for 2 h. The whole cell lysates were analysed by western blotting. The theoretical remaining complexes for each cell line are shown at the bottom. A representative result out of independent 3 experiments is shown. (b) A quantitative analysis of the immunoblot is shown in panel (a). The mean and S.D. of intensities and autophagic flux from 3 independent results are shown in the left panel and right panel, respectively. (c) EGFR endocytosis in VPS dKO cells. WT and VPS KO cells were stimulated with 100 ng/mL of EGF for 2 h in the absence or presence of BafA1. The whole cell lysates were analysed by western blotting. A representative blot is shown from 3 independent experiments. (d) Quantitative analysis of band intensities in panel (c). Mean and S.D. from 3 independent experiments are shown. The overlayed circle represents each data point. Statistics were calculated by one-way ANOVA followed by post hoc Tukey’s test. (e,f) DQ-BSA uptake. VPS dKO cell lines were treated with DQ-BSA containing medium for 4 h. A representative image of DQ-BSA for each cell line is shown (e). Quantitative data of relative DQ dot intensity/cell is displayed. The data is shown as an average of the median from three independent experiments (f). Statistics were calculated by one-way ANOVA followed by post hoc Tukey’s test. Scale Bar = 10 µm. *p < 0.05, **p < 0.01, ***p < 0.001, and n.s.; not significant.
Figure 5
Figure 5
Different localisation of receptor-mediated endocytosis and pinocytosis cargo. (a) Dual tracing of trafficking processes of receptor-mediated endocytosis and pinocytosis substrates in VPS KO cells. The cells were treated with Alexa Fluor 488-labelled EGF and Alexa Fluor 647-labelled dextran-containing medium for 1 h. Fluorescence images derived from the incorporated substrates were captured using a confocal microscope. Representative images are shown. Scale bar = 10 µm. (b) Quantitative analysis of colocalisation between endocytosed EGF and dextran in (a). At least, five images for each cell line were captured and analysed. Pearson’s correlation coefficient of each cell was plotted. ***p < 0.001.
Figure 6
Figure 6
Time course analysis of pinocytic cargos in the VPS KO and dKO cells. (a) Tracing of trafficking processes of pinocytosis substrates in VPS KO and dKO cells. The cells were treated with Alexa Fluor 647-labelled dextran-containing medium for 15 min, 30 min, or 60 min, then fixed and stained for LAMP1. Fluorescence images derived from the dextran (green) and LAMP1 (magenta) were captured using a confocal microscope. Representative images are shown. Scale bar = 10 µm. (b) Quantitative analysis of colocalisation between the endocytosed dextran and LAMP1 in (a). Five images were obtained for each cell line to obtain approximately 50 cells to measure. Pearson’s correlation coefficient was determined cell by cell, and the median ± S.D. for each cell line and each time point was plotted on time series line graphs. Statistical analyses were done by the Kruskal–Wallis test followed by the Mann–Whitney U test with Holm correction. Significance against WT for each time point is shown as; *p < 0.05, **p < 0.01, ***p < 0.001.

References

    1. Ballabio A, Bonifacino JS. Lysosomes as dynamic regulators of cell and organismal homeostasis. Nat. Rev. Mol. Cell Biol. 2020;21:101–118. doi: 10.1038/s41580-019-0185-4. - DOI - PubMed
    1. Mizushima N. Autophagy: Process and function. Genes Dev. 2007;21:2861–2873. doi: 10.1101/gad.1599207. - DOI - PubMed
    1. Doherty GJ, McMahon HT. Mechanisms of endocytosis. Annu. Rev. Biochem. 2009;78:857–902. doi: 10.1146/annurev.biochem.78.081307.110540. - DOI - PubMed
    1. Huotari J, Helenius A. Endosome maturation. EMBO J. 2011;30:3481–3500. doi: 10.1038/emboj.2011.286. - DOI - PMC - PubMed
    1. Solinger JA, Spang A. Tethering complexes in the endocytic pathway: CORVET and HOPS. FEBS J. 2013;280:2743–2757. doi: 10.1111/febs.12151. - DOI - PubMed

Publication types

Substances