. 2023 Oct 31;14(1):6909.
doi: 10.1038/s41467-023-42199-1.

Loss of Grem1-lineage chondrogenic progenitor cells causes osteoarthritis

Affiliations

Loss of Grem1-lineage chondrogenic progenitor cells causes osteoarthritis

Jia Q Ng et al. Nat Commun. .

Abstract

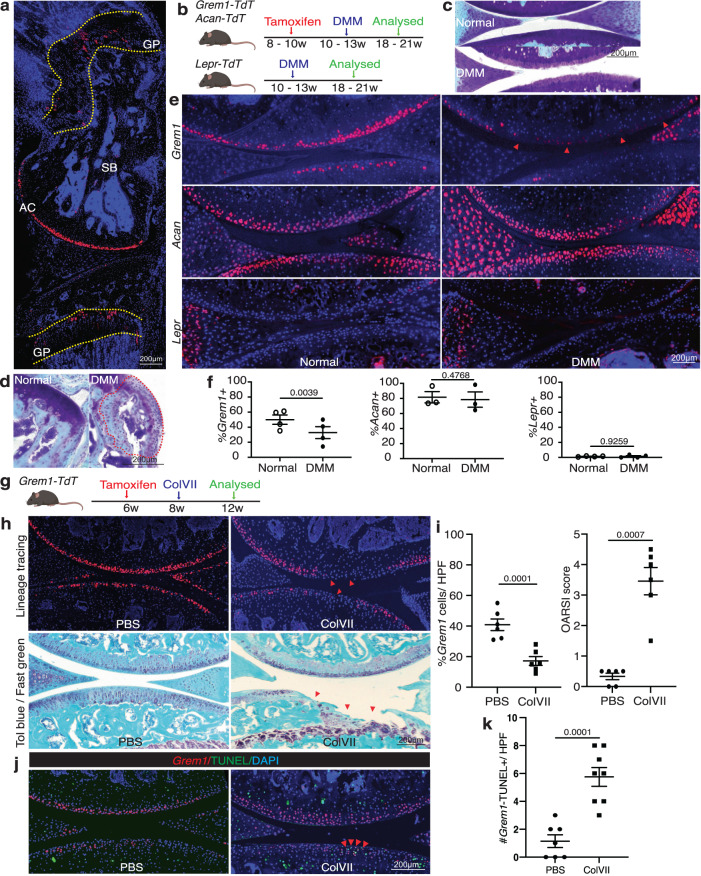
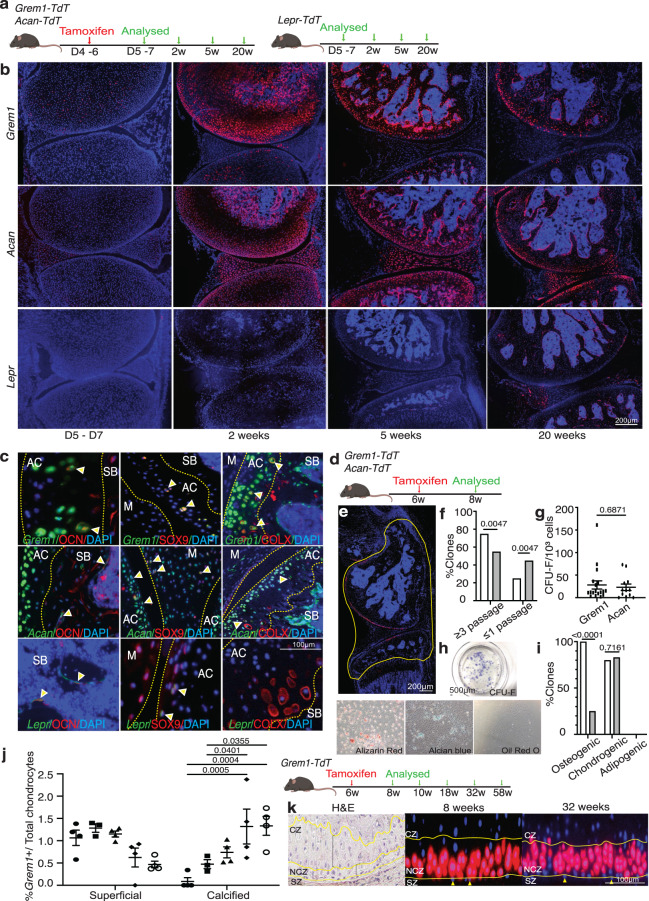
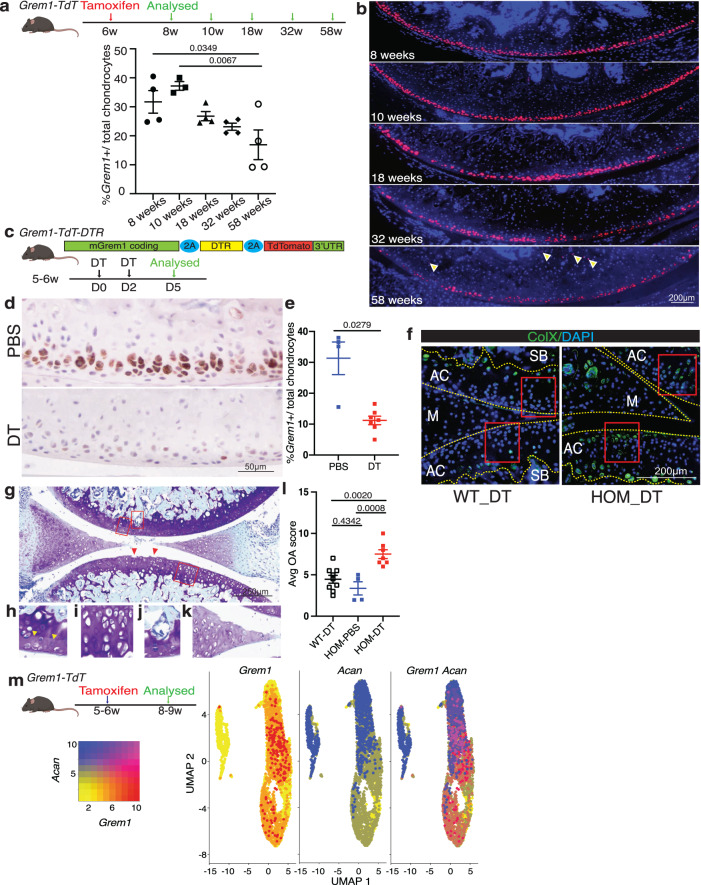
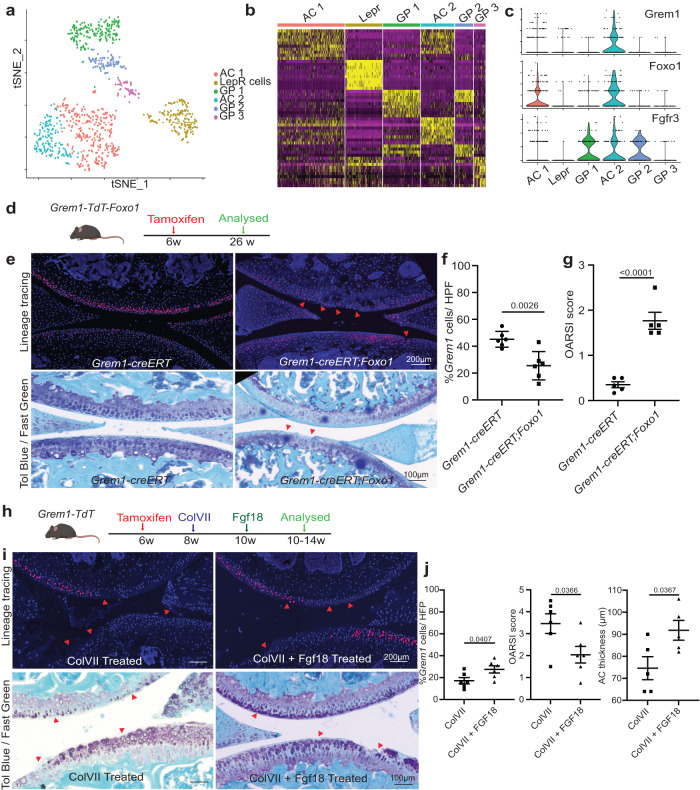
Osteoarthritis (OA) is characterised by an irreversible degeneration of articular cartilage. Here we show that the BMP-antagonist Gremlin 1 (Grem1) marks a bipotent chondrogenic and osteogenic progenitor cell population within the articular surface. Notably, these progenitors are depleted by injury-induced OA and increasing age. OA is also caused by ablation of Grem1 cells in mice. Transcriptomic and functional analysis in mice found that articular surface Grem1-lineage cells are dependent on Foxo1 and ablation of Foxo1 in Grem1-lineage cells caused OA. FGFR3 signalling was confirmed as a promising therapeutic pathway by administration of pathway activator, FGF18, resulting in Grem1-lineage chondrocyte progenitor cell proliferation, increased cartilage thickness and reduced OA. These findings suggest that OA, in part, is caused by mechanical, developmental or age-related attrition of Grem1 expressing articular cartilage progenitor cells. These cells, and the FGFR3 signalling pathway that sustains them, may be effective future targets for biological management of OA.


Conflict of interest statement

The authors declare no competing interests.

Figures

Fig. 1
Fig. 1. The articular Grem1-lineage progenitor cells are significantly depleted in OA.
a Representative image of knee joint from 8-week-old Grem1-TdT mice administered tamoxifen at 6 weeks of age showing the location of Grem1 cells in growth plate (GP), subchondral bone (SB) and articular cartilage (AC), n = 5 mice. b Experiment schema. DMM surgery was performed on adult Grem1-TdT, Acan-TdT and Lepr-TdT mice and tissue harvested after 8 weeks. c Representative image of proteoglycan loss, and d osteophyte-like formation (red dotted line) stained with Toluidine blue and Fast green in DMM with paired normal for comparison. n = 11 mice/group. e Representative images of paired distal femur joints of Grem1-TdT (top), Acan-TdT (middle) and Lepr-TdT (bottom) mice showing a decrease in Grem1-lineage cells within the AC DMM injury site (arrows) compared to normal. f Quantification of Grem1-, Acan- and Lepr-lineage cells as a percentage of total chondrocytes within the DMM injury site (filled circle) in comparison to no surgery (open circle) control. Grem1 and Lepr n = 4 animals/group, Acan n = 3 animals/group. Paired, two-tail t-test. g ColVII induced OA experiment schema. h Representative images of Grem1-TdT distal femur joints showing loss of Grem1-lineage AC cells as indicated by arrows within the injury site (top), and OA pathology induced by ColVII compared to PBS control. Sections stained with Toluidine blue and Fast green, arrows indicate superficial lesions. i Quantification of the percentage of Grem1-lineage AC cells per HPF (left) and, unblinded histopathological assessment using OARSI grading of OA pathology (right) in ColVII induced OA (square) compared to PBS controls (circle). n = 6 mice/group. Paired, two-tailed t test. j Representative images of TUNEL staining in articular Grem1-lineage cells quantified in k. k Quantification of the number of articular Grem1-lineage TUNEL positive cells in ColVII induced OA (square, n = 8 mice) compared to PBS control (circle, n = 7 mice). Unpaired, two-tailed t test. Bars denote s.e.m. Source data are provided as a Source Data file. Mouse image in figure schemas created with BioRender.com.
Fig. 2
Fig. 2. Grem1-lineage marks a progenitor cell population in the AC.
a Experimental schema. b Representative images of AC from Grem1-TdT (top row) and Acan-TdT (middle row) mice and age paired Lepr-TdT (bottom row) mice. n = 5 animals per group per time point. c Distal femur from neonatal tamoxifen Grem1-TdT, Acan-TdT and Lepr-TdT pulse-chased for 20 weeks. Representative IF staining of Grem1 (top row), Acan (middle row) and Lepr (bottom row) cells expressing OCN, SOX9 and COLX (indicated by yellow arrows). Subchondral bone (SB), articular cartilage (AC) and meniscus (M). n = 3 mice per group. d Experimental schema. e Articular joints, outlined in yellow, were used to isolate red cells for in vitro assays. f Percentage of Grem1-lineage (white) clones able to undergo expansion compared to Acan-lineage (grey) clones. g Number of CFU-F formed per clone. h, Representative images of Grem1-lineage cells stained for CFU-F or differentiation markers Alizarin Red (osteo), Alcian blue (chondro) and Oil Red O (adipo). i Number of Grem1- (white) or Acan-lineage (grey) clones that had undergone differentiation quantified as % of the total number of clones. fi cells pooled from n = 3 animals, 22 clones per lineage. j Experimental Schema (right). Quantification of the total number of Grem1-lineage cells within the superficial and calcified zones as a percentage of the total number of chondrocytes within the AC at 8 weeks (filled circle, n = 4 mice), 10 weeks (square, n = 3 mice), 18 weeks (triangle, n = 4 mice), 32 weeks (diamond, n = 4 mice) and 58 weeks (open circle, n = 4 mice) of age (left). Bars show s.e.m. k Representative images of adult articular joint showing H&E of zonal organisation of chondrocytes in the superficial zone (SZ), non-calcified zone (NCZ) and calcified zone (CZ) and Grem1-lineage AC cells moving towards the CZ from 8 weeks (middle) to 32 weeks (right) of age. Superficial chondrocytes indicated with yellow arrows. f, i Two-sided Fisher’s exact test. g Two-sided unpaired t test. jTwo-way Anova Tukey’s test. Bars denote s.e.m. Source data are provided as a Source Data file. Mouse image in figure schemas created with BioRender.com.
Fig. 3
Fig. 3. Grem1-lineage articular progenitors cells are lost with age and targeted ablation causes OA.
a Experimental schema. Quantification of total Grem1-lineage articular chondrocytes (AC) as a % of the total ACs. n = 4 animals per time point, except 10wk n = 3. One-way Anova Tukey’s test. b Representative images of the Grem1-TdT articular knee joint from a. c Schematic of the Grem1-Td-DTR knock-in construct (top) and experimental outline. d Representative images of early adult mice articular joints treated with PBS or DT stained with anti-RFP. e Quantification of Grem1 AC cells as a % of the total number of AC chondrocytes in PBS (blue, n = 4 mice) or DT treated (red, n = 7 mice) Grem1-Td-DTR mice. Two-tailed Welch’s t test. f Representative images of ColX staining of Grem1-Td-DTR joints from WT and HOM DT-treated animals, n = 3 mice/group. Boxed regions indicate loss of ColX chondrocytes following ablation of Grem1-expressing articular cells in HOM DT treated mice. g Representative image of DT treated articular joint of Grem1-Td-DTR mice (n = 7 mice) stained with Tol blue and fast green showing pathological changes commonly associated with OA including AC damage indicated by red arrows, h loss of proteoglycan in the AC indicated by yellow arrows, i hypertrophic chondrocytes, j SB invasion, and k meniscus pathology. l Blinded scoring of average OA score following 3 days DT treatment in control wild-type mice (WT-DT, n = 9 mice), homozygous Grem1-Td-DTR mice (HOM-DT, n = 7) or PBS Grem1-Td-DTR mice (HOM-PBS, n = 4). One-way Anova Tukey’s test. m Single cell RNA (scRNA) sequencing experiment schema for isolation of Grem1-lineage articular cells from mouse knee and analysis to show high Grem1 (red), high Acan (blue) or high both Grem1/Acan expressing (magenta) populations. Bars denote s.e.m. Source data are provided as a Source Data file. Mouse image in figure schemas created with BioRender.com.
Fig. 4
Fig. 4. Grem1-lineage single cell transcriptomics revealed a distinct population of articular chondrocytes that can be targeted for therapy.
a Single cell RNA (scRNA) sequencing data showed distinct clusters of cells isolated from the AC and GP of Grem1-TdT mice compared to Lepr-lineage cells isolated from the Lepr-TdT mice. b Heat map depicting unsupervised clustering of top 10 differentially expressed transcripts between the different clusters in a. c Grem1-lineage AC cells co-expressed genes important for AC function (Foxo1) and receptor (Fgfr3) for FGF18 treatment. One-sided chi-Square correlation analysis confirmed co-expression of Foxo1 and Fgfr3 in Grem1 expressing cells (p = 0.00113). d Experiment schema. e Representative images of fluorescent Grem1 lineage tracing in the articular joint with or without Foxo1 deletion (top) with OA lesions highlighted using red arrows, and Toluidine blue and Fast green stain (bottom) with arrows indicating cartilage lesions and chondrocyte disorganisation. n = 5 animals per group. f Percentage of Grem1-lineage ACs per HFP in control Grem1-TdT mice (circle) compared to Grem1-TdT-Foxo1 mice (square), n = 6 mice/group. g Unblinded histopathological OARSI scoring in Grem1-TdT-Foxo1 mice (square) compared to Grem1-TdT mice (circle), n = 5 mice/group. f, g bars denote st.dev. h Experimental schema. i Representative images of joints from Grem1-lineage mice with ColVII induced OA with or without FGF18 treatment with arrows indicating injury site (fluorescence, top), toluidine blue and fast green stained showing proteoglycan loss and lesions indicated by arrows (bottom). j Quantification of the percentage of Grem1-lineage cells with FGF18 treatment (left, n = 6 mice/group), OA score (middle, n = 6 mice/group) and AC thickness (right, n = 5 mice/group). Bars denote s.e.m. fj unpaired, two-tailed t test. Source data are provided as a Source Data file. Mouse image in figure schemas created with BioRender.com.

References

    1. Pereira D, et al. The effect of osteoarthritis definition on prevalence and incidence estimates: a systematic review. Osteoarthr. Cartil. 2011;19:1270–1285. doi: 10.1016/j.joca.2011.08.009. - DOI - PubMed
    1. Sun HB. Mechanical loading, cartilage degradation, and arthritis. Ann. N. Y Acad. Sci. 2010;1211:37–50. doi: 10.1111/j.1749-6632.2010.05808.x. - DOI - PubMed
    1. Hunter DJ, Bierma-Zeinstra S. Osteoarthritis. Lancet. 2019;393:1745–1759. doi: 10.1016/S0140-6736(19)30417-9. - DOI - PubMed
    1. Maiese K. Picking a bone with WISP1 (CCN4): new strategies against degenerative joint disease. J. Transl. Sci. 2016;1:83–85. - PMC - PubMed
    1. Gannon AR, Nagel T, Bell AP, Avery NC, Kelly DJ. Postnatal changes to the mechanical properties of articular cartilage are driven by the evolution of its collagen network. Eur. Cell Mater. 2015;29:105–121. doi: 10.22203/eCM.v029a09. - DOI - PubMed

Publication types

Substances