. 2023 Oct 31;14(1):6934.
doi: 10.1038/s41467-023-42532-8.

Genome-wide association analysis of plasma lipidome identifies 495 genetic associations

Affiliations

Genome-wide association analysis of plasma lipidome identifies 495 genetic associations

Linda Ottensmann et al. Nat Commun. .

Abstract

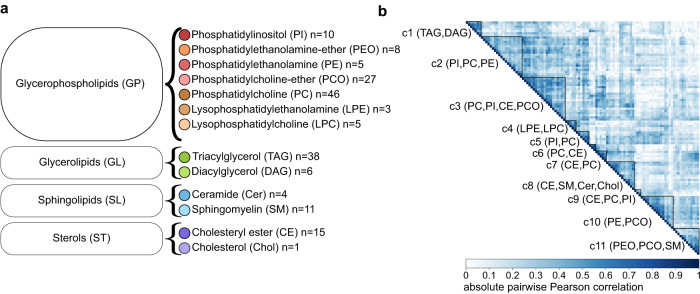
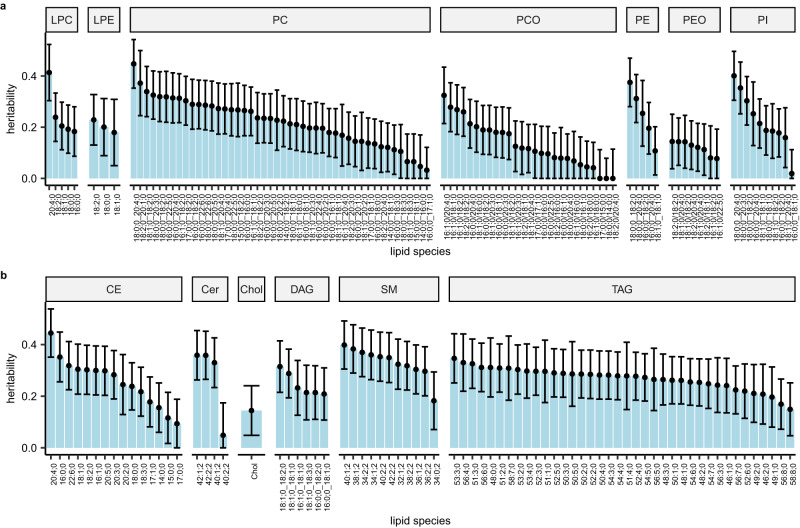
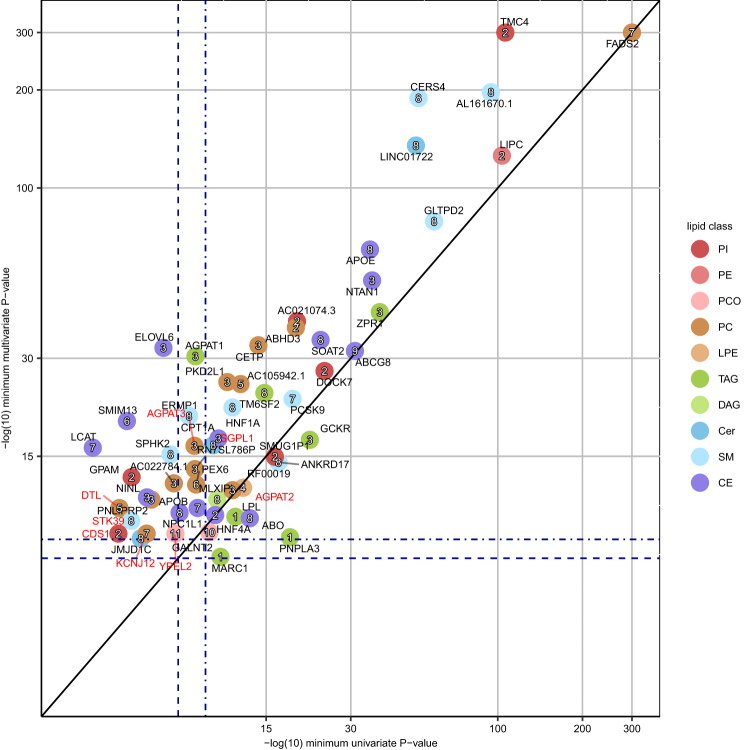
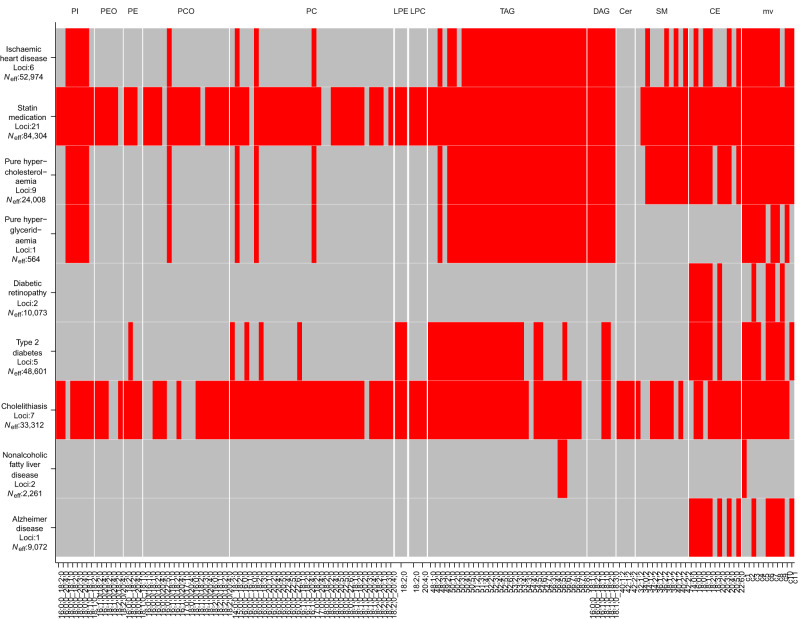
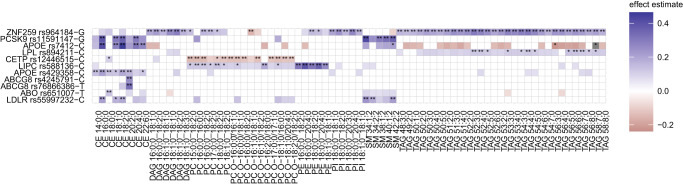
The human plasma lipidome captures risk for cardiometabolic diseases. To discover new lipid-associated variants and understand the link between lipid species and cardiometabolic disorders, we perform univariate and multivariate genome-wide analyses of 179 lipid species in 7174 Finnish individuals. We fine-map the associated loci, prioritize genes, and examine their disease links in 377,277 FinnGen participants. We identify 495 genome-trait associations in 56 genetic loci including 8 novel loci, with a considerable boost provided by the multivariate analysis. For 26 loci, fine-mapping identifies variants with a high causal probability, including 14 coding variants indicating likely causal genes. A phenome-wide analysis across 953 disease endpoints reveals disease associations for 40 lipid loci. For 11 coronary artery disease risk variants, we detect strong associations with lipid species. Our study demonstrates the power of multivariate genetic analysis in correlated lipidomics data and reveals genetic links between diseases and lipid species beyond the standard lipids.


Conflict of interest statement

K.S. is CEO of Lipotype GmbH. K.S. and C.K. are shareholders of Lipotype GmbH. M.J.G. is employee of Lipotype GmbH. The remaining authors declare no competing interests.

Figures

Fig. 1
Fig. 1. Details of lipid species measured in the GeneRISK cohort.
a The 179 lipid species belong to 13 lipid classes and 4 categories. The lipid class colors are identical to those used in the other figures. b Heatmap of the absolute pairwise Pearson correlations between the lipid species included in the 11 clusters of the multivariate GWAS. The clusters are marked by black lines and labeled by the included lipid classes. The members of each cluster are listed in Supplementary Data 1.
Fig. 2
Fig. 2. Heritability estimates of lipid species.
a Glycerophospholipids, b Glycerolipids, Sphingolipids, and Sterols. Data are presented as heritability estimate ±1.96*SE. The lipid species are presented in descending order of the heritability estimates. Heritability estimation was performed using n = 7174 biologically independent samples.
Fig. 3
Fig. 3. Comparison of the univariate and multivariate P-values for 56 lipid-associated loci.
The loci are colored by the lipid class from the univariate analysis and labeled by the cluster number from the multivariate analysis. The x-axis shows the P-values of the top associated univariate lead variant of the loci. The y-axis shows the P-values of the top associated multivariate lead variant of the loci. Two-sided P-values were calculated using a linear-mixed-model (uv) and canonical correlation analysis (mv). If no variant reached P < 5e-8 for the locus in univariate analysis, the minimum univariate P-value of the lead variant of the multivariate analysis is shown. Known loci and novel loci are annotated by the locus name in black and red, respectively. Dark blue dashed lines represent the genome-wide significance level (P < 5e-8) and dark blue dot-dashed lines represent the multiple testing-corrected significance level (uv: 7.352941e-10, mv: 4.545455e-9). Black line shows the diagonal. The lipid class names are listed in Fig. 1. The axes are capped at 300.
Fig. 4
Fig. 4. Heatmap of PheWAS associations for selected disease endpoints.
Each entry in the heatmap represents a possible association between a disease group (row) and a lipidome trait (column). The red color indicates that at least one variant among the lead variants or representative variants of the lipidome trait is also associated with the disease at the multiple testing-corrected threshold P < 5.24659e-11 and the lipidome trait and disease colocalize at CLPP > 0.01. Two-sided P-values for lipidome traits were calculated using a linear-mixed-model (uv) and canonical correlation analysis (mv). Two-sided P-values for disease endpoints were calculated using mixed-model logistic regression. The gray color denotes that no such association is observed. The columns are split by lipid classes. The effective sample size Neff (see the “Methods” section) and the number of loci are given beneath each disease endpoint.
Fig. 5
Fig. 5. Effect estimates of 11 CAD risk-increasing alleles on lipid species.
Variant ids are defined as rsid-risk-increasing allele. Included are species that reach the multiple testing-corrected threshold of 7.352941e-10 for at least one of the variants. Associations reaching the genome-wide-significant (P < 5e-8) or the multiple testing-corrected threshold are indicated by one or two asterisks, respectively. Colored effect estimates are shown for the associations reaching nominal significance corrected for the number of PCs explaining 90% of the variance (P < 7.352941e-4). Two-sided P-values for lipid species were calculated using a linear-mixed-model.

Similar articles

Cited by

References

    1. Vos T, et al. Global burden of 369 diseases and injuries in 204 countries and territories, 1990–2019: a systematic analysis for the Global Burden of Disease Study 2019. Lancet. 2020;396:1204–1222. doi: 10.1016/S0140-6736(20)30925-9. - DOI - PMC - PubMed
    1. Wienke A, Herskind AM, Christensen K, Skytthe A, Yashin AI. The heritability of CHD mortality in Danish twins after controlling for smoking and BMI. Twin Res. Hum. Genet. 2005;8:53–59. doi: 10.1375/twin.8.1.53. - DOI - PubMed
    1. Borén J, et al. Low-density lipoproteins cause atherosclerotic cardiovascular disease: pathophysiological, genetic, and therapeutic insights: a consensus statement from the European Atherosclerosis Society Consensus Panel. Eur. Heart J. 2020;41:2313–2330. doi: 10.1093/eurheartj/ehz962. - DOI - PMC - PubMed
    1. Tabassum R, Ripatti S. Integrating lipidomics and genomics: emerging tools to understand cardiovascular diseases. Cell Mol. Life Sci. 2021;78:2565–2584. doi: 10.1007/s00018-020-03715-4. - DOI - PMC - PubMed
    1. Stegemann C, et al. Lipidomics profiling and risk of cardiovascular disease in the prospective population-based Bruneck study. Circulation. 2014;129:1821–1831. doi: 10.1161/CIRCULATIONAHA.113.002500. - DOI - PubMed

Publication types