. 2023 Oct 31;14(1):6941.
doi: 10.1038/s41467-023-42541-7.

Antigen presentation by B cells enables epitope spreading across an MHC barrier

Affiliations

Antigen presentation by B cells enables epitope spreading across an MHC barrier

Cecilia Fahlquist-Hagert et al. Nat Commun. .

Abstract

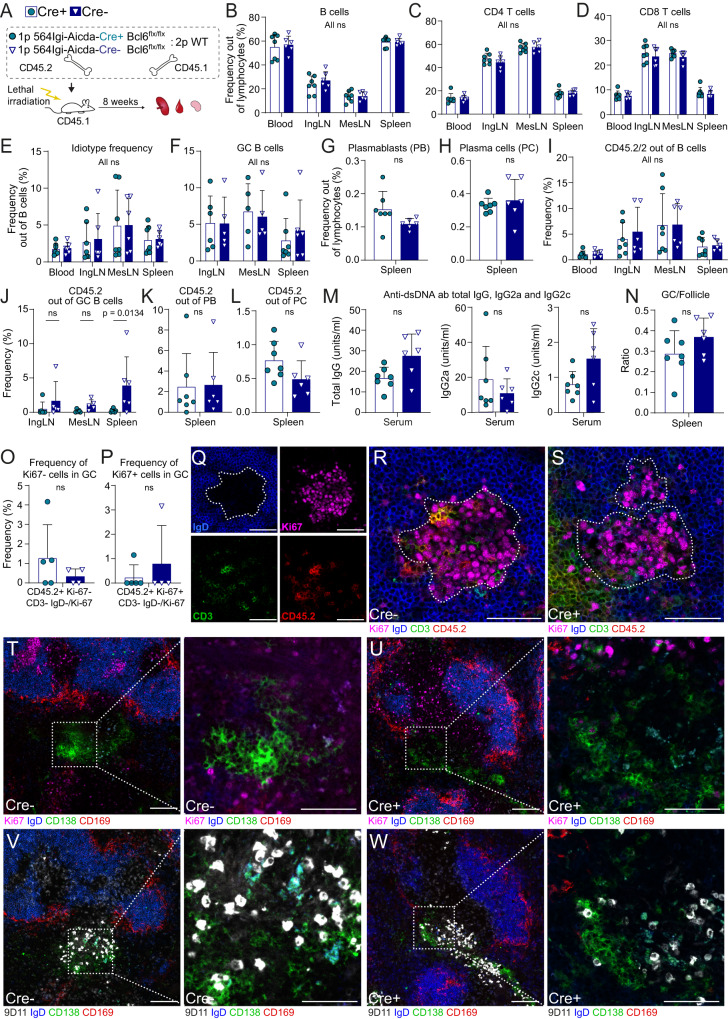
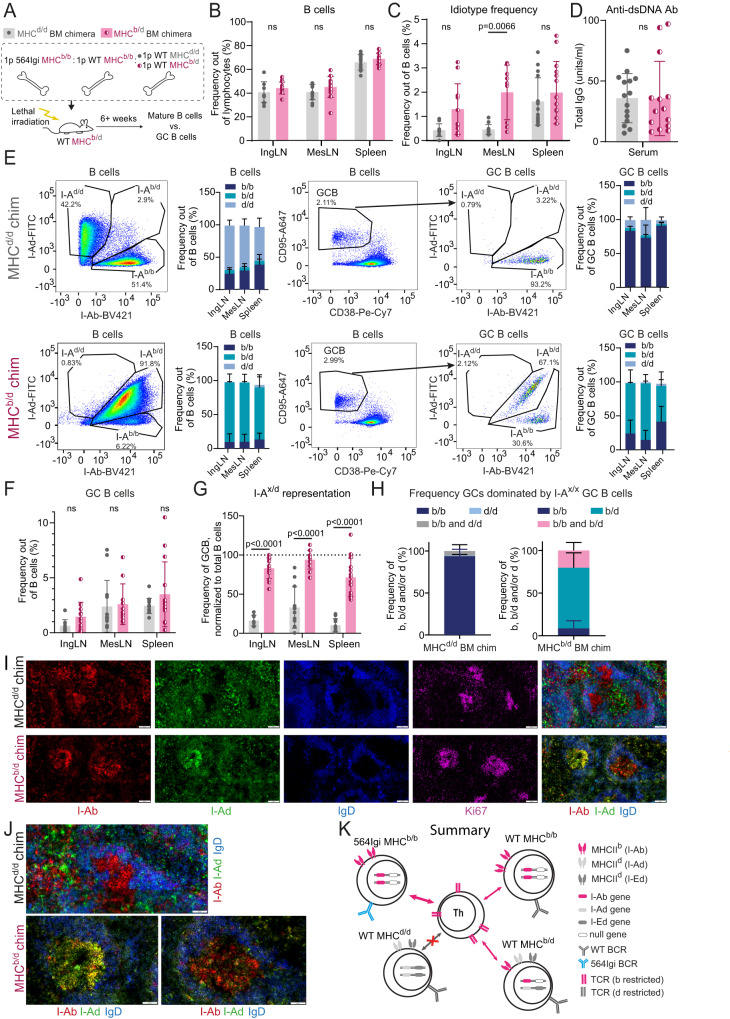
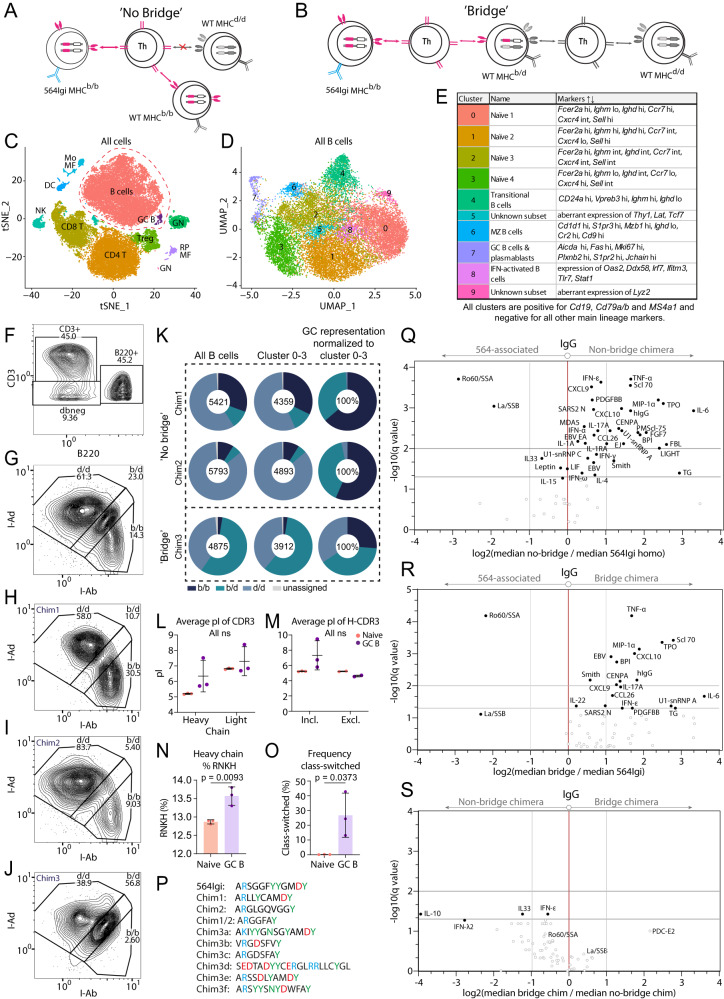
Circumstantial evidence suggests that B cells may instruct T cells to break tolerance. Here, to test this hypothesis, we used a murine model in which a single B cell clone precipitates an autoreactive response resembling systemic lupus erythematosus (SLE). The initiating clone did not need to enter germinal centers to precipitate epitope spreading. Rather, it localized to extrafollicular splenic bridging channels early in the response. Autoantibody produced by the initiating clone was not sufficient to drive the autoreactive response. Subsequent epitope spreading depended on antigen presentation and was compartmentalized by major histocompatibility complex (MHC). B cells carrying two MHC haplotypes could bridge the MHC barrier between B cells that did not share MHC. Thus, B cells directly relay autoreactivity between two separate compartments of MHC-restricted T cells, leading to inclusion of distinct B cell populations in germinal centers. Our findings demonstrate that B cells initiate and propagate the autoimmune response.


Conflict of interest statement

The authors declare that no competing interests.

Figures

Fig. 1
Fig. 1. Germinal center initiation occurs after the initiating autoreactive clone has been outcompeted from the mature repertoire.
A Schematic overview of experimental setup to evaluate the kinetics of bone marrow reconstitution. 1p = 1 part, 2p = 2 parts. B Frequency of splenic B cells out of live singlet lymphocytes, as a function of time post reconstitution. The gray shaded area indicates the normal range as measured in 7 C57BL/6J controls. C Frequency of splenic Id+ (knock-in receptor) B cells out of total B cells, as a function of time post reconstitution. D Frequency of splenic GC B cells out of total B cells, as a function of time post reconstitution. BD show Mean ± SEM for n = 3, 1 (week 2), 7, 7 (week 3), 3, 4 (week 4), 7, 5 (week 6) 564Igi Hki/kiKki/ki and 564Igi Hki/kiKwt/wt chimeras, respectively. Statistical significance shown for two-way ANOVA with Šidák’s post-test. ns = p > 0.05.
Fig. 2
Fig. 2. The initiating autoreactive clone does not need to enter GCs to break tolerance.
A Experimental setup. 1p = 1 part, 2p = 2 parts. Frequencies of B cells B, CD4 C, CD8 D T cells, and idiotype B cells E in blood, spleen, inguinal and mesenteric lymph nodes (IngLN and MesLN, respectively) of Aicda-Cre+ and Aicda-Cre- Bcl6flx/flx 564Igi mixed chimeras. Frequencies of GC B cells F, plasmablasts G, and plasma cells H in secondary lymphoid tissues. Frequencies of CD45.2/2 out of B cells I, GC B cells J, plasmablasts K, and plasma cells L. Total IgG (left), IgG2a (middle) and IgG2c (right) anti-dsDNA antibodies in sera M. N Frequency of GCs per follicle. Frequency of CD45.2+CD3-Ki67- O versus CD45.2+CD3-Ki67+ P GC B cells within the GCs (as determined by IgD border). Representative micrograph showing splenic GC of Cre- chimera in split channel Q and 4-channel overlay R. Broken white line indicates GC border, based on IgD exclusion zone (top left corner). S Representative micrograph showing splenic GC of Cre+ chimera in 4-channel overlay. T, V Representative micrographs showing splenic bridging channel in two serial sections of Cre- chimera (left) with higher magnification views of the region of interest indicated by the white boxes (right). U, W Representative micrographs showing splenic bridging channel in two serial sections of Cre+ chimera (left) with higher magnification views of the region of interest indicated by the white boxes (right). Data in BN represent two experiments with total n = 7 (Cre + ) and 6 (Cre-) mice, OS represent one experiment with n = 5 (Cre + ) and 4 (Cre-) mice, micrographs in TW represent two mice in each group. Bars and error bars signify mean ± SD in all panels. Two-way ANOVA with Šidák’s post-test was used for statistical comparisons in BF and IJ, and unpaired, two-tailed t-test with Welch’s correction in G, H, and KP. ns = p > 0.05. For micrographs, color intensities were adjusted uniformly for visual clarity. Scale bars are 50 µm in QS and righthand panels in TW, and 100 µm in lefthand panels of TW.
Fig. 3
Fig. 3. Autoantibody derived from the initiating clone is insufficient to break tolerance, even under permissive conditions.
A Experimental setup to evaluate the potential of the autoreactive antibody from the initiating clone (Idiotype, Id) to drive a break in tolerance in a setting deficient in T follicular regulatory cells, compared to no antibody (not injected), a pool of total normal murine IgG (mIgG), or the anti-idiotype (αId). Frequencies of B cells B, CD4 C, CD8 D T cells, GC B cells E and plasmablasts/plasma cells F in IngLN, MesLN and spleen across the four groups. G Schematic representation of assays and nomenclature for identification of Id+ (564Igi) B cells (top left), anti-idiotypic B cells (top right), idiotype antibodies (564 C11) in sera (bottom left), and anti-idiotypic antibodies (9D11) in sera (bottom right). H Idiotype B cell frequency out of total B cells across IngLN, MesLN and spleen in the four groups. I Anti-Idiotype B cell frequency out of total B cells across IngLN, MesLN and spleen in the four groups. Idiotype J and anti-idiotype K antibodies in sera at 0, 14, and 35 days. L Experimental setup to evaluate the potential of the autoreactive antibody from the initiating clone (Idiotype, Id) to drive a break in tolerance during bone marrow reconstitution, compared to no antibody (not injected). 1p = 1 part. Frequencies of B cells M, CD4 N, CD8 O T cells, GC B cells P, and plasmablasts/plasma cells Q in IngLN, MesLN and spleen across the two groups. R Idiotype antibodies (564 C11) in sera of mice presented in panels M-Q. For AK, n = 3 mice for mIgG, Id and αId, and n = 2 mice for No Ab. For LR, n = 4 (No Ab) and 6 (Id) mice. Bars and error bars signify mean±SD in all panels. Two-way ANOVA with Tukey’s post-test was used for comparisons of data in panels B-F and H-K. Two-way ANOVA with Šidák’s post-test was used for MP and R, and unpaired, two-tailed t-test with Welch’s correction was used for statistical comparisons of data in Q. ns = p > 0.05.
Fig. 4
Fig. 4. The first autoreactive clone can only break tolerance within an MHC congenic compartment.
A Experimental setup. 1p = 1 part. Frequencies of B cells B and idiotype positive B cells C 6–8 weeks post reconstitution, in inguinal and mesenteric lymph nodes (IngLN and MesLN), and spleen. D Levels of anti-dsDNA in serum 7–16 weeks post reconstitution. E For MHCd/d (top) and MHCb/d (bottom) chimeras, representative bivariate plots with gating for I-Ab/b, I-Ad/d and I-Ab/d positive cells within the total B-cell population (left); a summary graph of these data (second from left); a representative bivariate plot showing gating for the germinal center (GC) B-cell population (middle), and I-Ab/b, I-Ad/d and I-Ab/d gates within the GC B-cell population (second from right); followed by a summary graph of these data (right). F Frequencies of GC B cells across IngLN, MesLN and spleen. G Representation of I-Ad/d and I-Ab/d cells within GCs relative to representation in mature B-cell compartment, in direct competition with I-Ab/b cells in MHCd/d and MHCb/d chimeras, respectively. Dashed line indicates 1:1 representation. H Frequency of individual GCs dominated by I-Ab/b, I-Ad/d cells or both in MHCd/d chimeras (left), or dominated by I-Ab/b, I-Ab/d or both in MHCb/d chimeras (right). Quantification of 14-53 GCs/mouse in 10 (MHCd/d) and 3 (MHCb/d) chimeras respectively, for a total of 487 GCs in spleen. I Representative single-channel images and overlay of I-Ab, I-Ad, and IgD (right) of GCs in spleen of an MHCd/d (top) and an MHCb/d chimera (bottom). J Zoomed-in representative images of splenic GCs of an MHCd/d (top) and an MHCb/d chimera (bottom). Overlays colored as in I. K Schematic interpretation of data. Panels BG represent data from n = 15 (MHCd/d) and 14 (MHCb/d) chimeras. Bars and error bars represent mean ± SD. Statistical comparison using two-way ANOVA with Šidák’s post-test in B, C, F, and G, and unpaired, two-tailed t-test with Welch’s correction in D. ns = p > 0.05. Images in IJ are crop-outs of tile scans of spleen sections. Color intensities were adjusted uniformly for visual clarity. Scale bar represents 100 µm I and 50 µm J.
Fig. 5
Fig. 5. A bridging B cell compartment enables epitope spreading across an MHC barrier.
A Experimental setup. 1p = 1 part. B cells B and idiotype+ B cells C in inguinal and mesenteric lymph nodes (IngLN and MesLN), and spleen. D Anti-dsDNA antibodies in sera. E Representative bivariate plot showing gating for I-Ab/b, I-Ad/d, and I-Ab/d cells among B cells (left); a summary graph of these data (second from left); a representative bivariate plot showing gating for GC B cells (middle), and I-Ab/b, I-Ad/d and I-Ab/d gates among GC B cells (second from right); followed by a summary graph of these data (right). F GC B-cell frequencies across lymphoid organs. G Representation of I-Ad cells within GCs relative to their representation in the mature B-cell compartment, across IngLN, MesLN, and spleen. The dashed line through 100% indicates 1:1 representation. H Median fluorescence intensity (MFI) for I-Ab (left) and I-Ad (right), within the I-Ab/b, I-Ab/d, and I-Ad/d B-cell compartments of the chimeras, across IngLN, MesLN, and spleen. I Representative images of GCs in spleen of a bridge chimera. J Zoomed-in representative images of GCs in the spleens of bridge chimeras. K Frequencies of individual GCs dominated by I-Ab/b, I-Ad/d, or both. Quantification based on 6–50 GCs/mouse in 13 mice for a total of 326 GCs. *This population can consist of I-Ab/d positive cells only or any combination of I-Ab/b, I-Ab/d and/or I-Ad/d. L Plasma cell and plasmablast frequencies across IngLN, MesLN, and spleen. M I-A haplotype distribution among plasmablasts (left) and plasma cells (right) across IngLN, MesLN, and spleen. N Schematic interpretation of results. Throughout panels, error bars represent mean ± SD, and n = 27 mice total from two independent experiments. In B, C, F, and G, Kruskal–Wallis test with Dunn’s post-test was used, in H, two-way ANOVA with Tukey’s post-test, and in L, one-way ANOVA with Tukey’s post-test. Images in IJ are crop-outs of tile scans of spleen sections. Color intensities were adjusted uniformly for visual clarity. The data were procured 7–9 weeks post reconstitution. Scale bars represent 100 µm I and 50 µm J.
Fig. 6
Fig. 6. Sequence and array analyses of no bridge and bridge chimeras.
Hypothesized cell interactions for germinal center (GC) entry in no bridge chimeras A and bridge chimeras B. C Global clustering of ~38,000 splenocytes from no bridge (Chimera 1 and 2) and bridge (Chimera 3) chimeras. For the bridge chimera, splenocytes were additionally enriched for GC B cells. D UMAP dimensionality reduction of B and GC B-cell populations from C. E Cluster definitions for D. Highly differentially expressed markers are listed. F Gating for CD3 + , B220+ and dbneg populations based on Abseq. G Stratification of B220+ population into MHCb/b (b/b), MHCb/d (b/d) or MHCd/d (d/d), based on Abseq. As F but split for no bridge chimera 1 H and 2 I, and bridge chimera 3 J. K MHCII haplotype distribution among total and naive (Clusters 0–3 from D) B cells, and among GC B cells (Cluster 7 from D) relative to their representation in the primary repertoire, for each of the three chimeras. L Average isoelectric point for the agglomerated heavy and light chain CDR3s of naive (peach) and GC (purple) B cells. M Average isoelectric point for the agglomerated heavy chain CDR3s of naive (peach) vs. GC (purple) B cells, stratified by whether they are predicted to be included in (I-Ab/b of chimeras 1 + 2 and I-Ad/d of chimera 3) or excluded from (I-Ad/d of chimera 1 + 2) the autoreactive response. N Frequency of arginine, asparagine, lysine, and histidine in the agglomerated CDR3s of naive vs. GC B cells. O Class-switched frequency among naive vs. GC B cells. P CDR3 sequences of the 10 most expanded GC B-cell clones. Q Volcano plot of median IgG signal intensities in no bridge chimeras (n = 14) vs. homozygous 564Igi mice (n = 12). R As Q, but bridge chimeras (n = 16) vs. homozygous 564Igi mice (n = 12). S As Q, but no bridge chimeras (n = 14) vs. bridge chimeras (n = 16). Bars represent mean ± SD. Statistical comparison in L and M by two-way ANOVA with Šidák’s post-test, and in N and O unpaired, two-tailed t-test, for n = 3 mice. ns = p > 0.05.
Fig. 7
Fig. 7. Proteomics analyses of autoantigens.
A Schematic overview of experimental approach. B Volcano plot of mean differences in log2[iBAQ values] of clone 564 C11 pulldowns (n = 4) and murine serum IgG pulldowns (n = 4). The line at -log10(q value) = 2 indicates the significance threshold for paired t-test at p = 0.01. C Plot of PC1 and PC2 for principal component analysis of five bridge chimeras, five no bridge chimeras, a pool of five 564Igi homozygous sera, and a pool of six C57BL/6J sera. D Heatmap of individual hits for the samples represented in the PCA analysis in C. Some graphical elements of A were created with BioRender.
Fig. 8
Fig. 8. Proposed model and graphical summary of the main finding.
Top, proposed model: the initiating autoreactive clone localizes to the extrafollicular splenic bridging channels, where it may interact with DCIR2+ DCs and elicit a break-of-tolerance in protoautoreactive CD4 T cells, which can subsequently support the formation of autoreactive GCs seeded by wild-type derived B cells. Bottom, summary of the main finding: in mixed chimeras, wild-type B cells only participate in the autoreactive response if they share the MHC haplotype with the initiating clone (left); however, in the presence of a bridging B-cell compartment carrying both MHC haplotypes, these cells are included in the response (right).

References

    1. Lerner A, Jeremias P, Matthias T. The World incidence and prevalence of autoimmune diseases is increasing. Int. J. Celiac Dis. 2016;3:151–155. doi: 10.12691/ijcd-3-4-8. - DOI
    1. O’Neill SK, et al. Antigen-specific B cells are required as APCs and autoantibody-producing cells for induction of severe autoimmune arthritis. J. Immunol. 2005;174:3781–3788. doi: 10.4049/jimmunol.174.6.3781. - DOI - PubMed
    1. Serreze DV, et al. B lymphocytes are critical antigen-presenting cells for the initiation of T cell-mediated autoimmune diabetes in nonobese diabetic mice. J. Immunol. 1998;161:3912–3918. doi: 10.4049/jimmunol.161.8.3912. - DOI - PubMed
    1. Wong FS, et al. Investigation of the role of B-cells in type 1 diabetes in the NOD mouse. Diabetes. 2004;53:2581–2587. doi: 10.2337/diabetes.53.10.2581. - DOI - PubMed
    1. Jelcic I, et al. Memory B cells activate brain-homing, autoreactive CD4(+) T cells in multiple sclerosis. Cell. 2018;175:85–100 e123. doi: 10.1016/j.cell.2018.08.011. - DOI - PMC - PubMed

Publication types

Substances