

METTL3-mediated m6A methylation of C1qA regulates the Rituximab resistance of diffuse large B-cell lymphoma cells
- PMID: 37907575
- PMCID: PMC10618261
- DOI: 10.1038/s41420-023-01698-2
METTL3-mediated m6A methylation of C1qA regulates the Rituximab resistance of diffuse large B-cell lymphoma cells
Abstract
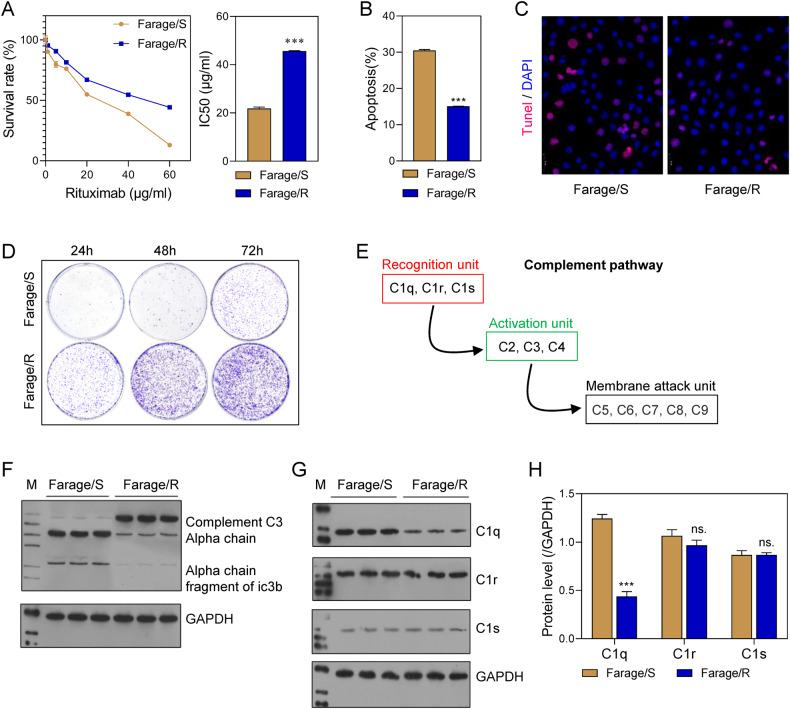
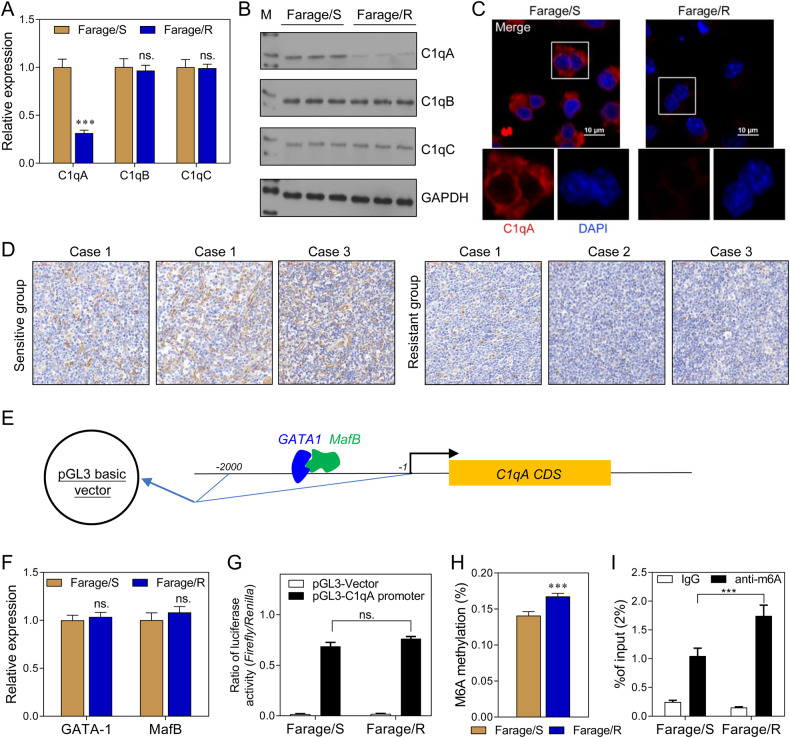
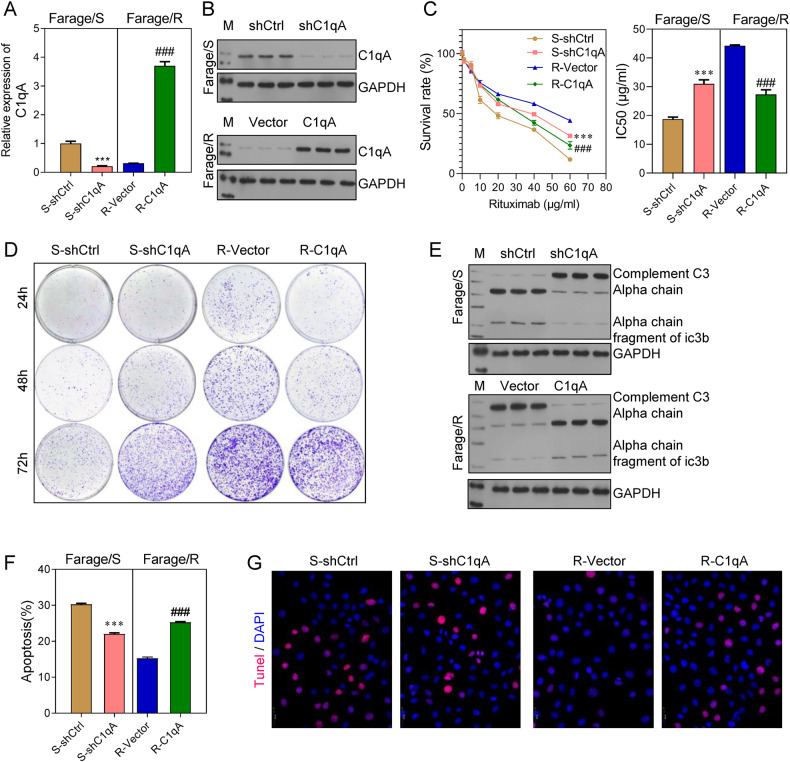
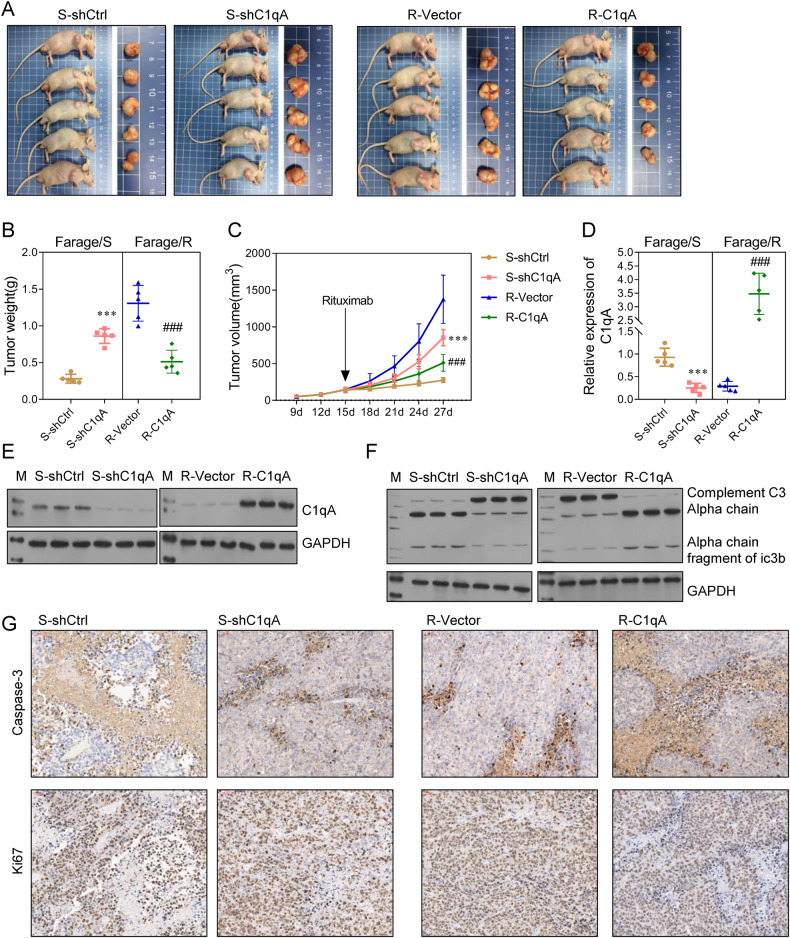
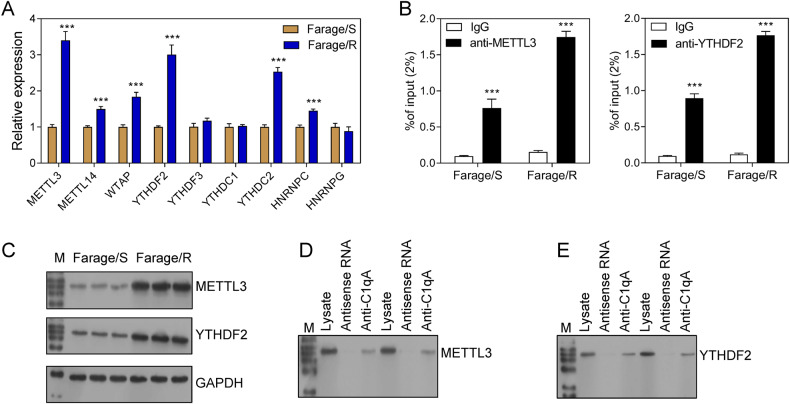
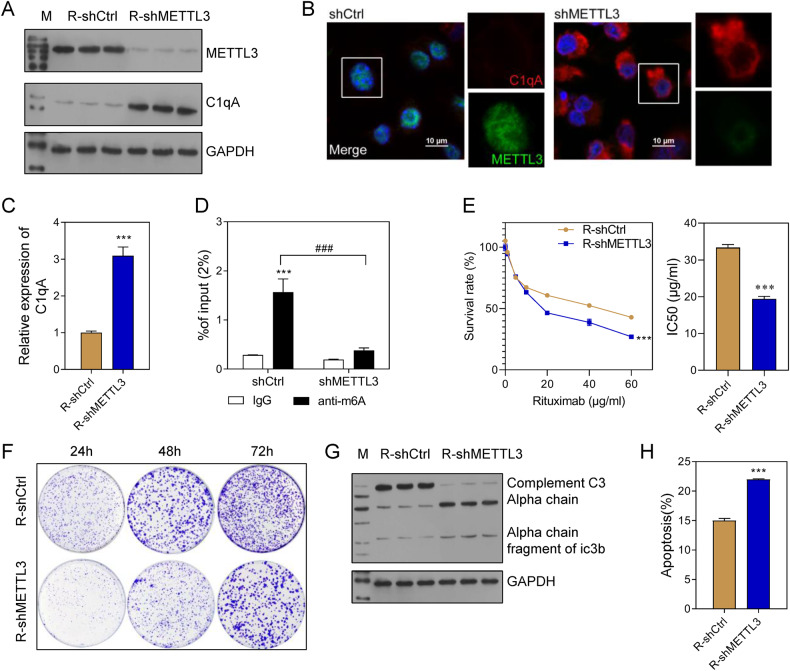
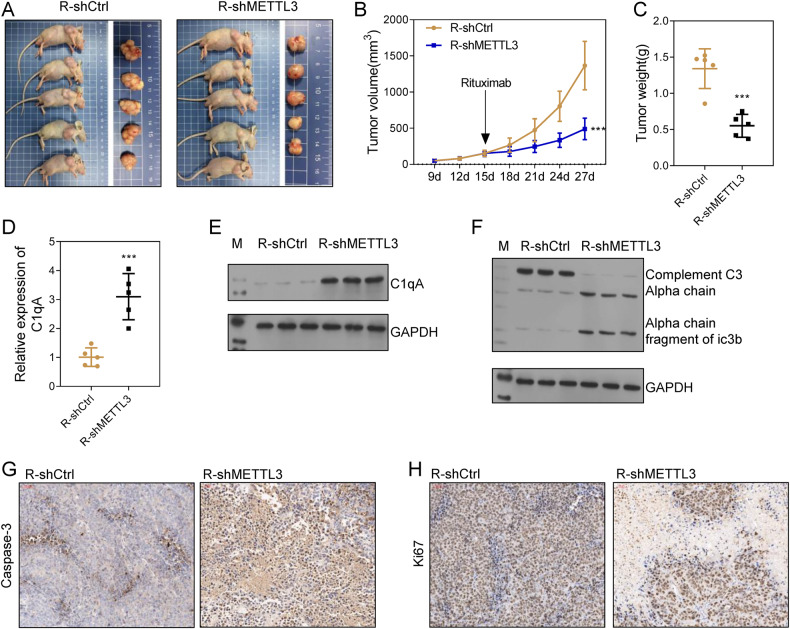
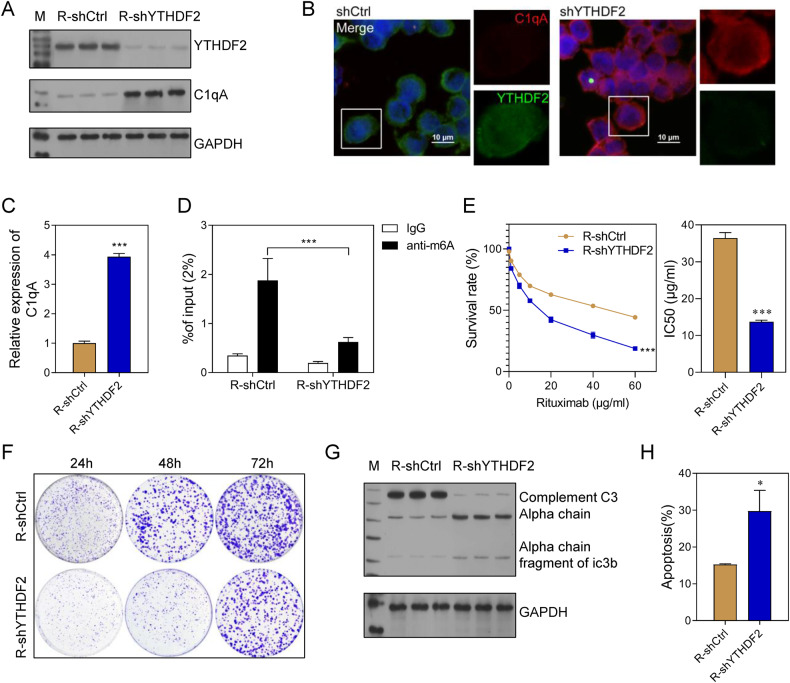
Rituximab has been incorporated into the standard treatment regimen for diffuse large B-cell lymphoma (DLBCL), and induces the death of tumor cells via complement-dependent cytotoxicity (CDC). Unfortunately, the resistance of DLBCL cells to Rituximab limits its clinical usefulness. It remains unclear whether the complement system is related to Rituximab resistance in DLBCL. A Rituximab-resistant DLBCL cell line (Farage/R) was generated under the stress of Rituximab. Constituent proteins of the complement system in wild-type Farage cells (Farage/S) and Farage/R cells were analyzed by qPCR, western blotting, and immunofluorescence. In vitro and in vivo knockdown and overexpression studies confirmed that the complement 1Q subcomponent A chain (C1qA) was a regulator of Rituximab resistance. Finally, the mechanism by which C1qA is regulated by m6A methylation was explored. The reader and writer were identified by pull-down studies and RIP-qPCR. Activity of the complement system in Farage/R cells was suppressed. C1qA expression was reduced in Farage/R cells due to post-transcriptional regulation. Furthermore, in vitro and in vivo results showed that C1qA knockdown in Farage/S cells decreased their sensitivity to Rituximab, and C1qA overexpression in Farage/R cells attenuated the Rituximab resistance of those cells. Moreover, METTL3 and YTHDF2 were proven to be the reader and writer for m6A methylation of C1qA, respectively. Knockdown of METTL3 or YTHDF2 in Farage/R cells up-regulated C1qA expression and reduced their resistance to Rituximab. In summary, the aberrant downregulation of C1qA was related to Rituximab resistance in DLBCL cells, and C1qA was found to be regulated by METTL3- and YTHDF2-mediated m6A methylation. Enhancing the response of the complement system via regulation of C1qA might be an effective strategy for inhibiting Rituximab resistance in DLBCL.
© 2023. The Author(s).
Conflict of interest statement
The authors declare no competing interests.
Figures
Similar articles
-
[Relationship of C1QA level and therapeutic effect and prognosis of DLBCL patients treated with R-CHOP].Zhonghua Zhong Liu Za Zhi. 2021 Dec 23;43(12):1310-1315. doi: 10.3760/cma.j.cn112152-20200307-00179. Zhonghua Zhong Liu Za Zhi. 2021. PMID: 34915642 Chinese.
-
The N6-methyladenosine METTL3 regulates tumorigenesis and glycolysis by mediating m6A methylation of the tumor suppressor LATS1 in breast cancer.J Exp Clin Cancer Res. 2023 Jan 7;42(1):10. doi: 10.1186/s13046-022-02581-1. J Exp Clin Cancer Res. 2023. PMID: 36609396 Free PMC article.
-
Reverse effect of Semaphorin-3F on rituximab resistance in diffuse large B-cell lymphoma via the Hippo pathway.Chin Med J (Engl). 2023 Jun 20;136(12):1448-1458. doi: 10.1097/CM9.0000000000002686. Epub 2023 Apr 28. Chin Med J (Engl). 2023. PMID: 37114652 Free PMC article.
-
Rituximab: a review of its use in non-Hodgkin's lymphoma and chronic lymphocytic leukaemia.Drugs. 2003;63(8):803-43. doi: 10.2165/00003495-200363080-00005. Drugs. 2003. PMID: 12662126 Review.
-
Mechanism and Treatment of Rituximab Resistance in Diffuse Large Bcell Lymphoma.Curr Cancer Drug Targets. 2019;19(9):681-687. doi: 10.2174/1568009619666190126125251. Curr Cancer Drug Targets. 2019. PMID: 31142246 Review.
Cited by
-
The role of RNA methylation in tumor immunity and its potential in immunotherapy.Mol Cancer. 2024 Jun 20;23(1):130. doi: 10.1186/s12943-024-02041-8. Mol Cancer. 2024. PMID: 38902779 Free PMC article. Review.
-
RNA modifications in cancer.MedComm (2020). 2025 Jan 10;6(1):e70042. doi: 10.1002/mco2.70042. eCollection 2025 Jan. MedComm (2020). 2025. PMID: 39802639 Free PMC article. Review.
-
Research progress on N6-methyladenosine and non-coding RNA in multiple myeloma.Discov Oncol. 2025 Apr 25;16(1):615. doi: 10.1007/s12672-025-02386-6. Discov Oncol. 2025. PMID: 40281359 Free PMC article. Review.
-
Exploration of biomarkers for predicting the prognosis of patients with diffuse large B-cell lymphoma by machine-learning analysis.BMC Immunol. 2025 Aug 20;26(1):61. doi: 10.1186/s12865-025-00738-z. BMC Immunol. 2025. PMID: 40836320 Free PMC article.
-
Expression Profile and Prognostic Significance of Pivotal Regulators for N7-Methylguanosine Methylation in Diffuse Large B-Cell Lymphoma.Mol Biotechnol. 2024 Oct 22. doi: 10.1007/s12033-024-01264-w. Online ahead of print. Mol Biotechnol. 2024. PMID: 39436635
References
LinkOut - more resources
Full Text Sources
Miscellaneous
