. 2023 Oct 31;13(1):18762.
doi: 10.1038/s41598-023-46053-8.

A two-arm analysis of the immune response to heterologous boosting of inactivated SARS-CoV-2 vaccines

Affiliations

A two-arm analysis of the immune response to heterologous boosting of inactivated SARS-CoV-2 vaccines

Arnone Nithichanon et al. Sci Rep. .

Abstract

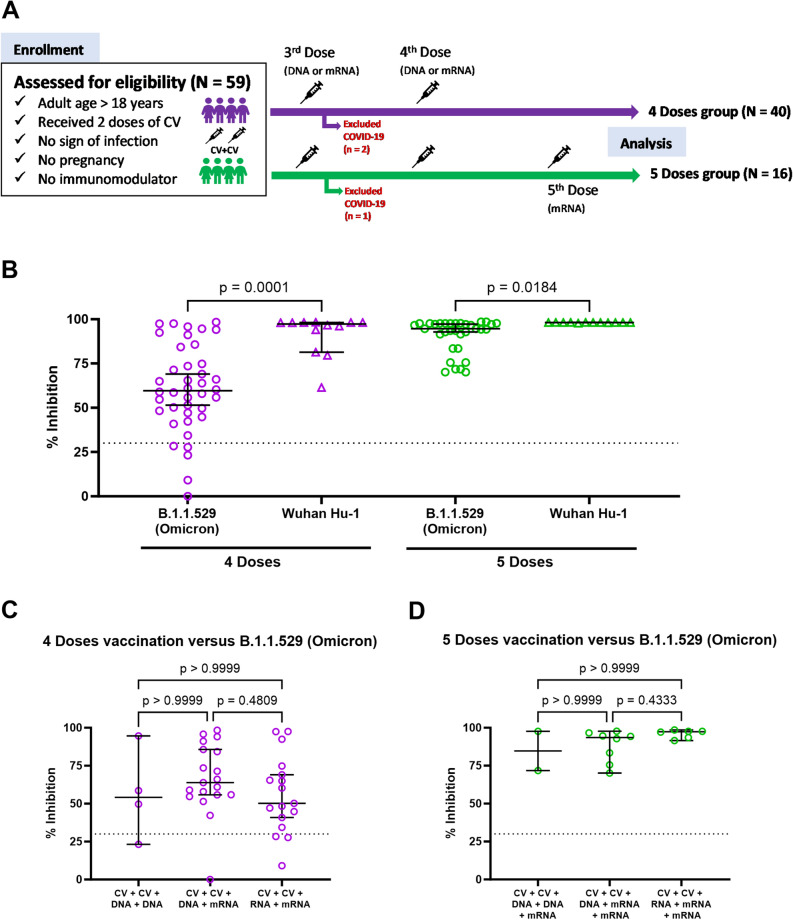
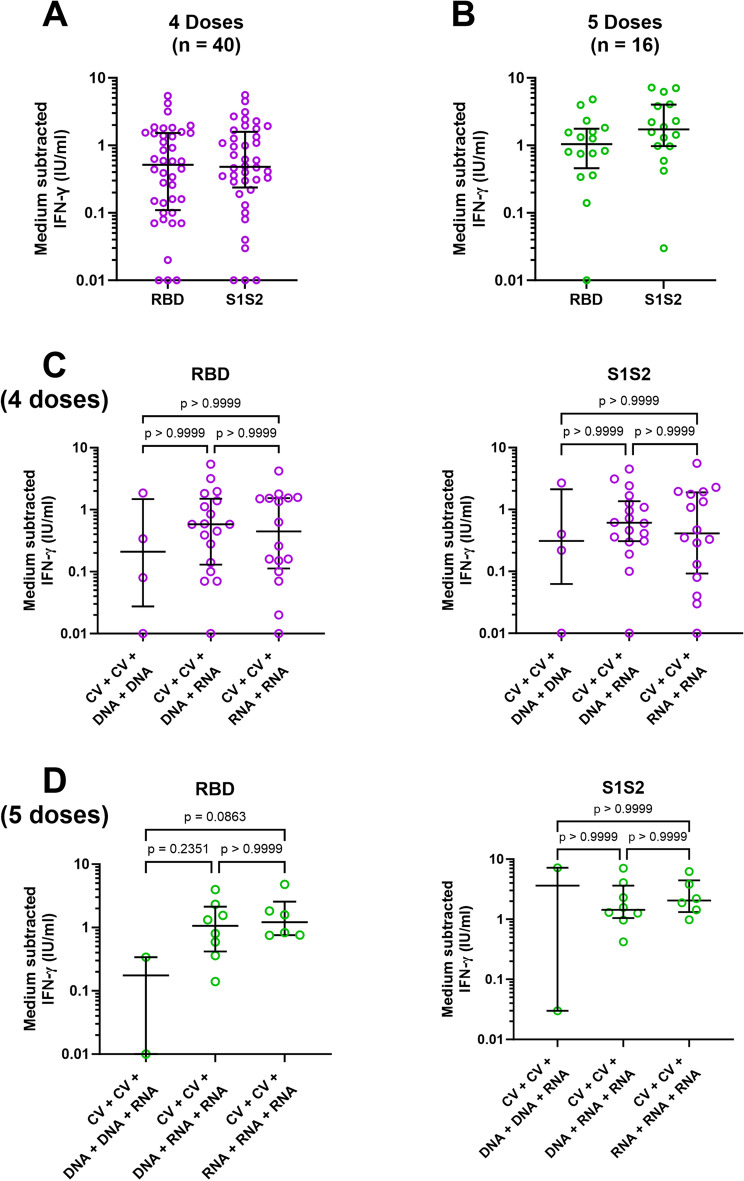
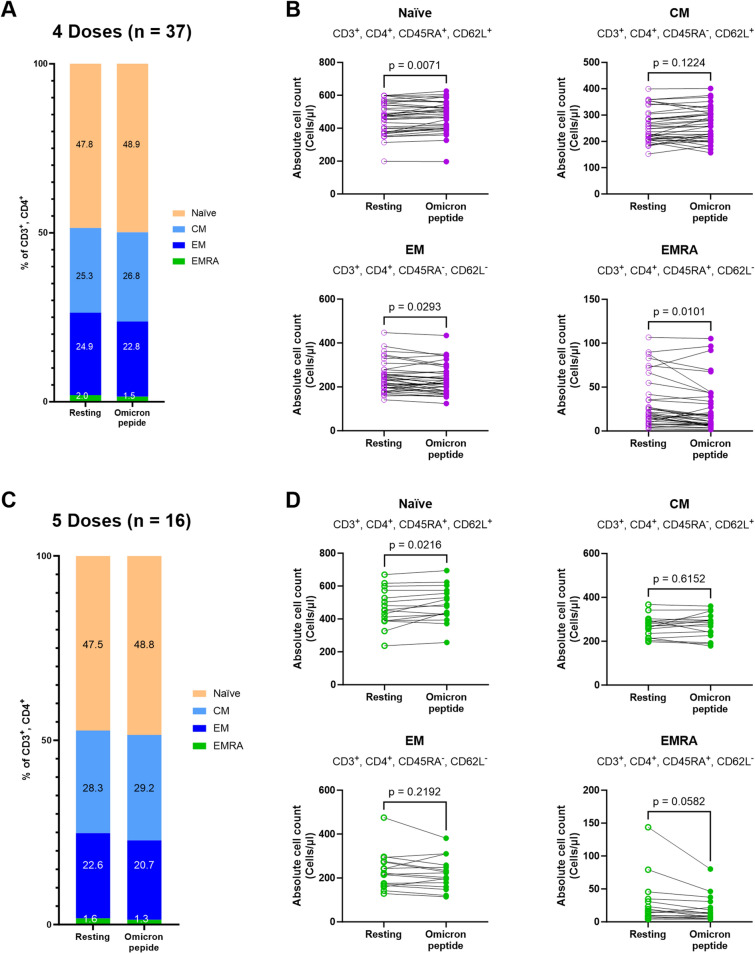
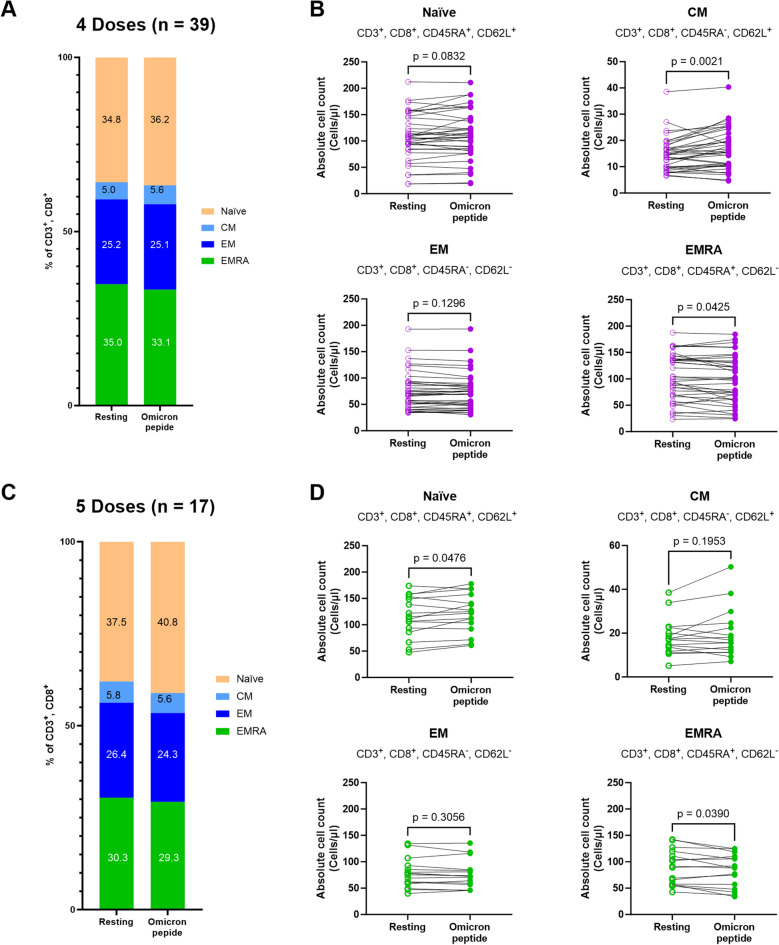
Several vaccine programs were introduced during the COVID-19 pandemic, which included inactivated virus, DNA viral vectors and mRNA vaccines. Booster programs are recommended, especially for those in high-risk groups. However, many of these booster programs involve heterologous vaccines. This study enrolled volunteers who first received two full-dose CoronaVac vaccinations before receiving heterologous boosters with DNA- and/or mRNA-vaccines for an additional 2 doses (n = 40) or an additional 3 doses (n = 16). Our results showed no difference in side effects, neutralizing antibodies, or T-cell responses for any of the heterologous vaccination programs. However, the neutralizing capacity and IFN-γ responses against the Omicron variant in volunteers who received 4 or 5 doses were improved. Polarization of peripheral memory T cells after stimulation in all booster groups with Omicron peptide showed an increased trend of naïve and central memory phenotypes of both CD4+ and CD8+ T cells, suggesting that exposure to Omicron antigens will drive T cells into a lymphoid resident T cell phenotype. Our data support a continuous vaccination program to maximize the effectiveness of immunity, especially in people at high risk. Furthermore, the number of boosting doses is important for maintaining immunity.


Conflict of interest statement

The authors declare no competing interests.

Figures

Figure 1
Figure 1
Comparison of plasma inhibitory efficacy against B1.1.529 (Omicron) and Wuhan Hu-1 following different vaccination strategies. Serum samples of participants with 4 doses (n = 40) or 5 doses (n = 16) were collected to evaluate % inhibition against B1.1.529 (Omicron) and Wuhan Hu-1 SARS-CoV-2. (A) Shows a flow of participants through the study. In (B–D) data represent individual participant measurements (open purple circle for 4 doses, open green circle for 5 doses) with the horizontal lines showing median and 95% confidence interval (95% CI) and dash line represents a positive cut-off. (B) Shows differences in % inhibition of different viral strains and different vaccinations regimens with responses against Omicron (open purple circle, open green circle) and against Wuhan Hu-1 (open purple triangle, open green triangle). (C,D) Show % inhibition of B1.1.529 (Omicron) with different vaccination strategies after 4 doses or 5 doses, respectively. Data were analysed using Kruskal–Wallis test with Dunn’s multiple comparisons test. Statistical significance was determined at a p-value < 0.05.
Figure 2
Figure 2
Specific T cell responses measured as IFN-γ release upon in vitro stimulation with SARS-CoV2 receptor-binding domain (RBD) or S1S2 peptides after four or five doses of vaccination. Peripheral blood mononuclear cells (PBMCs) from participants after 4 doses or 5 doses were stimulated with RBD or S1S2 peptides. IFN-γ release was quantified using QuantiFERON. Data are shown as individual dot plots after medium (control) subtracted IFN-γ levels (open purple circle for 4 doses, open green circle for 5 doses) with horizontal lines showing median and interquartile ranges. IFN-γ levels release by samples after 4 doses and 5 doses in response to RBD (A) or S1S2 peptides (B) were compared using Mann Whitney test. Levels of IFN-γ release by samples after different vaccine combinations of 4 doses (C) or 5 doses (D) were analysed using Kruskal–Wallis test with Dunn’s multiple comparisons test. Statistical significance was determined at a p-value < 0.05.
Figure 3
Figure 3
CD4+ T helper lymphocyte subset changes upon stimulation of PBMC from participants with B.1.1.529 (Omicron) peptide after 4 or 5 doses of heterologous vaccination. PBMCs from participants were cultured with medium control (Resting) or Omicron peptide prior to surface marker staining and flow cytometry analysis for CD4+ T helper lymphocytes. Average percentages of T helper lymphocytes with naïve, central memory (CM), effector memory (EM), and effector memory RA (EMRA) phenotypes from participants receiving 4 doses (A) or 5 doses (C) are shown. Absolute cell numbers of each phenotype were calculated and individually plotted, with lines connecting the same participant before and after stimulation (purple open circle; cell count in Resting samples from the 4th dose group, purple filled circle; cell count after stimulation of samples from the 4th dose group) (B). The same analysis was performed on samples from the 5th dose group (green open circle; cell count in Resting, green filled circle; cell count after stimulation of samples from the 5th dose group) (D). Statistically-significant changes in the paired samples were calculated with a paired t test, with significance determined at a p-value < 0.05.
Figure 4
Figure 4
CD8+ cytotoxic T lymphocyte subset changes upon stimulation of PBMC from participants with B.1.1.529 (Omicron) peptide after 4 or 5 doses of heterologous vaccination. PBMCs from participants were cultured with medium control (Resting) or Omicron peptide prior to surface marker staining and flow cytometry analysis for CD8+ T cytotoxic lymphocytes. Average percentages of cytotoxic T lymphocytes with naïve, central memory (CM), effector memory (EM), and effector memory RA (EMRA) phenotypes from participants receiving 4 doses (A) or 5 doses (C) are shown. Absolute cell numbers of each phenotype were calculated and individually plotted, with lines connecting the same participant before and after stimulation (purple open circle; cell count in Resting samples from the 4th dose group, purple filled circle; cell count after stimulation of samples from the 4th dose group) (B). The same analysis was performed on samples from the 5th dose group (green open circle; cell count in Resting, green open circle; cell count after stimulation of samples from the 5th dose group) (D). Statistically-significant changes in the paired samples were calculated with a paired t test, with significance determined at a p-value < 0.05.

Similar articles

Cited by

References

    1. Fathizadeh H, et al. SARS-CoV-2 (Covid-19) vaccines structure, mechanisms and effectiveness: A review. Int. J. Biol. Macromol. 2021;188:740–750. doi: 10.1016/j.ijbiomac.2021.08.076. - DOI - PMC - PubMed
    1. Andrews N, et al. Covid-19 vaccine effectiveness against the omicron (B.1.1.529) variant. N. Engl. J. Med. 2022;386:1532. doi: 10.1056/NEJMoa2119451. - DOI - PMC - PubMed
    1. Notarte KI, et al. Impact of COVID-19 vaccination on the risk of developing long-COVID and on existing long-COVID symptoms: A systematic review. EClinicalMedicine. 2022;53:101624. doi: 10.1016/j.eclinm.2022.101624. - DOI - PMC - PubMed
    1. Piechotta V, Harder T. Waning of COVID-19 vaccine effectiveness: Individual and public health risk. Lancet. 2022;399:887–889. doi: 10.1016/S0140-6736(22)00282-3. - DOI - PMC - PubMed
    1. Wu N, et al. Long-term effectiveness of COVID-19 vaccines against infections, hospitalisations, and mortality in adults: Findings from a rapid living systematic evidence synthesis and meta-analysis up to December, 2022. Lancet Respir. Med. 2023;11:439–452. doi: 10.1016/S2213-2600(23)00015-2. - DOI - PMC - PubMed

Publication types

Supplementary concepts