. 2023 Oct 31;7(1):111.
doi: 10.1038/s41698-023-00463-z.

The drug efficacy testing in 3D cultures platform identifies effective drugs for ovarian cancer patients

Affiliations

The drug efficacy testing in 3D cultures platform identifies effective drugs for ovarian cancer patients

Emma Åkerlund et al. NPJ Precis Oncol. .

Abstract

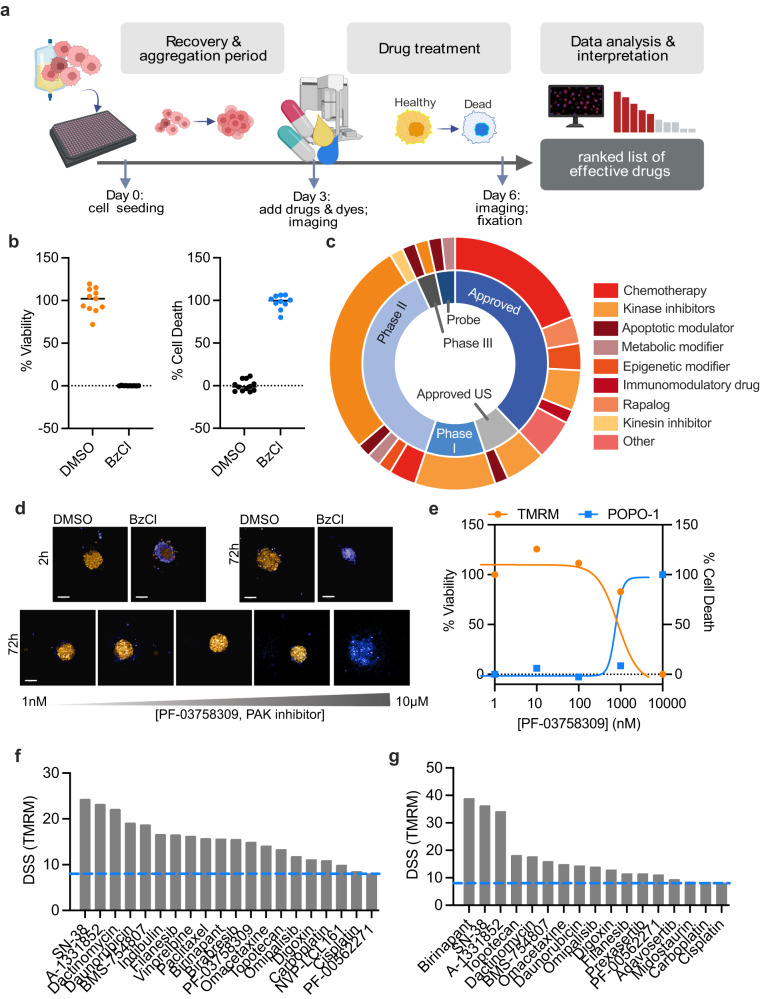
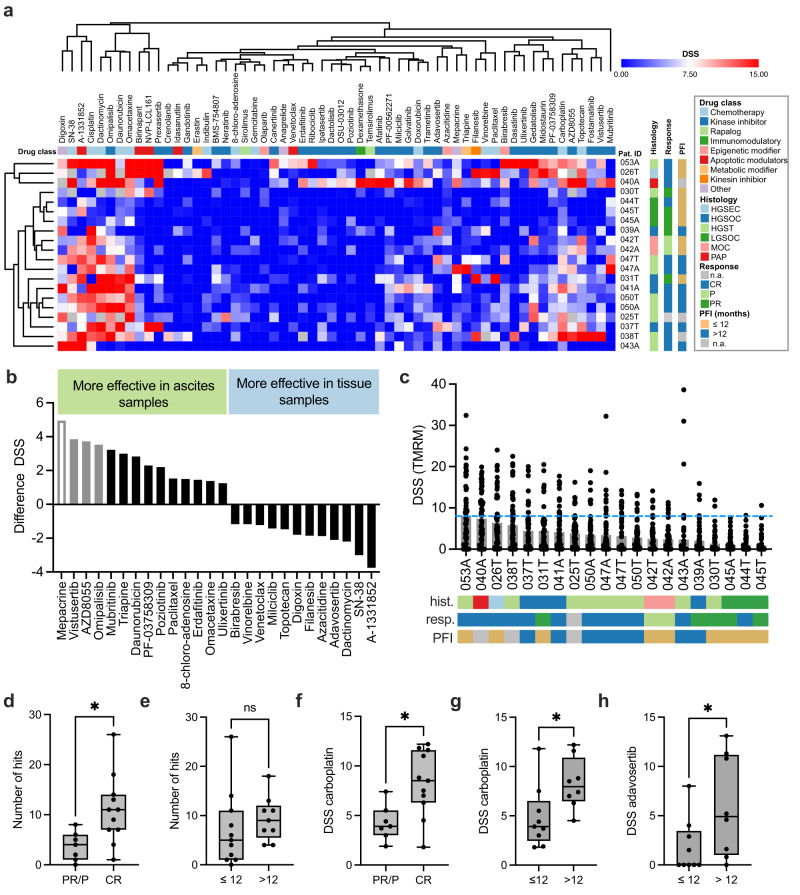
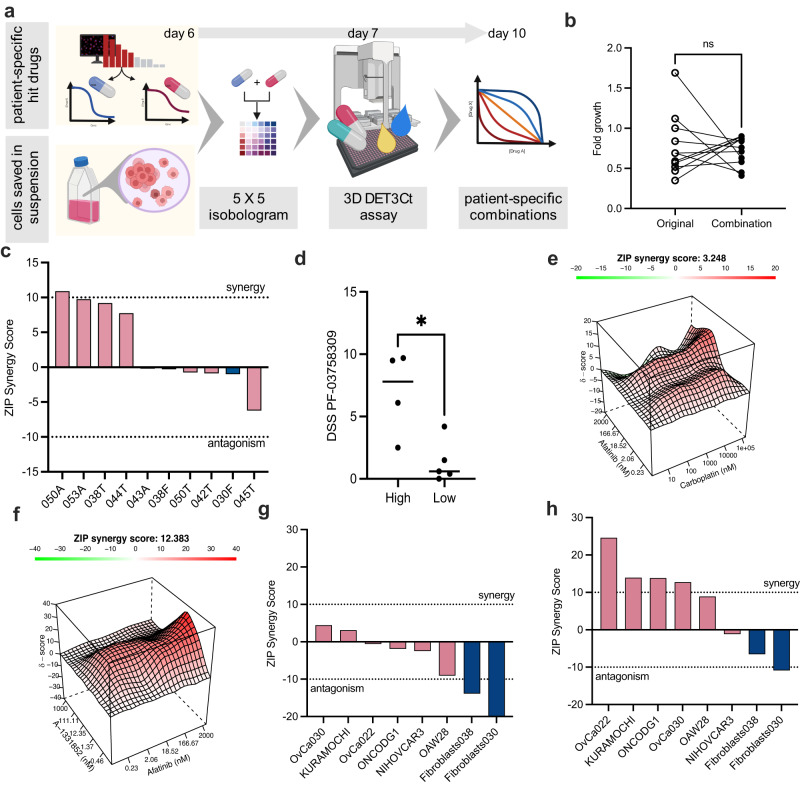
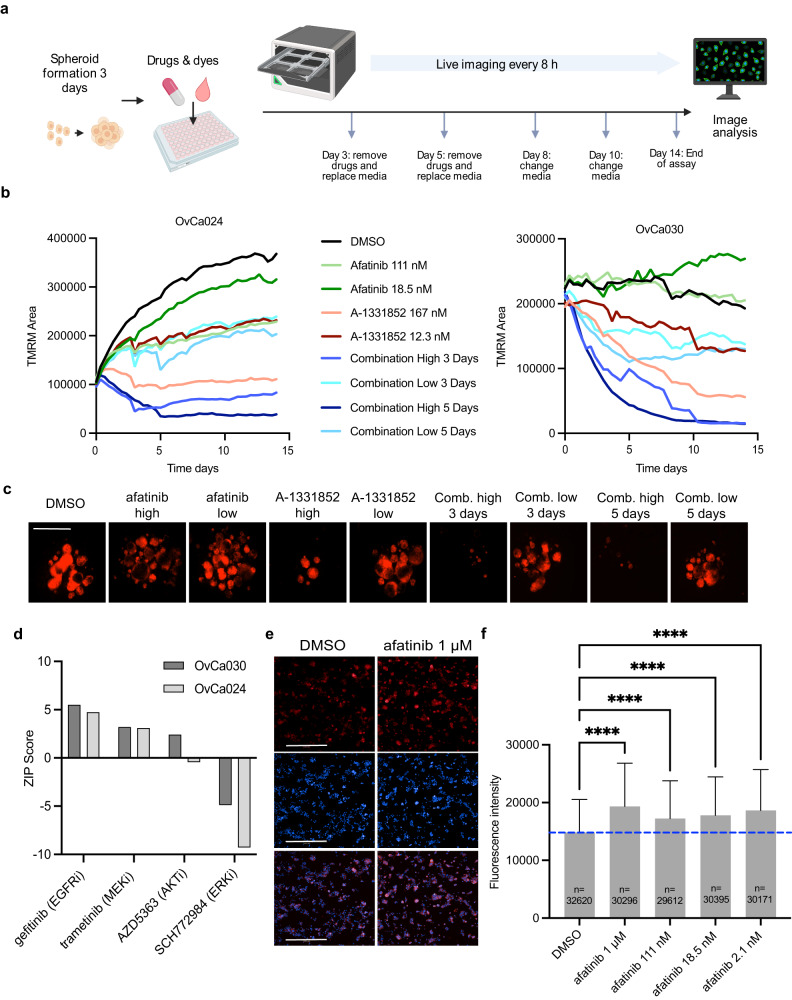
Most patients with advanced ovarian cancer (OC) relapse and progress despite systemic therapy, pointing to the need for improved and tailored therapy options. Functional precision medicine can help to identify effective therapies for individual patients in a clinically relevant timeframe. Here, we present a scalable functional precision medicine platform: DET3Ct (Drug Efficacy Testing in 3D Cultures), where the response of patient cells to drugs and drug combinations are quantified with live-cell imaging. We demonstrate the delivery of individual drug sensitivity profiles in 20 samples from 16 patients with ovarian cancer in both 2D and 3D culture formats, achieving over 90% success rate in providing results six days after operation. In this cohort all patients received carboplatin. The carboplatin sensitivity scores were significantly different for patients with a progression free interval (PFI) less than or equal to 12 months and those with more than 12 months (p < 0.05). We find that the 3D culture format better retains proliferation and characteristics of the in vivo setting. Using the DET3Ct platform we evaluate 27 tailored combinations with results available 10 days after operation. Notably, carboplatin and A-1331852 (Bcl-xL inhibitor) showed an additive effect in four of eight OC samples tested, while afatinib and A-1331852 led to synergy in five of seven OC models. In conclusion, our 3D DET3Ct platform can rapidly define potential, clinically relevant data on efficacy of existing drugs in OC for precision medicine purposes, as well as provide insights on emerging drugs and drug combinations that warrant testing in clinical trials.


Conflict of interest statement

O.K. is a co-founder and a board member of Medisapiens and Sartar Therapeutics and has received royalty on patents licensed by Vysis-Abbot. The remaining authors declare no competing interests.

Figures

Fig. 1
Fig. 1. Optimization of the DET3Ct platform for the identification of effective drugs in PDCs.
a Schematic overview of the assay design and objectives (figure created with BioRender.com). b Plots displaying the normalized measurements for OvCa027 for negative (DMSO, n = 11) and positive (BzCl, n = 10) controls. Lines at median. Live cells are denoted by high TMRM (yellow) and dead cells by high POPO-1 (blue). c An overview of the phase and compound class of the 58 drugs in the OC drug repurposing library. d Example of maximum projection images after drug exposure to PF-03758309 for 72 h in a five-point concentration range, as well as the corresponding controls at time 2 h and 72 h. The white scale bar represents 100 μm. Blue is POPO-1 iodide and orange is TMRM. e Corresponding concentration-response curves of the data in (d). The DSS score for TMRM is 5.4 and 2.7 for POPO-1. f Waterfall plot of the DSS calculated using the TMRM parameter for effective drugs (DSS > 8) in the OvCa024 PDCs after 72 h treatment with the OC repurposing library. g Waterfall plot of the DSS calculated using the TMRM parameter for effective drugs (DSS > 8) in the OvCa027 PDCs after 72 h treatment with the OC repurposing library.
Fig. 2
Fig. 2. The DET3Ct platform reports patient-specific drug response in 6 days.
a An overview of the drug response landscape presented in a heatmap showing the DSS scores from the TMRM parameter. Patient samples are listed on the x-axis where A stands for sample coming from ascites and T for tissue. Drugs are shown on the y-axis. Clustering was performed in Morpheus using Euclidean distance and complete linkage. The key in the figure delineates drug class, patient disease histology, clinical response as measured by RECIST, and PFI in months. b Differences in DSS between the four paired ascites and tissue samples. Grey bars indicate compounds known to act through the PI3k/mTOR pathways. Grey bars with no fill represents compounds likely acting through PI3K/mTOR pathways. c Barplot showing the median DSS score for each patient. Each dot represents one drug from the OC Repurposing library. The dotted blue line denotes DSS 8, the cut-off defining drug sensitivity. The keys to the patient information are found in panel (a). d Boxplot of the number of effective drugs for patient classes according to RECIST guidelines, PR/P (n = 5) and CR (n = 11). Two-tailed Mann–Whitney U test p = 0.0107. e Boxplot of the number of effective drugs for patients with PFI ≤ 12 months (n = 7) and PFI > 12 months (n = 7). Two-tailed Mann–Whitney U test p = 0.1931. f Boxplot of the carboplatin DSS for patients with PR/P (n = 5) and CR (n = 11) RECIST classes. Two-tailed Mann–Whitney U test p = 0.0114. g Boxplot of the carboplatin DSS for patients with PFI ≤ 12 months (n = 7) and PFI > 12 months (n = 7). Two-tailed Mann–Whitney U test p = 0.0206. h Bar plot of the adavosertib DSS for patients with PFI ≤ 12 months (n = 7) and PFI > 12 months (n = 7). Two-tailed Mann–Whitney U test p = 0.0453. Boxplots show minimum, maximum and all points.
Fig. 3
Fig. 3. Comparison of the DECT3Ct platform results in 2D and 3D formats.
a Example images from the patient sample OvCa037 displayed in 3D live cell assay (top panel, maximum projection), 2D live cell assay (middle panel) and 2D IF assay (bottom panel) after drug exposure to dactinomycin in a five-point concentration range. For top and middle panels TMRM is displayed in yellow, POPO-1 in blue. For the lower panel red is CK8/18 and blue is Hoechst. The scale bar for the 3D live-cell images represents 100 µm and for the 2D images is 200 µm. b Growth in the 2D and 3D culture conditions measured by fold change in area (2D) or volume (3D) for DMSO controls at t = 2 h and t = 72 h. Two-tailed paired t test, p = 0.0033. c Mean difference in drug response between 2D and 3D culture formats for the 11 paired samples. Only drugs with a DSS difference <-1 or >1 are shown. d Ratio of cancer area/total area in the DMSO wells for the 2D IF assay. Cancer area is determined using CK8/18 positive area (epithelial cells) and total area is determined using CellMask positive area. Error bars represent S.E.M of twelve replicates.
Fig. 4
Fig. 4. Patient specific combination screening reveals a synergistic interaction.
a An overview of the combination testing strategy. Figure created in BioRender.com. b Comparison of the fold growth (TMRM volume) during the initial screen (days 3–6) and the following combination screen (days 7–10). c ZIP synergy scores of the combination A-1331852+carboplatin from the patient-specific combination screens using the 3D DET3Ct method for the 6 patient samples (pink, A or T) and 2 patient-derived fibroblast lines (blue, F). d DSS scores of PF-03758309 for the samples in c (4 with ZIP synergy scores >7 and 5 with ZIP synergy scores <0). Two-tailed Mann–Whitney U test p = 0.0317. e Interaction surface for the combination matrix of afatinib (five concentrations) 0.2–2000 nM and carboplatin (five concentrations) 10–100000 nM. f Interaction surface for the combination matrix of afatinib (five concentrations) 0.2–2000 nM and A-1331852 (five concentrations) 0.5–1000 nM. g ZIP synergy scores of the combination afatinib and carboplatin using the 3D DET3Ct method for 6 OC cancer models (pink) and two PDF models (blue). h ZIP synergy scores of the combination afatinib and A-1331852 using the 3D DET3Ct method for 6 OC cancer models (pink) and 2 PDF models (blue).
Fig. 5
Fig. 5. Combination of A-1331852 and afatinib has promising effects in long-term, washout model.
a A schematic overview of the assay. b TMRM area in OvCa024 and OvCa030 plotted over 14 days, where the drugs afatinib and A-1331852 were used in combination and as single agents. A-1331852 (Low: 12.3 nM and High: 167 nM) and afatinib (Low: 18.5 nM and High: 111 nM). Imaging was performed every 8 h. Mean value at each timepoint is shown for ease of visualization. c Representative images of OvCa030 from different treatments at day 14 (red-orange is TMRM intensity). Scale bar is 400 µm. d Combination of A-1331852 with gefitinib, trametinib, AZD5363, and SCH772964 in OvCa030 and OvCa024 models measured with the 3D DET3Ct assay. e Representative images of BIM expression in DMSO control cells (left) and cells exposed to 1 µM afatinib. BIM expression is depicted in red and Hoechst (nuclei) is blue. Top panel is BIM, middle is Hoechst and bottom is merged. Scale bar is 500 µm. f Quantification of BIM expression after afatinib treatment at the concentrations 1 μM, 0.111 nM, 18.5 nM and 2.1 nM compared to DMSO control measured with high content microscopy. One-way ANOVA, p < 0.0001 for all conditions as compared to DMSO (ctrl), number of cells evaluated is shown for each condition. Barplots show median and interquartile range.

References

    1. Letai A. Functional precision cancer medicine-moving beyond pure genomics. Nat. Med. 2017;23:1028–1035. doi: 10.1038/nm.4389. - DOI - PubMed
    1. Napoli GC, Figg WD, Chau CH. Functional drug screening in the era of precision medicine. Front. Med. (Lausanne) 2022;9:912641. doi: 10.3389/fmed.2022.912641. - DOI - PMC - PubMed
    1. Malani D, et al. Implementing a functional precision medicine tumor board for acute myeloid leukemia. Cancer Discov. 2022;12:388–401. doi: 10.1158/2159-8290.CD-21-0410. - DOI - PMC - PubMed
    1. Kornauth C, et al. Functional precision medicine provides clinical benefit in advanced aggressive hematologic cancers and identifies exceptional responders. Cancer Discov. 2022;12:372–387. doi: 10.1158/2159-8290.CD-21-0538. - DOI - PMC - PubMed
    1. Irmisch A, et al. The Tumor Profiler Study: integrated, multi-omic, functional tumor profiling for clinical decision support. Cancer Cell. 2021;39:288–293. doi: 10.1016/j.ccell.2021.01.004. - DOI - PubMed

LinkOut - more resources