Review
. 2023 Dec;23(12):863-878.
doi: 10.1038/s41568-023-00632-z. Epub 2023 Oct 31.

Metabolic pathway analysis using stable isotopes in patients with cancer

Affiliations
Review

Metabolic pathway analysis using stable isotopes in patients with cancer

Caroline R Bartman et al. Nat Rev Cancer. 2023 Dec.

Abstract

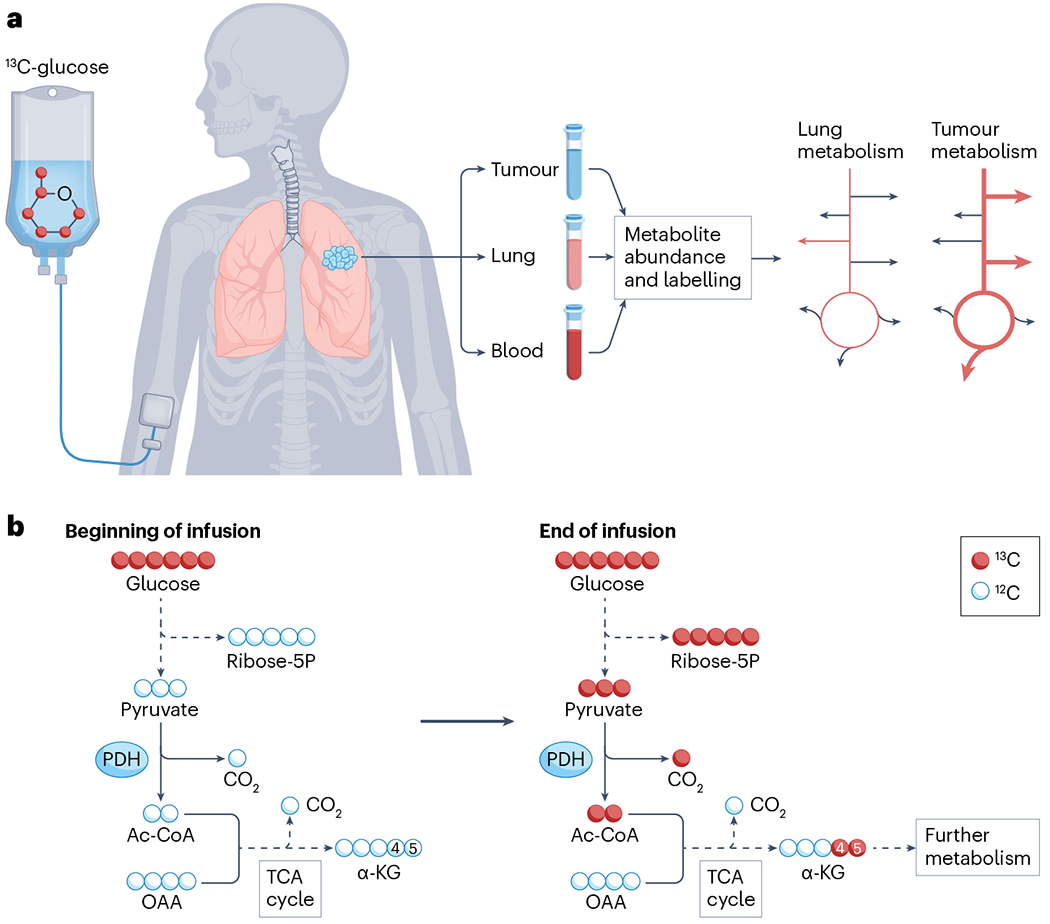
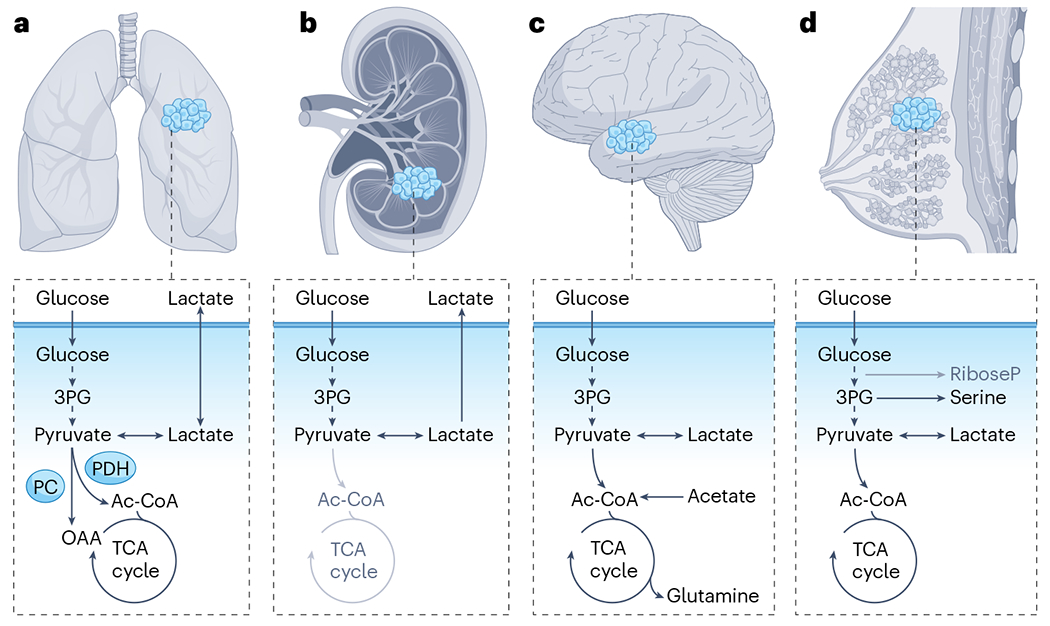
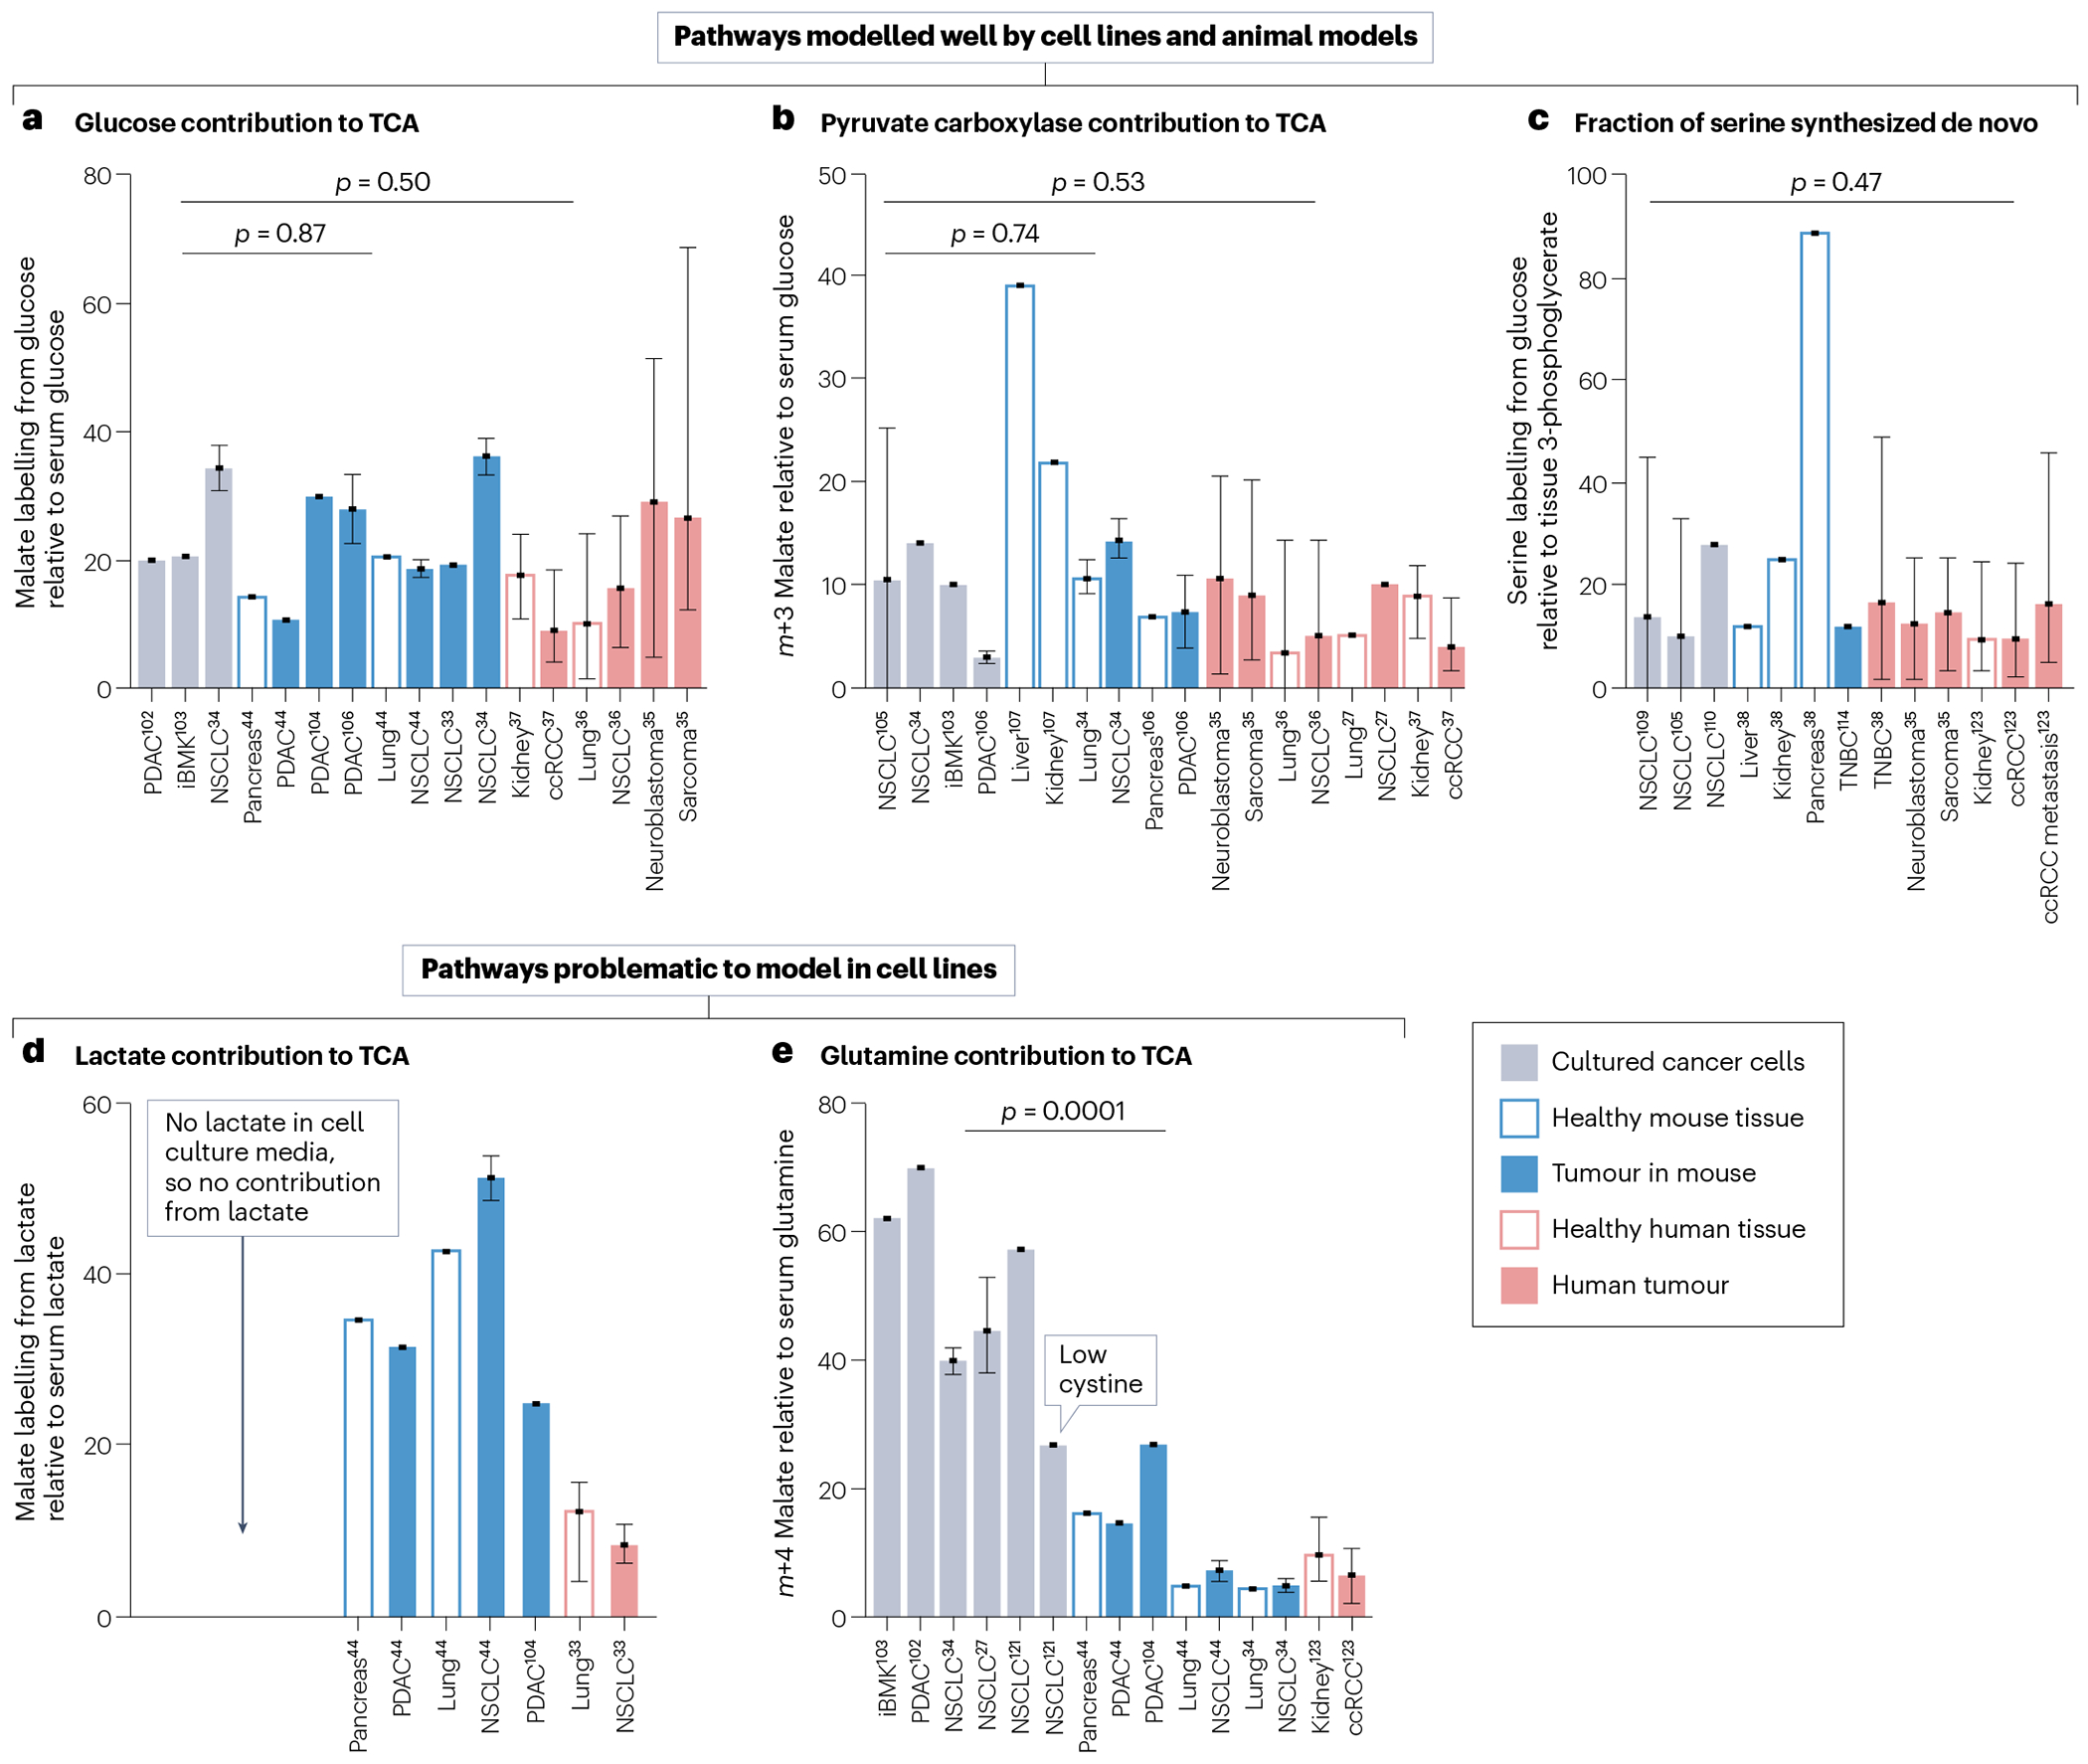
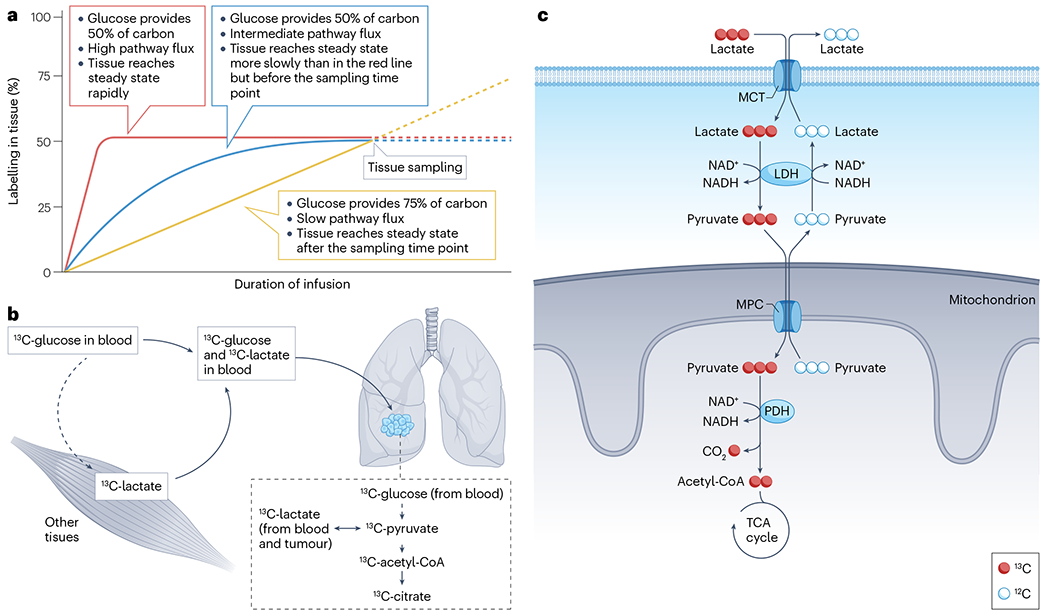
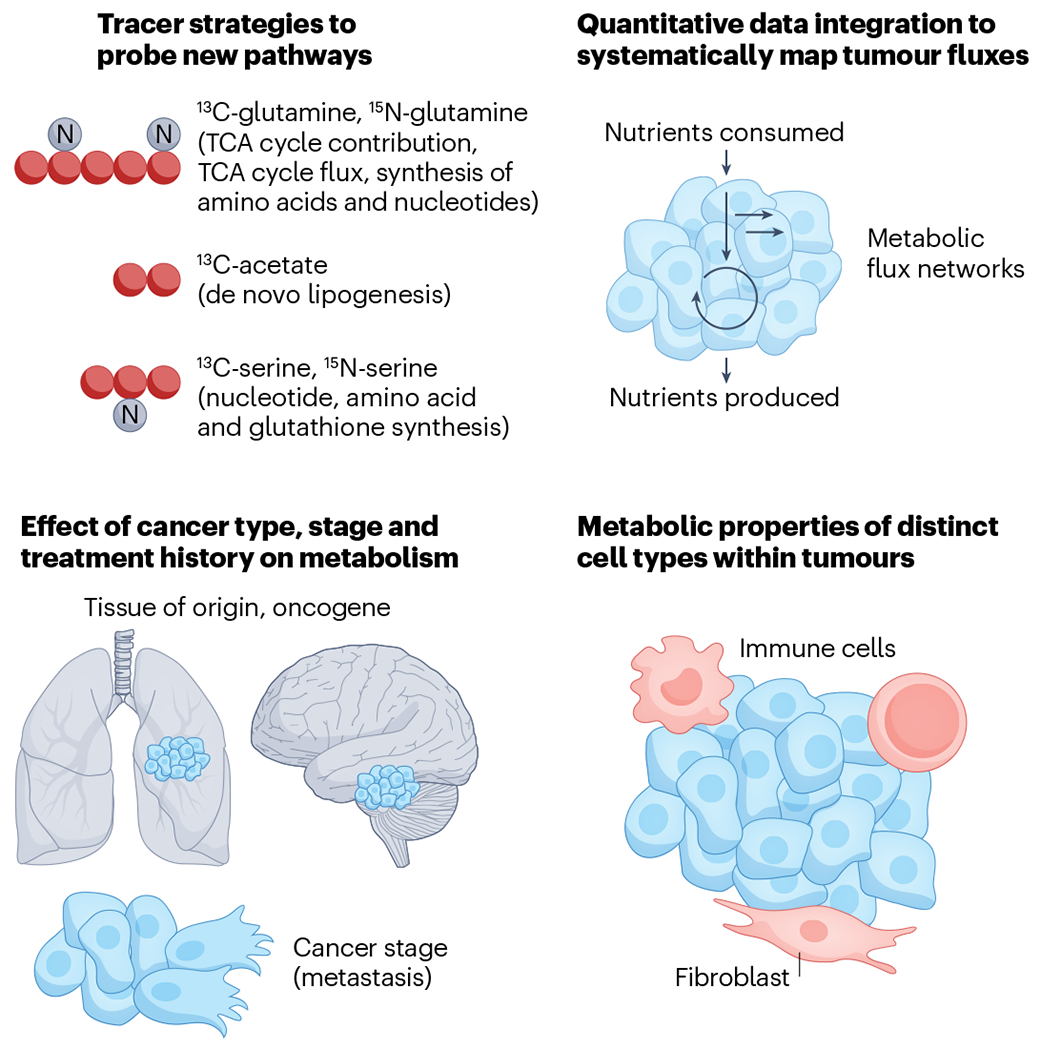
Metabolic reprogramming is central to malignant transformation and cancer cell growth. How tumours use nutrients and the relative rates of reprogrammed pathways are areas of intense investigation. Tumour metabolism is determined by a complex and incompletely defined combination of factors intrinsic and extrinsic to cancer cells. This complexity increases the value of assessing cancer metabolism in disease-relevant microenvironments, including in patients with cancer. Stable-isotope tracing is an informative, versatile method for probing tumour metabolism in vivo. It has been used extensively in preclinical models of cancer and, with increasing frequency, in patients with cancer. In this Review, we describe approaches for using in vivo isotope tracing to define fuel preferences and pathway engagement in tumours, along with some of the principles that have emerged from this work. Stable-isotope infusions reported so far have revealed that in humans, tumours use a diverse set of nutrients to supply central metabolic pathways, including the tricarboxylic acid cycle and amino acid synthesis. Emerging data suggest that some activities detected by stable-isotope tracing correlate with poor clinical outcomes and may drive cancer progression. We also discuss current challenges in isotope tracing, including comparisons of in vivo and in vitro models, and opportunities for future discovery in tumour metabolism.


Conflict of interest statement

Competing interests

R.J.D. is a founder and adviser for Atavistik Bioscience and an adviser for Agios Pharmaceuticals, Vida Ventures and Droia Ventures. The other authors declare no competing interests.

Figures

Fig. 1 |
Fig. 1 |. Basic concepts of isotope labelling.
a, Workflow of stable-isotope tracing experiments in patients with cancer, using lung cancer as an example. The labelled tracer, in this case uniformly labelled [U-13C]glucose, is provided by feeding or, as shown here, by intravenous infusion. The tracer is then metabolized along with the endogenous unlabelled nutrient, spreading heavy atoms into downstream metabolites in a stereotyped way depending on the reactions that take place. Blood is sampled during the infusion, and the tumour and adjacent lung tissue are sampled immediately at resection. The duration of the infusion is variable, but most applications in human cancer have used infusions of at least 2 h. Metabolites are extracted and analysed for abundance and 13C labelling by mass spectrometry or NMR. Although mass spectrometry detects differences in atomic mass resulting from the presence of isotope labels, NMR detects the nuclear spin of certain isotopes. Labelling reports information about relative pathway utilization between the tumour mass and non-malignant lung tissue. The pathway illustration at the right indicates enhanced 13C labelling (heavier red arrows) in glycolysis, the tricarboxylic acid (TCA) cycle and other pathways supplied by glucose. b, Isotope labelling detail. At the beginning of the infusion, all metabolites other than the glucose tracer are unlabelled. Over time, metabolites in glycolysis, the pentose phosphate pathway and the TCA cycle become labelled in positions that depend on the labelling state of the precursor, in this case, [U-13C]glucose, and the pathways used in the tissue. For example, if pyruvate dehydrogenase (PDH) is active, pyruvate is converted to acetyl-CoA (Ac-CoA) and subsequently α-ketoglutarate (α-KG) is labelled in positions 4 and 5 on the first turn of the TCA cycle, and the label is distributed to other positions through further metabolism. If pyruvate carboxylase is also active, the oxaloacetate (OAA) pool becomes labelled and results in 13C at positions 1, 2 and 3 of α-KG on the first turn of the TCA cycle (not shown). Further metabolism in the TCA cycle leads to more complex labelling patterns downstream of both PDH and pyruvate carboxylase.
Fig. 2 |
Fig. 2 |. Metabolic rewiring in different kinds of human cancer.
Stable-isotope tracing with 13C-labelled nutrients has been performed in patients with several types of cancer. The pathways illustrated in dark text reflect labelling features observed through stable-isotope tracing in tumours. Those in grey text appear to be suppressed in tumours relative to adjacent, non-malignant tissue. a, In non-small-cell lung cancer, both [13C]glucose and [13C]lactate are oxidized in the tricarboxylic acid (TCA) cycle. Labelled pyruvate that is derived from either tracer enters the TCA cycle through pyruvate dehydrogenase (PDH) and pyruvate carboxylase (PC). b, Clear cell renal cell carcinomas display a Warburg-like metabolic phenotype, with prominent contributions of circulating glucose to glycolytic intermediates but suppressed contribution to the TCA cycle. c, In the brain, both glioblastoma and brain metastases oxidize [13C]glucose within the TCA cycle, can use [13C]acetate as a TCA cycle fuel and synthesize glutamine from either substrate. d, In triple-negative breast cancer, [13C]glucose-derived carbons fuel multiple pathways, including the TCA cycle, serine biosynthesis and lactate, indicating local production of these intermediates within the tumour. Ac-CoA, acetyl-CoA; OAA, oxaloacetate; 3PG, 3-phosphoglycerate.
Fig. 3 |
Fig. 3 |. Shared and divergent metabolic properties in cultured cells, mice and patients.
Comparison of data from published studies is shown. In all graphs, bars represent means of different cell lines, tumour models or individual patients, and error bars represent highest and lowest values in the study. P-values are from two-tailed t-tests comparing cell lines with mouse tumours or cell lines with patient samples. Neither of these comparisons includes healthy tissues. The sources of data in this figure are summarized in Supplementary Table 1. a, Contribution of glucose to the tricarboxylic acid (TCA) cycle, calculated as the fraction of carbons in malate labelled from [U-13C]glucose. For mouse and patient tissues and tumours, this is normalized to the fraction of carbons labelled in serum glucose. p = 0.87, cell lines versus mouse tumours and p = 0.50, cell lines versus human patient tumours. b, Pyruvate carboxylase contribution to the TCA cycle, calculated as the fraction of m + 3 malate from [U-13C]glucose. For mouse and patient tissues and tumours, this is normalized to the fraction of carbons labelled in serum glucose. p = 0.74, mouse tumours compared with cell lines; p = 0.53, human tumours compared with cell lines. c, Fraction of serine synthesized from [13C]glucose. For mouse and patient tissues and tumours, this is normalized to the fraction of carbons labelled in tissue 3-phosphoglycerate. p = 0.47 comparing cell lines with human patient tumours. d, Contribution of lactate to the TCA cycle, calculated as the fraction of carbons in malate labelled from [U-13C]lactate, normalized to the fraction of carbons labelled in serum lactate. e, Contribution of glutamine to the TCA cycle, calculated as the fraction of carbons in malate labelled from [U-13C]glutamine. For mouse and patient tissues and tumours, this is normalized to the fraction of carbons labelled in serum glutamine. p = 0.001, comparing cell lines with mouse tumours, excluding the cell line grown with low cystine. ccRCC, clear cell renal cell carcinoma; iBMK, immortalized baby mouse kidney epithelial cell line; NSCLC, non-small-cell lung cancer; PDAC, pancreatic adenocarcinoma; TNBC, triple-negative breast cancer.
Fig. 4 |
Fig. 4 |. Limitations of stable-isotope tracing studies in patients with cancer.
a, It is not possible to determine absolute metabolic flux (that is, absolute rates of pathways) from steady-state isotope labelling alone. In an isotope tracing experiment using [13C]glucose as the tracer, metabolite labelling depends on several factors, including the speed of turnover and the relative contribution of glucose to the pool. As shown in the graph, similar labelling at the time of sampling can occur even when the metabolic properties of the tissue differ. b, Secondary tracers, that is, labelled metabolites in the circulation arising from metabolism of the initial tracer, must be considered when analysing metabolite labelling in the tumour. In this example, [13C]glucose is introduced into the blood and is the initial source of all 13C labelling that ensues. However, as [13C]glucose circulates, it is taken up by the tissues such as muscles and converted to other metabolites, particularly [13C]lactate, which may then be released into the blood. Over time, circulating lactate becomes appreciably labelled, allowing 13C to enter tumour cells as either [13C]glucose or [13C]lactate. Therefore, 13C labelling within tumour cells may arise either from glycolysis using [13C]glucose as a substrate or from uptake of blood-borne [13C]lactate. c, Exchange fluxes contribute to 13C labelling patterns. In the illustration, circulating [13C]lactate is taken up by tumour cells and contributes to labelling of pyruvate, acetyl-CoA and tricarboxylic acid (TCA) cycle intermediates (red pathway). However, several steps of this pathway are rapid and bidirectional. These include lactate transport by monocarboxylate transporters (MCTs) on the plasma membrane, interconversion of lactate and pyruvate by lactate dehydrogenase (LDH) and pyruvate transport into the mitochondrial matrix by the mitochondrial pyruvate carrier (MPC). Metabolite labelling therefore does not mean that tumour cells have a net consumption of lactate, because lactate efflux and other exchange reactions may equal or exceed lactate uptake and metabolism. Note that PDH is irreversible, so labelling of acetyl-CoA and TCA cycle intermediates implies bona fide flux through the PDH reaction.
Fig. 5 |
Fig. 5 |. Future directions of research in cancer metabolism in vivo.
Upper left, using additional stable-isotope tracers such as [13C]glutamine, [15N]glutamine, [13C]acetate, [13C]serine and [15N]serine to probe cancer metabolism would reveal new information about tumour nutrient preferences. Performing glucose or glutamine infusions and sampling early timepoints could reveal tricarboxylic acid (TCA) cycle flux. Upper right, applying quantitative frameworks such as metabolic flux analysis to integrate multiple data types could help determine metabolic fluxes in tumours. Metabolic flux analysis is a quantitative framework that integrates metabolic data, such as nutrient production and consumption measured by sampling tumour draining veins and nutrient contributions measured by tracer infusion, using a mass balance constraint to infer other unmeasured fluxes. Lower left, future tracing studies should assess metabolism in more tumour types and at different clinical stages, with an emphasis on determining how stage and treatment status alter metabolic fluxes. For example, it is unknown whether pre-cancerous lesions, primary tumours and metastases differ in their metabolism. Additionally, if chemotherapy alters metabolic fluxes in cancer cells, this could uncover synthetic lethalities that might improve therapeutic responses over the current standard of care. Lower right, measuring the metabolism of specific cell types within tumours, including immune cells and fibroblasts, is an important future direction. This could potentially be achieved by fast sorting of different cell types from tumours or by spatial mass spectrometry analysis of tumour slices.

References

    1. Hanahan D & Weinberg RA Hallmarks of cancer: the next generation. Cell 144, 646–674 (2011). - PubMed
    1. Pavlova NN & Thompson CB The emerging hallmarks of cancer metabolism. Cell Metab. 23, 27–47 (2016). - PMC - PubMed
    1. Davies PSW Stable isotopes: their use and safety in human nutrition studies. Eur. J. Clin. Nutr 74, 362–365 (2020). - PMC - PubMed
    1. Alseekh S et al. Mass spectrometry-based metabolomics: a guide for annotation, quantification and best reporting practices. Nat. Methods 18, 747–756 (2021). - PMC - PubMed
    1. Lu W, Bennett BD & Rabinowitz JD Analytical strategies for LC-MS-based targeted metabolomics. J. Chromatogr. B Anal. Technol. Biomed. Life Sci 871, 236–242 (2008). - PMC - PubMed