. 2023 Oct 31;13(1):18761.
doi: 10.1038/s41598-023-46126-8.

MultiCOVID: a multi modal deep learning approach for COVID-19 diagnosis

Affiliations

MultiCOVID: a multi modal deep learning approach for COVID-19 diagnosis

Max Hardy-Werbin et al. Sci Rep. .

Abstract

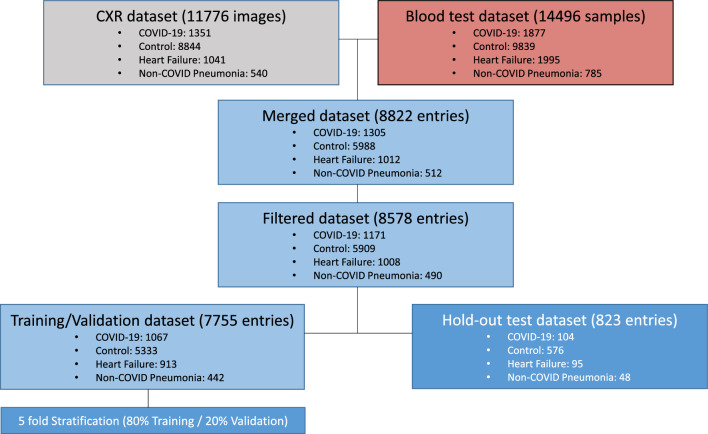
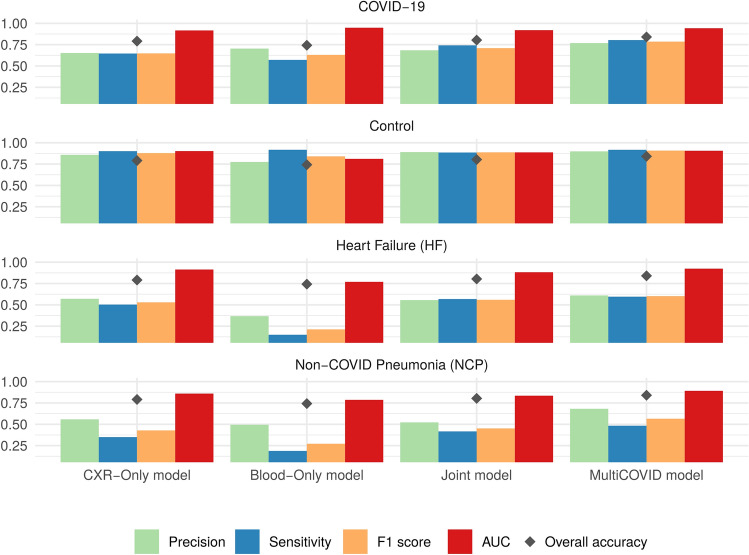
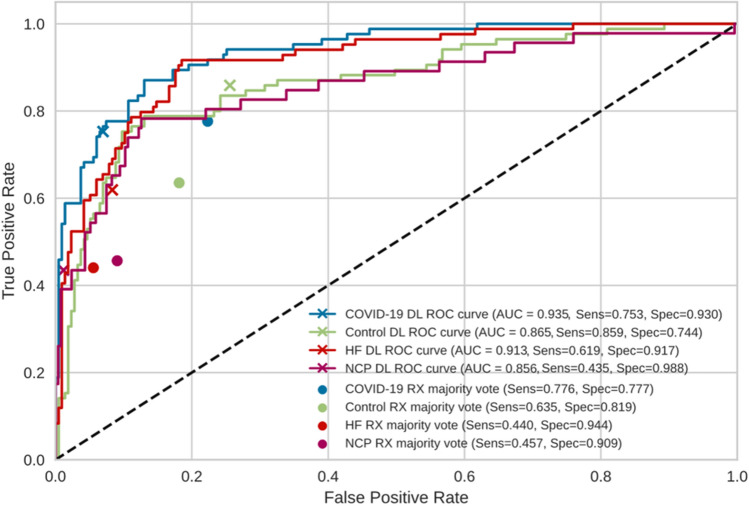
The rapid spread of the severe acute respiratory syndrome coronavirus 2 led to a global overextension of healthcare. Both Chest X-rays (CXR) and blood test have been demonstrated to have predictive value on Coronavirus Disease 2019 (COVID-19) diagnosis on different prevalence scenarios. With the objective of improving and accelerating the diagnosis of COVID-19, a multi modal prediction algorithm (MultiCOVID) based on CXR and blood test was developed, to discriminate between COVID-19, Heart Failure and Non-COVID Pneumonia and healthy (Control) patients. This retrospective single-center study includes CXR and blood test obtained between January 2017 and May 2020. Multi modal prediction models were generated using opensource DL algorithms. Performance of the MultiCOVID algorithm was compared with interpretations from five experienced thoracic radiologists on 300 random test images using the McNemar-Bowker test. A total of 8578 samples from 6123 patients (mean age 66 ± 18 years of standard deviation, 3523 men) were evaluated across datasets. For the entire test set, the overall accuracy of MultiCOVID was 84%, with a mean AUC of 0.92 (0.89-0.94). For 300 random test images, overall accuracy of MultiCOVID was significantly higher (69.6%) compared with individual radiologists (range, 43.7-58.7%) and the consensus of all five radiologists (59.3%, P < .001). Overall, we have developed a multimodal deep learning algorithm, MultiCOVID, that discriminates among COVID-19, heart failure, non-COVID pneumonia and healthy patients using both CXR and blood test with a significantly better performance than experienced thoracic radiologists.


Conflict of interest statement

The authors declare no competing interests.

Figures

Figure 1
Figure 1
Flowchart for sample selection and patient inclusion in the study and breakdown of training, validation, and hold-out test data sets. Around 25,000 entries were obtained using both CXR images and blood test in a time wise manner. The whole dataset totals 8822 entries of paired CXR and blood test data. Samples with low completeness (less than 80% of blood test data available) were discarded for the model building.
Figure 2
Figure 2
Performance of visual models on whole CXR images. (A) Confusion matrix and overall accuracy using whole image, segmented and inverse segmented images, respectively for each category tested. (B) Raw image and Grad-CAM heatmap representation of an image for each category and model trained.
Figure 3
Figure 3
Performance of different models on the entries from hold-out test datasets. Means for precision (green), sensitivity (blue), F1 score (yellow), AUC (red) and accuracy (black diamond) for each model type and category assessed, respectively. CXR-only models use only CXR images for 4 category classification. Blood-only models use blood test a source of information. Joint model uses both CXR and blood test as input for classification and MultiCOVID is the majority vote of 5 different Joint models.
Figure 4
Figure 4
Blood-only model interpretability by SHAP analysis. (A) Summary plot showing the mean absolute SHAP value of the ten most important features for the four classes. (B) Blood test values of the different features identified by SHAP analysis. RDW-CV: red cell distribution width; MCHC: Mean Corpuscular Hemoglobin Concentration; RBC: red blood cells.
Figure 5
Figure 5
Comparison of the performance of MultiCOVID model with consensus expert radiologist interpretations on random sample of 300 images from the test set. The receiver operating characteristic (ROC) curves for each category (COVID-19 – blue; Control – green; Heart Failure (HF) – red and Non-COVID Pneumonia (NCP) – magenta) are shown for MultiCOVID (DL) and for the consensus interpretation of radiologists (majority vote). Sensitivity (Sens) and specificity (Spec) are also plotted for each category assessed. DL: deep learning.

References

    1. DeGrave AJ, Janizek JD, Lee S-I. AI for radiographic COVID-19 detection selects shortcuts over signal. Nat. Mach. Intell. 2021;3:610–619. doi: 10.1038/s42256-021-00338-7. - DOI
    1. Cleverley J, Piper J, Jones MM. The role of chest radiography in confirming covid-19 pneumonia. BMJ. 2020 doi: 10.1136/bmj.m2426. - DOI - PubMed
    1. Avila E, Kahmann A, Alho C, Dorn M. Hemogram data as a tool for decision-making in COVID-19 management: Applications to resource scarcity scenarios. PeerJ. 2020;8:e9482. doi: 10.7717/peerj.9482. - DOI - PMC - PubMed
    1. Razavian N, et al. A validated, real-time prediction model for favorable outcomes in hospitalized COVID-19 patients. npj Digit. Med. 2020;3:130. doi: 10.1038/s41746-020-00343-x. - DOI - PMC - PubMed
    1. Trevethan R. Sensitivity, specificity, and predictive values: Foundations, pliabilities, and pitfalls in research and practice. Front. Public Heal. 2017;5:307. doi: 10.3389/fpubh.2017.00307. - DOI - PMC - PubMed