

Constructing synthetic populations in the age of big data
- PMID: 37907904
- PMCID: PMC10617102
- DOI: 10.1186/s12963-023-00319-5
Constructing synthetic populations in the age of big data
Abstract
Background: To develop public health intervention models using micro-simulations, extensive personal information about inhabitants is needed, such as socio-demographic, economic and health figures. Confidentiality is an essential characteristic of such data, while the data should reflect realistic scenarios. Collection of such data is possible only in secured environments and not directly available for open-source micro-simulation models. The aim of this paper is to illustrate a method of construction of synthetic data by predicting individual features through models based on confidential data on health and socio-economic determinants of the entire Dutch population.
Methods: Administrative records and health registry data were linked to socio-economic characteristics and self-reported lifestyle factors. For the entire Dutch population (n = 16,778,708), all socio-demographic information except lifestyle factors was available. Lifestyle factors were available from the 2012 Dutch Health Monitor (n = 370,835). Regression model was used to sequentially predict individual features.
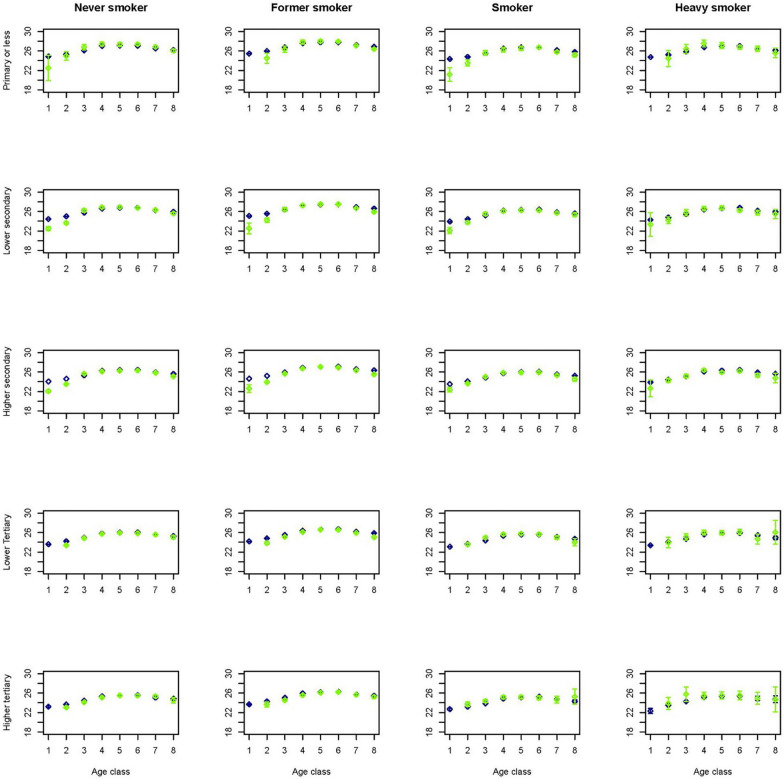
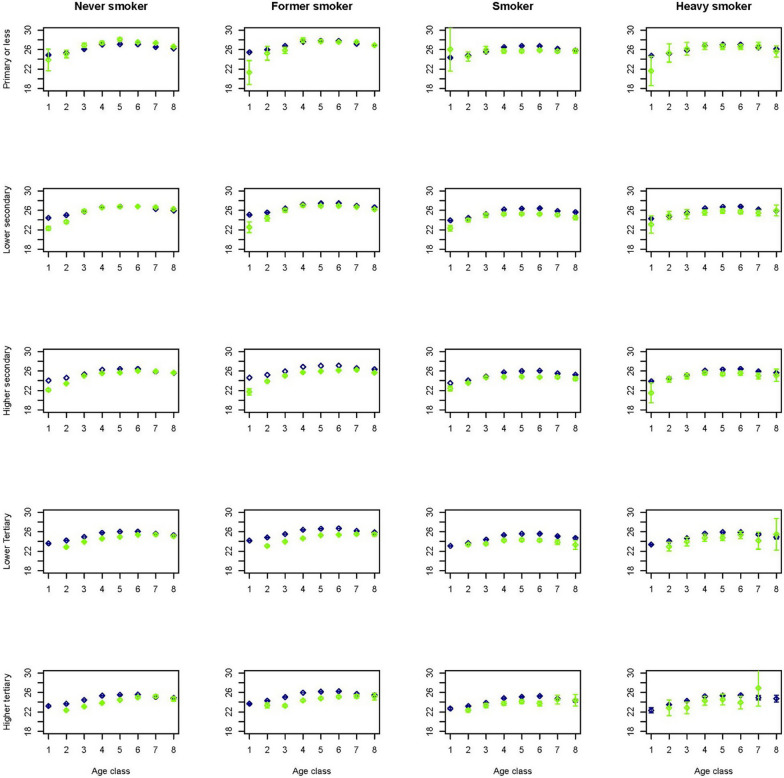
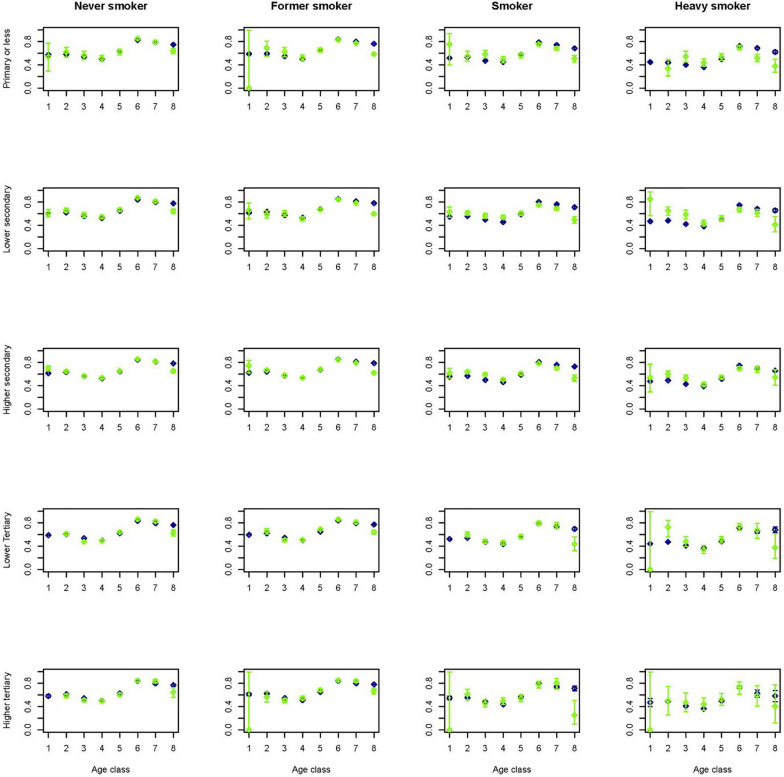
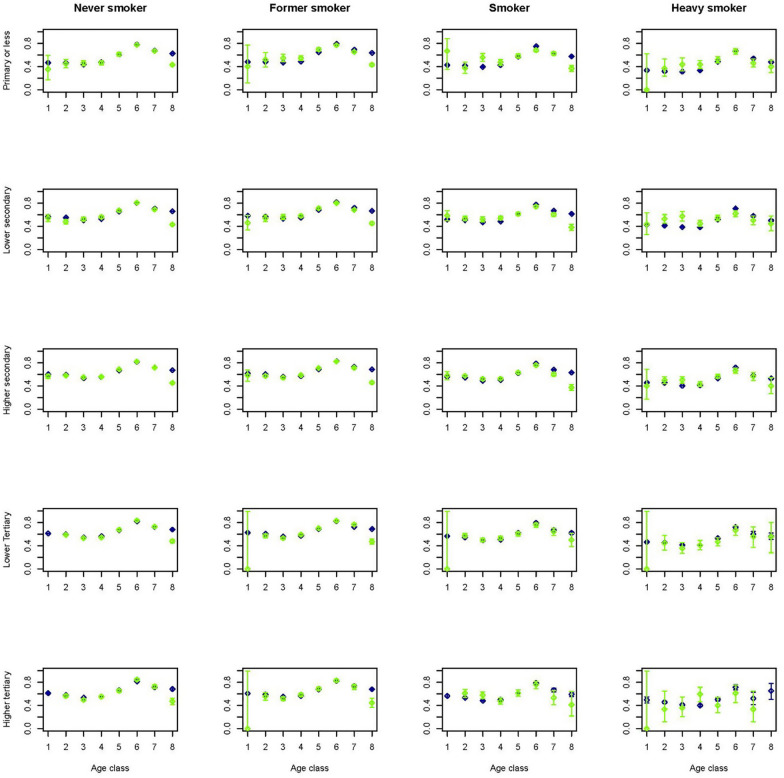
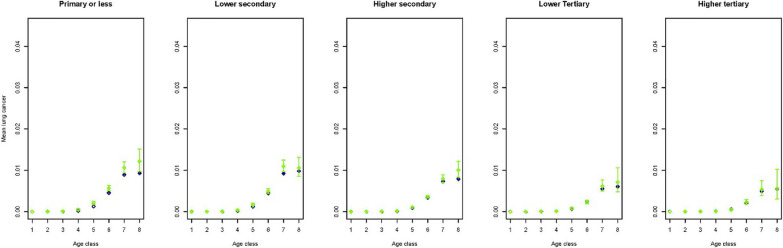
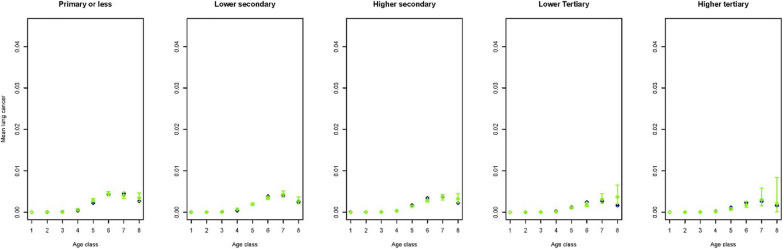
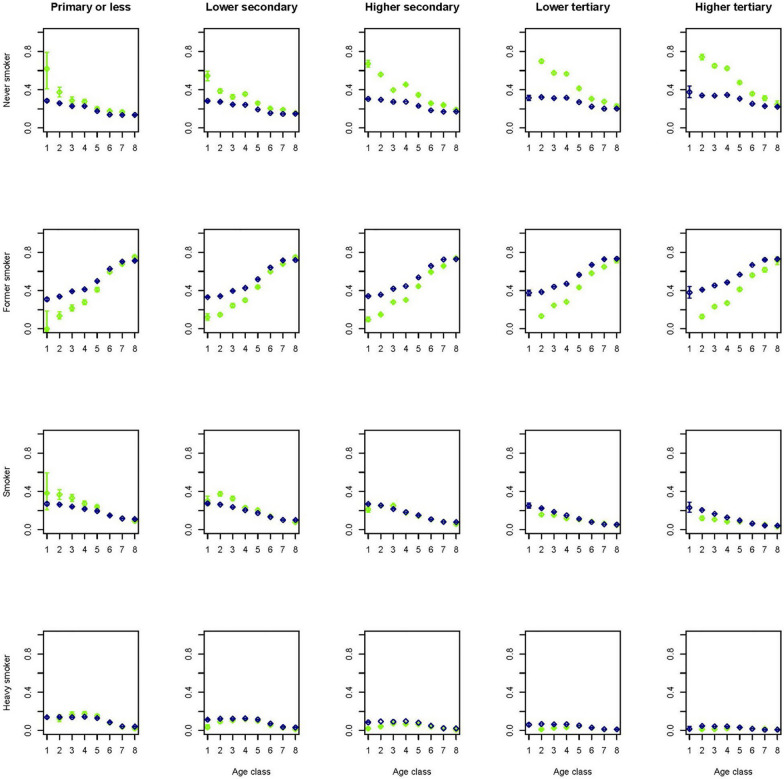
Results: The synthetic population resembles the original confidential population. Features predicted in the first stages of the sequential procedure are virtually similar to those in the original population, while those predicted in later stages of the sequential procedure carry the accumulation of limitations furthered by data quality and previously modelled features.
Conclusions: By combining socio-demographic, economic, health and lifestyle related data at individual level on a large scale, our method provides us with a powerful tool to construct a synthetic population of good quality and with no confidentiality issues.
Keywords: Disclosure risk; Synthetic population.
© 2023. The Author(s).
Conflict of interest statement
The authors declare that they have no competing interests.
Figures

References
-
- Alfons A, Kraft S, Templ M, Filzmoser P. Simulation of synthetic population data for household surveys with application to EU-SILC. Research Report CS-2010-1, Department of Statistics and Probability Theory, Vienna University of Technology; 2010.
-
- Barthelemy J, Cornelis E. Synthetic population: review of the existing approaches. Esch-sur-Alzette: LISER; 2012.
-
- Beckman RJ, Baggerly KA, McKay MD. Creating synthetic baseline populations. Transp Res. 1996;30(6):415–429.
-
- Centraal Bureau voor de Statistiek. Opbouw en instructie totaalbestand Gezondheidsmonitor Volwassenen 2012 [Internet]. Centraal Bureau voor de Statistiek. 2015. https://www.cbs.nl/nl-nl/onze-diensten/methoden/onderzoeksomschrijvingen....
-
- Boshuizen HC, Lhachimi SK, van Baal PHM, Hoogenveen RT, Smit HA, Mackenbach JP, Nusselder WJ. The DYNAMO-HIA model: an efficient implementation of a risk factor/chronic disease Markov model for use in Health Impact Assessment (HIA) Demography. 2012;49(4):1259–1283. doi: 10.1007/s13524-012-0122-z. - DOI - PubMed
MeSH terms
LinkOut - more resources
Full Text Sources
