. 2023 Nov 1;11(1):225.
doi: 10.1186/s40168-023-01662-3.

Microbial hitchhikers harbouring antimicrobial-resistance genes in the riverine plastisphere

Affiliations

Microbial hitchhikers harbouring antimicrobial-resistance genes in the riverine plastisphere

Vinko Zadjelovic et al. Microbiome. .

Abstract

Background: The widespread nature of plastic pollution has given rise to wide scientific and social concern regarding the capacity of these materials to serve as vectors for pathogenic bacteria and reservoirs for Antimicrobial Resistance Genes (ARG). In- and ex-situ incubations were used to characterise the riverine plastisphere taxonomically and functionally in order to determine whether antibiotics within the water influenced the ARG profiles in these microbiomes and how these compared to those on natural surfaces such as wood and their planktonic counterparts.

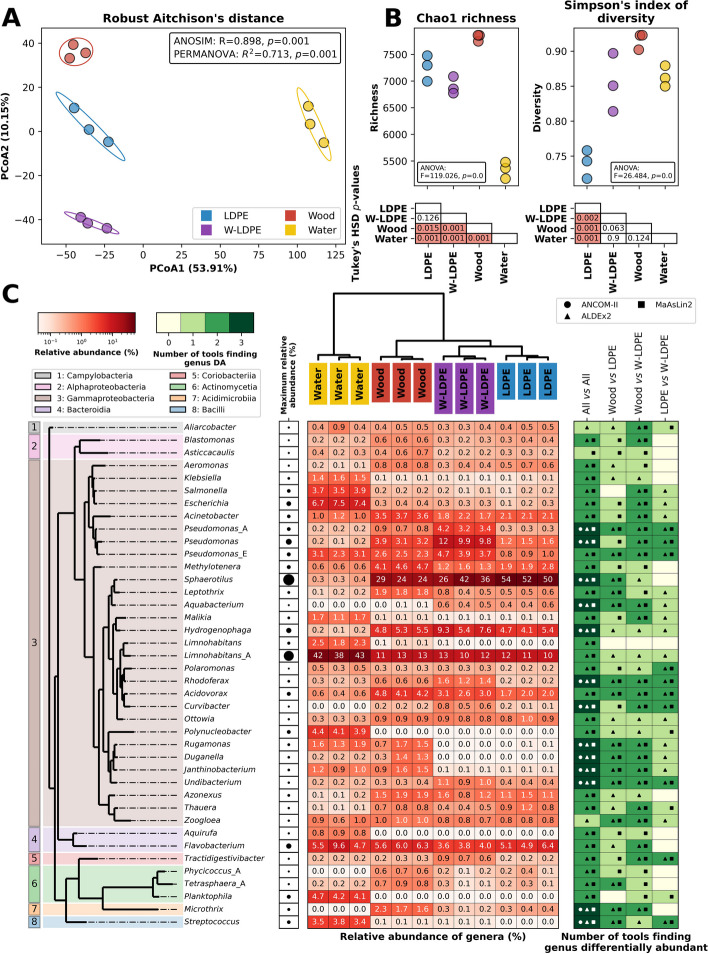
Results: We show that plastics support a taxonomically distinct microbiome containing potential pathogens and ARGs. While the plastisphere was similar to those biofilms that grew on wood, they were distinct from the surrounding water microbiome. Hence, whilst potential opportunistic pathogens (i.e. Pseudomonas aeruginosa, Acinetobacter and Aeromonas) and ARG subtypes (i.e. those that confer resistance to macrolides/lincosamides, rifamycin, sulfonamides, disinfecting agents and glycopeptides) were predominant in all surface-related microbiomes, especially on weathered plastics, a completely different set of potential pathogens (i.e. Escherichia, Salmonella, Klebsiella and Streptococcus) and ARGs (i.e. aminoglycosides, tetracycline, aminocoumarin, fluoroquinolones, nitroimidazole, oxazolidinone and fosfomycin) dominated in the planktonic compartment. Our genome-centric analysis allowed the assembly of 215 Metagenome Assembled Genomes (MAGs), linking ARGs and other virulence-related genes to their host. Interestingly, a MAG belonging to Escherichia -that clearly predominated in water- harboured more ARGs and virulence factors than any other MAG, emphasising the potential virulent nature of these pathogenic-related groups. Finally, ex-situ incubations using environmentally-relevant concentrations of antibiotics increased the prevalence of their corresponding ARGs, but different riverine compartments -including plastispheres- were affected differently by each antibiotic.

Conclusions: Our results provide insights into the capacity of the riverine plastisphere to harbour a distinct set of potentially pathogenic bacteria and function as a reservoir of ARGs. The environmental impact that plastics pose if they act as a reservoir for either pathogenic bacteria or ARGs is aggravated by the persistence of plastics in the environment due to their recalcitrance and buoyancy. Nevertheless, the high similarities with microbiomes growing on natural co-occurring materials and even more worrisome microbiome observed in the surrounding water highlights the urgent need to integrate the analysis of all environmental compartments when assessing risks and exposure to pathogens and ARGs in anthropogenically-impacted ecosystems. Video Abstract.


Conflict of interest statement

E.M.H.W. and J.A.C-O are currently serving as the Editor-in-Chief and Associate Editor, respectively, for the journal Microbiome. However, it is important to note that they were not involved in the Handling Editor or Reviewer selection processes, nor any other stage of the evaluation and decision process.

Figures

Fig. 1
Fig. 1
Microbial community analysis of 7-day-old biofilms grown on LDPE, W-LDPE and wood, as well as the riverine planktonic community of the surrounding water. A Principal Component Analysis (PCoA) showing samples grouped by Robust Aitchison’s distance (i.e. Euclidean distance of robust Centered-Log Ratio transformed counts). The variation accounted for by each principal component is indicated in parentheses on the axes. Ellipses show the mean of three sample replicates for each treatment plus the standard deviation. ANOSIM and PERMANOVA tests between the treatments are shown in the box. B Chao1 richness and Simpson’s diversity index in the three replicates for each treatment. The results of ANOVA tests for differences between treatments are shown in boxes within the axes, while p-values for post-hoc Tukey’s honestly significant difference (HSD) between treatments are shown underneath (highlighted in red are significant values; p ≤ 0.05). Both (A) and (B) show results for reads classified to the species level. C Forty most abundant bacterial genera detected amongst all metagenomes (i.e. those above 0.5% relative abundance). Bacterial genera are grouped by phylogenetic similarity. Colour shading indicates the class each genus belongs to. The relative abundance of each genus (in %) is shown in the central heatmap, normalised per column. The top dendrogram shows samples grouped by Robust Aitchison’s distance. The heatmap on the right shows whether taxa were significantly differentially abundant between conditions. We used three tools to determine whether taxa were differentially abundant, ANCOM-II, ALDEx2 and MaAsLin2 (Table S2). White represents that no tool found the genus to be differentially abundant between conditions, while dark green shows that all three tools found a difference. Shapes within cells denote which of the three tools found a significant difference
Fig. 2
Fig. 2
Differential occurrence of disinfectants and antibiotic resistance determinants. Reads within samples were classified using the CARD RGI tool and grouped to the drug class that they gave resistance to. A Principal Component Analysis (PCoA) showing samples grouped by Robust Aitchison’s distance (i.e. Euclidean distance of robust Centered-Log Ratio transformed counts). The variation accounted for by each principal component is indicated in parentheses on the axes. Ellipses show the mean plus three standard deviations for each treatment, and the box shows the results of ANOSIM and PERMANOVA tests between the treatments. B Chao1 richness or Simpson’s diversity index in each of the three replicates for each treatment (top). The results of ANOVA tests for differences between treatments are shown in boxes within the axes, while p-values for post-hoc Tukey’s honestly significant difference (HSD) between treatments are shown (highlighted in red are significant values; p ≤ 0.05; bottom). Both (A) and (B) show results for reads classified as ARGs. C The number of reads classified (in reads per kilobase per million, RPKM; blue colour scale) and the number of ARGs identified within each sample (red colour scale). The main heatmap (blue to yellow colour scale) shows the abundance of ARGs giving resistance to different drug classes with the number of genes detected within each drug class shown on the right. Numbers within cells indicate RPKM, while the colour shows the proportion of the maximum for that drug class
Fig. 3
Fig. 3
Abundance of the top 20 most abundant ARGs in different samples. The size of the bubble for each ARG (y-axis) represents the abundance in RPKM within each sample (x-axis), while the colour represents the normalised abundance for each gene. The drug class that each ARG gives resistance to is shown on the right
Fig. 4
Fig. 4
Shortlist of MAGs (n = 115) encoding three or more ARGs. MAGs were taxonomically classified with the GTDB toolkit providing the phylogenomic tree shown on the left. The normalised abundance within the different treatments is shown considering triplicate samples. The number of virulence factors, toxins and different ARGs (as predicted by PathoFact) are represented. A summary for all bacterial MAGs (n = 214) is available in Fig. S5
Fig. 5
Fig. 5
AMR profile of microbial communities in ex-situ microcosms exposed to sub-inhibitory antibiotic concentrations and analysed by HT-qPCR. A The total number of detected genes in each sample are shown in the red colour scale in the top panel, while the abundance of individual ARGs relative to the 16S rRNA gene is represented in the bottom panel using a blue to yellow colour scale to indicate lowest to highest relative abundances (%) within each row. Dark blue cells represent no detection. The F values for significant (p 0.05) two-factor ANOVA tests between all samples are also shown with a black-red-white colour scale (right panel). B For each drug class, the number of genes tested by Resistomap is shown underneath the title (see Table S4A for full details) together with the ANOVA test on the differences due to the presence of antibiotics (‘A’), surface vs. planktonic (‘S’) or both (‘A:S’), with significant results indicated with red shading. ‘Genes detected’ represents the number of the genes within each drug class that were detected per sample. The combined abundance of the genes relative to the 16S rRNA gene are graphed, with points indicating the mean and error bars showing the standard deviation

References

    1. Alcock BP, Raphenya AR, Lau TTY, Tsang KK, Bouchard M, Edalatmand A, Huynh W, Nguyen ALV, Cheng AA, Liu S, Min SY, Miroshnichenko A, Tran HK, Werfalli RE, Nasir JA, Oloni M, Speicher DJ, Florescu A, Singh B, Faltyn M, Hernandez-Koutoucheva A, Sharma AN, Bordeleau E, Pawlowski AC, Zubyk HL, Dooley D, Griffiths E, Maguire F, Winsor GL, Beiko RG, Brinkman FSL, Hsiao WWL, Domselaar GV, McArthur AG. CARD 2020: antibiotic resistome surveillance with the comprehensive antibiotic resistance database. Nucleic Acids Res. 2020;48:D517–D525. doi: 10.1093/nar/gkz935. - DOI - PMC - PubMed
    1. Allaire J, Ushey K, Tang Y, Eddelbuettel D. reticulate: R Interface to Python. 2017.
    1. Almagro Armenteros JJ, Tsirigos KD, Sønderby CK, Petersen TN, Winther O, Brunak S, von Heijne G, Nielsen H. SignalP 5.0 improves signal peptide predictions using deep neural networks. Nat Biotechnol. 2019;37:420–423. doi: 10.1038/s41587-019-0036-z. - DOI - PubMed
    1. Alneberg J, Bjarnason BS, De Bruijn I, Schirmer M, Quick J, Ijaz UZ, Lahti L, Loman NJ, Andersson AF, Quince C. Binning metagenomic contigs by coverage and composition. Nat Methods. 2014;11:1144–1146. doi: 10.1038/nmeth.3103. - DOI - PubMed
    1. Amaral-Zettler LA, Zettler ER, Mincer TJ. Ecology of the plastisphere. Nat Rev Microbiol. 2020 doi: 10.1038/s41579-019-0308-0. - DOI - PubMed

Publication types