. 2023 Oct 16:10:1249939.
doi: 10.3389/fmolb.2023.1249939. eCollection 2023.

Structural properties of the HNF-1A transactivation domain

Affiliations

Structural properties of the HNF-1A transactivation domain

Laura Kind et al. Front Mol Biosci. .

Abstract

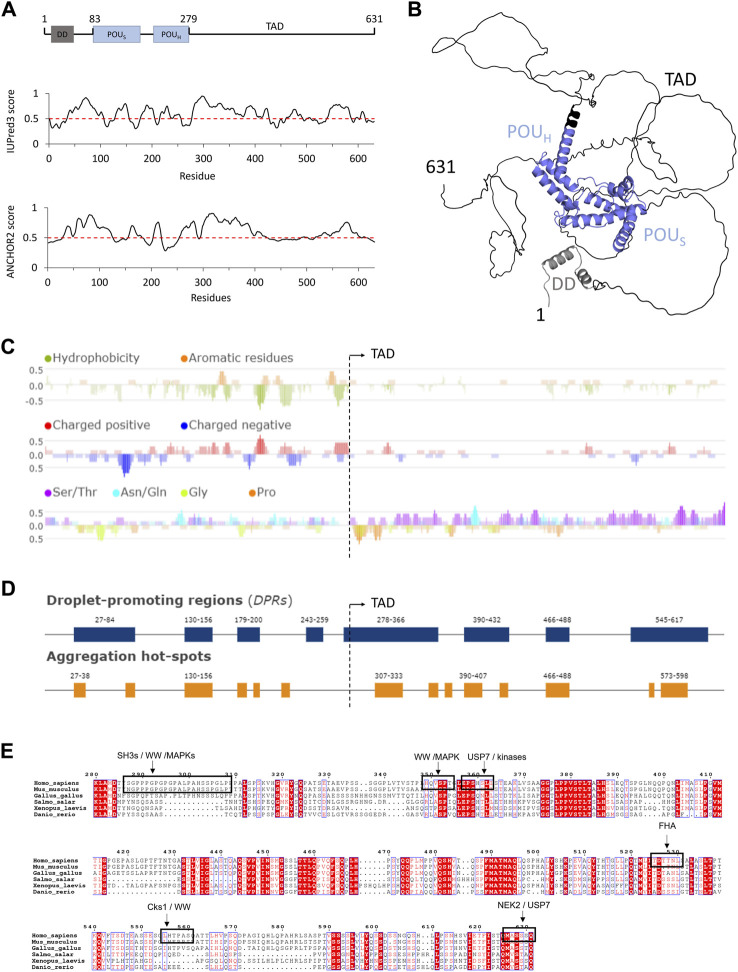
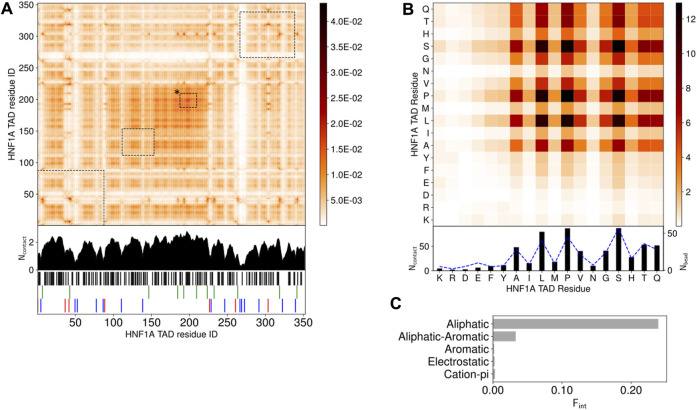
Hepatocyte nuclear factor 1α (HNF-1A) is a transcription factor with important gene regulatory roles in pancreatic β-cells. HNF1A gene variants are associated with a monogenic form of diabetes (HNF1A-MODY) or an increased risk for type 2 diabetes. While several pancreatic target genes of HNF-1A have been described, a lack of knowledge regarding the structure-function relationships in HNF-1A prohibits a detailed understanding of HNF-1A-mediated gene transcription, which is important for precision medicine and improved patient care. Therefore, we aimed to characterize the understudied transactivation domain (TAD) of HNF-1A in vitro. We present a bioinformatic approach to dissect the TAD sequence, analyzing protein structure, sequence composition, sequence conservation, and the existence of protein interaction motifs. Moreover, we developed the first protocol for the recombinant expression and purification of the HNF-1A TAD. Small-angle X-ray scattering and synchrotron radiation circular dichroism suggested a disordered conformation for the TAD. Furthermore, we present functional data on HNF-1A undergoing liquid-liquid phase separation, which is in line with in silico predictions and may be of biological relevance for gene transcriptional processes in pancreatic β-cells.

Keywords: HNF-1A; MODY; diabetes; intrinsically disordered protein; liquid-liquid phase separation; short linear motif; transcription factor; β-cell.


Conflict of interest statement

The authors declare that the research was conducted in the absence of any commercial or financial relationships that could be construed as a potential conflict of interest.

Figures

FIGURE 1
FIGURE 1
Structure prediction and sequence analysis of HNF-1A (A). Top: Domain overview of full-length HNF-1A with residue numbers indicated above. DD—Dimerization domain. POUS—POU-specific domain. POUH—POU homeodomain. TAD—Transactivation domain. Middle: IUPred3 (Erdős et al., 2021) disorder prediction for full-length HNF-1A. Values above the threshold (red dashed line) indicate tendency for disorder, while values below the threshold indicate tendency for order. Bottom: ANCHOR2 (Mészáros et al., 2009) prediction of protein regions that undergo disorder-to-order transitions upon binding. High values represent highly disordered binding regions (B). AlphaFold model for full-length HNF-1A (Jumper et al., 2021; Varadi et al., 2022). Coloring based on the domain presentation in (A). (C) Fast Estimator of Latent Local Structure (FELLS) sequence analysis for full-length HNF-1A regarding residue hydrophobicity (top), amino acid charge (middle), and compositional bias towards Ser/Thr, Asn/Gln, Gly, and Pro residues (bottom). (D) FuzDrop predictions of droplet-promoting regions and aggregation hotspots in full-length HNF-1A. (E) Multiple sequence alignment of HNF-1A TAD (residues 280-631) for the model organisms Homo sapiens, Mus musculus, Gallus gallus, Salmo salar, Xenopus laevis, Danio rerio. Conserved residues are marked with red background, and similar residues are denoted in red notation. SLiMs retrieved from the ELM database are depicted by a black box and specified by the description above.
FIGURE 2
FIGURE 2
Purification and biophysical characterization of the DBD-TAD construct (A). SEC profile with the DBD-TAD containing peak indicated (B). SDS-PAGE analysis of respective SEC fractions from various peaks of the chromatogram shown in (A). Agg—SEC fractions containing aggregated proteins. The bands marked with “*” were pooled and used for experiments. Lower molecular weight species in the residual SEC fractions corresponded to degradation products of the recombinant protein (C). SRCD spectra for DBD (grey) and DBD-TAD (black). A theoretical spectrum for the isolated TAD (orange) was calculated by subtraction of the two obtained spectra (D). TFE titration experiment for DBD-TAD (E–G). SAXS data analyses for DBD-TAD. DBD SAXS data, previously published by us (Kind et al., 2022), are presented for direct comparison (E). Scattering curve (F). Distance distribution function (G). Normalized Kratky plot, with the cross indicating the expected maximum for a globular particle (√3, 1.104) (Durand et al., 2010) (H). D max (red) and R g (black) distributions from EOM analysis for DBD-TAD, illustrating ensemble frequencies as solid lines and pool frequencies as dashed lines (I). Seven conformer structures in the generated EOM ensemble with assigned abundance values, each represented in a different color. The models were superposed based on the POUS domain (black). Conformers are grouped by the degree of compaction.
FIGURE 3
FIGURE 3
Initial evidence for LLPS behavior of HNF-1A (A,B). Representative DIC microscopy images of purified DBD-TAD (A) or DBD (B) at different concentrations (10–25 µM) in the presence of 10% PEG8000 as a molecular crowding agent (C). IF images of MIN6 β-like cells, stained for HNF-1A using an HNF-1A specific antibody and DNA using DAPI stain. Two fields of view from the same microscopy slide are presented, where the left image represents HNF-1A signals (green) and the right image a superposition of the same HNF-1A signal (green) and nuclear DAPI signal (blue).
FIGURE 4
FIGURE 4
LLPS promoting TAD interactions, studied by droplet simulations (A). Intermolecular contact map by residue index for 120 HNF-1A TAD molecules at 150 mM ion concentration and 300 K. The contacts in the contact maps by residue index are averaged in time (600 frames) and normalized by the number of HNF-1A TAD molecules (120) in the simulation. The 1D summation is shown below the contact map for each residue. Residues are categorized into 5 groups: cations (R, K)- red, anions (D, E)- blue, aromatic (F, Y, W)- green, aliphatic (A, C, I, L, M, P, V)- black, hydrophilic (G, N, S, H, Q, T)- white. The interactions between droplet promoting regions predicted by FuzDrop (Figure 1D) are shown by black dashed boxes. Box marked with “*” corresponds to FuzDrop DPR 466–488 (B). Intermolecular contact map by residue type for 120 HNF-1A TAD molecules. The contact map is a matrix reduction of the contact map by residue index in (A). The abundance for the residues, Nbead, are shown by blue dashed lines (C). Interaction summary for a droplet simulation with 120 HNF-1A TAD molecules at 150 mM ion concentration and 300 K. The fraction of interactions, Fint, are aggregated by type and normalized by the total number of interactions.
FIGURE 5
FIGURE 5
Hypothesis on the possible mechanism of TAD-dependent gene transcriptional activation by HNF-1A. This illustration is a highly simplified model with a focus on HNF-1A. Numerous other currently unknown molecules are likely to participate in the potential formation of transcriptional condensates at HNF-1A target sites. Blue: DBD of HNF-1A. Orange: DD of HNF-1A. Black line: TAD of HNF-1A. Grey: co-condensating molecules, e.g., proteins or RNA. Yellow: co-condensating co-activators.

References

    1. Alberti S., Dormann D. (2019). Liquid-liquid phase separation in disease. Annu. Rev. Genet. 53, 171–194. 10.1146/annurev-genet-112618-043527 - DOI - PubMed
    1. Alberti S., Gladfelter A., Mittag T. (2019). Considerations and challenges in studying liquid-liquid phase separation and biomolecular condensates. Cell 176 (3), 419–434. 10.1016/j.cell.2018.12.035 - DOI - PMC - PubMed
    1. Arai M., Ferreon J. C., Wright P. E. (2012). Quantitative analysis of multisite protein-ligand interactions by NMR: binding of intrinsically disordered p53 transactivation subdomains with the TAZ2 domain of CBP. J. Am. Chem. Soc. 134 (8), 3792–3803. 10.1021/ja209936u - DOI - PMC - PubMed
    1. Bach I., Yaniv M. (1993). More potent transcriptional activators or a transdominant inhibitor of the HNF1 homeoprotein family are generated by alternative RNA processing. EMBO J. 12 (11), 4229–4242. 10.1002/j.1460-2075.1993.tb06107.x - DOI - PMC - PubMed
    1. Banani S. F., Lee H. O., Hyman A. A., Rosen M. K. (2017). Biomolecular condensates: organizers of cellular biochemistry. Nat. Rev. Mol. Cell Biol. 18 (5), 285–298. 10.1038/nrm.2017.7 - DOI - PMC - PubMed

LinkOut - more resources