. 2022 Oct 13;58(5):e771-e780.
doi: 10.1055/s-0042-1749418. eCollection 2023 Oct.

Animal Model Standardization for Studying Avascular Necrosis of the Femoral Head in Legg-Calvé-Perthes Disease

Affiliations

Animal Model Standardization for Studying Avascular Necrosis of the Femoral Head in Legg-Calvé-Perthes Disease

Edson Hidenori Miashiro et al. Rev Bras Ortop (Sao Paulo). .

Abstract

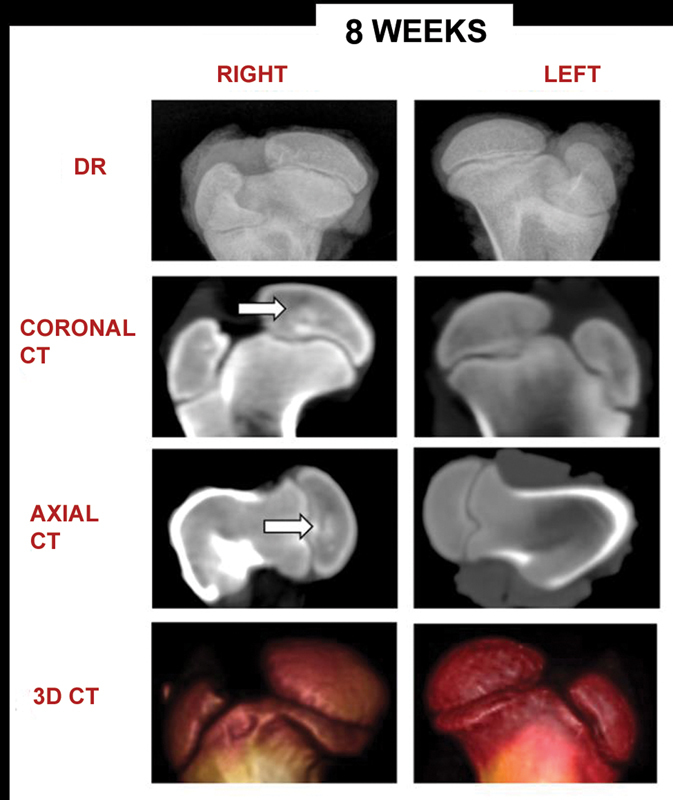
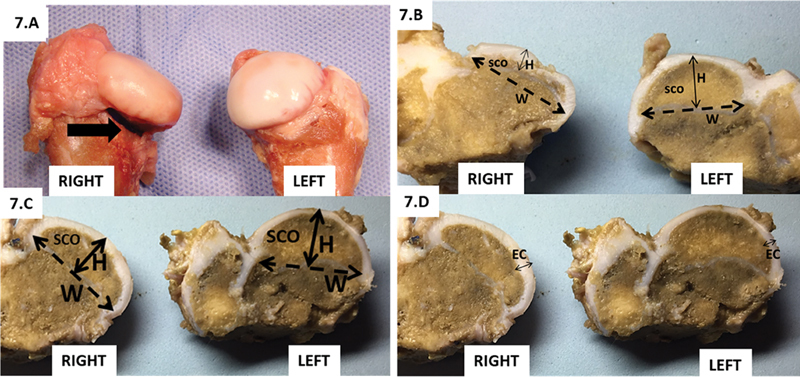
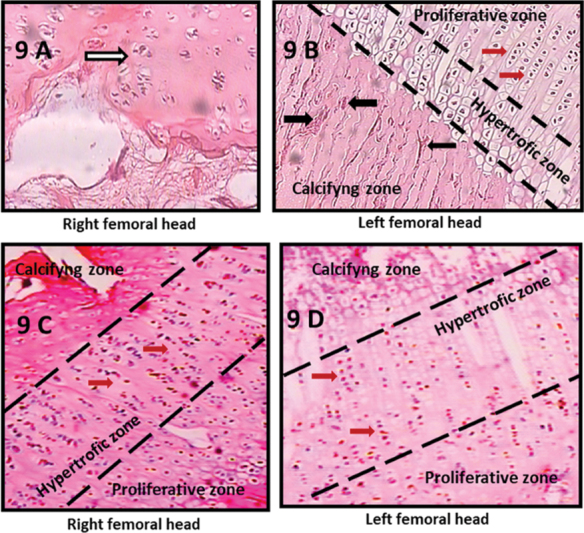
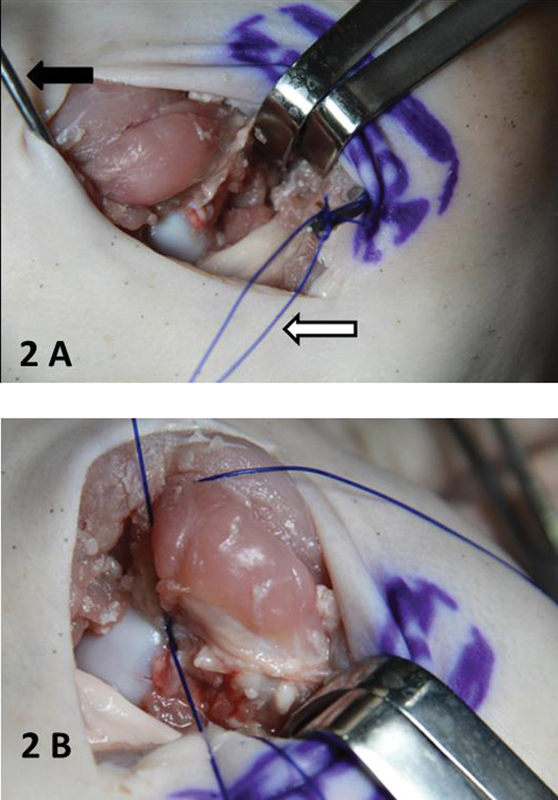
Objective Testing an experimental model for ischemic necrosis of the femoral head in Legg-Calvé-Perthes disease by evaluating gait, imaging and morphohistology. Methods The operation was done in 11 piglets. Necrosis by cerclage in the right femoral neck was induced. Piglets were divided into group A, with 8 animals, euthanizing two in the 2 nd , 4 th , 6 th , and 8 th weeks, respectively; and group B, with 2 animals ( sham ), submitted to the surgical procedure without cerclage of the right femoral neck. The gait classification used was that of Etterlin. The frozen femurs were submitted to digital radiography and computed tomography. The height and width of the epiphysis and epiphysary coefficient were measured at study times. Light microscopy and immunohistochemistry with TGF-β1 were performed. Results One animal died of sepsis in Group A. In this group, claudication was observed in all animals. On digital radiography and computed tomography, bone sclerosis, enlargement of the right femoral neck, flattening, collapse, and fragmentation of the right femoral head were observed. All epiphysis height and epiphysary coefficient values of the right femoral head were lower than the contralateral ones, in which were observed chondrocytes disordered and separated by gaps. A reduction in TGF-β1 expression was observed at 2 and 6 weeks in the right femoral head and at eight in the left. In group B, there were no signs of necrosis and gait was normal. Conclusions The model presented reproduced macroscopic necrosis on digital radiography, computed tomography, and microscopy. Gait evaluation showed a good correlation with other ischemia findings. Level of Evidence V. Diagnostic studies.

Keywords: Legg-Calvé-Perthes disease; femur head necrosis; ischemia; models, animal.


Conflict of interest statement

Conflito de Interesses Os autores declaram não haver conflito de interesses.

Figures

Fig. 1
Fig. 1
( A ) Description of posterior approach parameters. Posterior approach (black arrow). Apex of the greater trochanter (white arrow). ( B ) Posterior approach: deep plans. Clearance of the gluteus medius muscle with a Farabeuf (larger white arrow). Identification of the femoral head (smaller white arrow). Capsulotomy (larger black arrow). Identification of the ligamentum teres (smaller black arrow).
Fig. 2
Fig. 2
( A ) Passage of two Prolene 2 Ethicon wires (white arrow) around the femoral neck with a “wire pass instrument” (black arrow). ( B ) Double cerclage around the femoral neck with Prolene 2 Ethicon wires.
Fig. 3
Fig. 3
Description of the femoral head of the piglet. Front cut of the femoral head at midpoint. Secondary center of ossification (SCO) surrounded by epiphyseal cartilage (EC). Growth plate (GP) located between EC and SCO. Metaphyseal physis (MP) located at the base of the SCO. Methaphysis (M) of the proximal femur, located below MP.
Fig. 4
Fig. 4
Description of the height and width of the epiphysis and epiphyseal coefficient (EC). The height of the epiphysis is represented by the closed arrow (H). The width of the epiphysis is represented by the dotted arrow (W). The EC is calculated by the ratio between H and W.
Fig. 5
Fig. 5
Digital radiography (DR) and computed tomography (CT) of the proximal 1/3 of the right and left femurs of piglets euthanized after 6 weeks of ischemic induction. Total collapse and fragmentation were observed on right femora head, in DR and CT, with loss of the semiespheric format. A large enlargement of the femoral neck (arrows) was observed. Collapse and fragmentation were detailed in 3D CT.
Fig. 6
Fig. 6
Digital radiography (DR) and computed tomography (CT) of the proximal 1/3 of the right and left femurs of piglets euthanized after 8 weeks of ischemic induction. In RD and CT, a loss of the semiespheric shape and flattening of the right femoral head (FH) and sclerotic areas suggestive of necrosis of the femoral head (arrows) were observed.
Fig. 7
Fig. 7
( A ) Photograph of the femoral heads (FHs) right and left of the piglet euthanized after 6 weeks of ischemia. Flattening of the right femoral head and tight cerclage to the femoral neck (black arrow) are observed. (B) Frontal cut photograph of femoral heads (FHs) of the piglet euthanized after 6 weeks of ischemia. The right femoral head (FH) has a smaller height (H) and a width (W) greater than the control left side. The secondary center of ossification (SCO) of the right FH is deformed and decreased. It is observed the loss of the semiespheric format of the SCO. (C) Front cut photograph of the FHs from a piglet euthanized after 8 weeks of ischemia. The right FH has H smaller and W greater than the left control side . (D) Front cut photograph of the FHs from a piglet euthanized after 8 weeks of ischemia. The epiphyseal cartilage (EC) on the right side is thicker than the EC on the left side.
Fig. 8
Fig. 8
Digital radiography (DR) and computed tomography (CT) of the proximal 1/3 of the right and left femurs of piglets of group B. The right femoral heads (FHs) did not present differences compared to the control left FHs, without radiographic signs of ischemic necrosis of the femoral head (FHIN), remaining semiespheric without areas of depression and sclerosis.
Fig. 9
Fig. 9
Photograph of growth plates (GP) of the femurs from piglets euthanized after 6 weeks of surgery. Photomicrography in 100-fold increase from growth plates of the femurs from piglets euthanized after 6 weeks of surgery. (A) In group A, in GP of the right femoral head (FH), the presence of chondrocytes grouped in a disorganized way (white arrow) and separated by large empty gaps was identified. (B) In the GPs of the left FHs (control), chondrocytes were well organized in columns arranged in parallel (red arrows). The proliferative, hypertrophic, and calcification zones are clearly divided and visible. Vascular proliferation was observed in the calcification zone (black arrows). (C. and D) In Group B, the growth plates of the right and left FHs showed no differences. Normal aspect, with the proliferation, hypertrophic, and calcification zones clearly identified, and chondrocytes were organized in columns (red arrows).
Fig. 10
Fig. 10
Description of TGF-β1 expression in femoral heads (FHs) according to ischemia time. The columns indicate TGF-β1 expression. CE: Left FHs of Right FHs of Group B. CD: Group B. 2SE: Left FHs from piglets euthanized with 2 weeks. 2SD: Right FHs from piglets euthanized with 2 weeks. 4SE: Left FHs from piglets euthanized at 4 weeks. 4SD: Right FHs from piglets euthanized with 4 weeks. 6SE: Left FHs from piglets euthanized with 6 weeks. 6SD: Right FHs from piglets euthanized with 6 weeks. 8SE: Left FHs from piglets euthanized with 8 weeks. 8SD: Right FHs from piglets euthanized with 8 weeks. The test used was the Student t-test , significance level p  = 0.050.
Fig. 1
Fig. 1
( A ) Descrição dos parâmetros da via de acesso. Via de acesso posterior (seta preta). Ápice do trocânter maior (seta branca). ( B ) Via de acesso: planos profundos. Afastamento do músculo glúteo médio com um Farabeuf (seta branca maior). Identificação da cabeça femoral (seta branca menor). Realização de capsulotomia (seta preta maior). Identificação do ligamento redondo (seta preta menor).
Fig. 2
Fig. 2
( A ) Passagem de dois fios Prolene 2 Ethicon (seta branca) em torno do colo femoral com um instrumento “passa-fios” (seta preta). ( B ) Realização de cerclagem dupla em torno do colo femoral com fios Prolene 2 Ethicon.
Fig. 3
Fig. 3
Descrição da cabeça femoral do leitão imaturo. Corte frontal da cabeça femoral no ponto médio. Centro de ossificação secundário (COS) circundado pela cartilagem epifisária (CE). Placa de crescimento (PC) localizada entre CE e COS. Fise metafisária (FM) localizada na base do COS. Metáfise (M) do fêmur proximal, localizada abaixo da FM.
Fig. 4
Fig. 4
Descrição da altura e largura da epífise e do coeficiente epifisário (COE). A altura da epífise é representada pela seta fechada (A). A largura da epífise é representada pela seta pontilhada (D). O COE é calculado pela razão entre A e D.
Fig. 5
Fig. 5
Radiografia digital (RD) e tomografia computadorizada (TC) do 1/3 proximal dos fêmures direito e esquerdo de leitão sacrificado após 6 semanas da indução isquêmica. Foi observado um colapso total e fragmentação da cabeça femoral (CF) direito na RD e TC, com perda do formato semiesférico. Observou-se um grande alargamento do colo femoral (setas). O colapso e a fragmentação foram detalhados na TC-3D.
Fig. 6
Fig. 6
Radiografia digital (RD) e tomografia computadorizada (TC) do 1/3 proximal dos fêmures direito e esquerdo de leitão sacrificado após 8 semanas da indução isquêmica. Na RD e TC foram observados uma perda do formato semiesférico e achatamento da cabeça femoral (CF) direita e áreas escleróticas sugestivas de necrose da cabeça do fêmur (setas).
Fig. 7
Fig. 7
( A ) Fotografia das cabeças femorais (CFs) direita e esquerda do leitão sacrificado após 6 semanas de isquemia. Observa-se o achatamento da cabeça femoral direita e a cerclagem justa ao colo femoral (Seta preta). ( B ) Fotografia de corte frontal das cabeças femorais (CFs) do leitão sacrificado após 6 semanas de isquemia. A cabeça femoral (CF) direita apresenta altura (A) menor e largura (D) maior que o lado esquerdo controle. O centro de ossificação secundário (COS) da CF direita está deformado e diminuído. Observa-se a perda do formato semiesférico do COS. ( C ) Fotografia do corte frontal das CFs do leitão sacrificado após 8 semanas de isquemia. A CF direita apresenta A menor e D maior que o lado esquerdo controle. ( D ) Fotografia do corte frontal das CFs do leitão sacrificado após 8 semanas de isquemia. A cartilagem epifisária (CE) do lado direito é mais espessa que a CE do lado esquerdo.
Fig. 8
Fig. 8
Radiografia digital (RD) e tomografia computadorizada (TC) do 1/3 proximal dos fêmures direito e esquerdo de leitão do grupo B. As cabeças femorais (CFs) direitas não apresentaram diferenças comparadas às CFs esquerdas controle, sem sinais radiográficos de necrose isquêmica da cabeça femoral (NICF), permanecendo semiesféricas sem áreas de depressão e esclerose.
Fig. 9
Fig. 9
Fotografia das placas de crescimento (PC) dos fêmures de leitões sacrificados após 6 semanas de cirurgia. Fotomicrografia em aumento de 100 vezes das placas de crescimento dos fêmures de leitões sacrificados após 6 semanas de cirurgia. ( A ) No grupo A, na PC da cabeça femoral (CF) direita identificou-se a presença de condrócitos agrupados de maneira desorganizada (seta branca) e separados por grandes lacunas vazias. ( B ) nas PCs das CFs esquerdas (controle) foram observados condrócitos bem-organizados em colunas dispostas paralelamente (setas vermelhas). As zonas proliferativa, hipertrófica e de calcificação estão nitidamente divididas e visíveis. Observou-se presença de proliferação vascular na zona de calcificação (setas pretas). ( C. e D ). No Grupo B, as placas de crescimento das CFs direita e esquerda não apresentaram diferenças. Aspecto normal, apresentando as zonas de proliferação, hipertrófica e calcificação claramente identificadas e condrócitos organizados em colunas (setas vermelhas).
Fig. 10
Fig. 10
Descrição da expressão do TGF- β1 nas cabeças femorais (CFs) de acordo com o tempo de isquemia. As colunas indicam a expressão do TGF-β1. CE: CFs esquerdas do grupo B. CD: CFs direitas do grupo B. 2SE: CFs esquerdas dos leitões sacrificados com 2 semanas. 2SD: CFs direitas dos leitões sacrificados com 2 semanas. 4SE: CFs esquerdas dos leitões sacrificados com 4 semanas. 4SD: CFs direitas dos leitões sacrificados com 4 semanas. 6SE: CFs esquerdas dos leitões sacrificados com 6 semanas. 6SD: CFs direitas dos leitões sacrificados com 6 semanas. 8SE: CFs esquerdas dos leitões sacrificados com 8 semanas. 8SD: CFs direitas dos leitões sacrificados com 8 semanas. O teste utilizado foi o t de Student, nível de significância p  = 0,050.

Similar articles

Cited by

References

    1. Koob T J, Pringle D, Gedbaw E, Meredith J, Berrios R, Kim H KW. Biomechanical properties of bone and cartilage in growing femoral head following ischemic osteonecrosis. J Orthop Res. 2007;25(06):750–757. - PubMed
    1. Guarniero R. Doença de Legg-Calvé-Perthes: 100 anos. Rev Bras Ortop. 2011;46(01):1–2. - PMC - PubMed
    1. Boss J H, Misselevich I. Osteonecrosis of the femoral head of laboratory animals: the lessons learned from a comparative study of osteonecrosis in man and experimental animals. Vet Pathol. 2003;40(04):345–354. - PubMed
    1. Dailiana Z H, Stefanou N, Khaldi L et al.Vascular endothelial growth factor for the treatment of femoral head osteonecrosis: An experimental study in canines. World J Orthop. 2018;9(09):120–129. - PMC - PubMed
    1. Komiyama T, Nishida K, Yorimitsu M et al.Decreased levels of insulin-like growth factor-1 and vascular endothelial growth factor relevant to the ossification disturbance in femoral heads spontaneous hypertensive rats. Acta Med Okayama. 2006;60(03):141–148. - PubMed