. 2023 Oct 12;5(5):e230090.
doi: 10.1148/ryct.230090. eCollection 2023 Oct.

Quantification of Low-Attenuation Plaque Burden from Coronary CT Angiography: A Head-to-Head Comparison with Near-Infrared Spectroscopy Intravascular US

Affiliations

Quantification of Low-Attenuation Plaque Burden from Coronary CT Angiography: A Head-to-Head Comparison with Near-Infrared Spectroscopy Intravascular US

Hiroki Tanisawa et al. Radiol Cardiothorac Imaging. .

Abstract

Purpose: To determine the association between low-attenuation plaque (LAP) burden at coronary CT angiography (CCTA) and plaque morphology determined with near-infrared spectroscopy intravascular US (NIRS-IVUS) and to compare the discriminative ability for NIRS-IVUS-verified high-risk plaques (HRPs) between LAP burden and visual assessment of LAP.

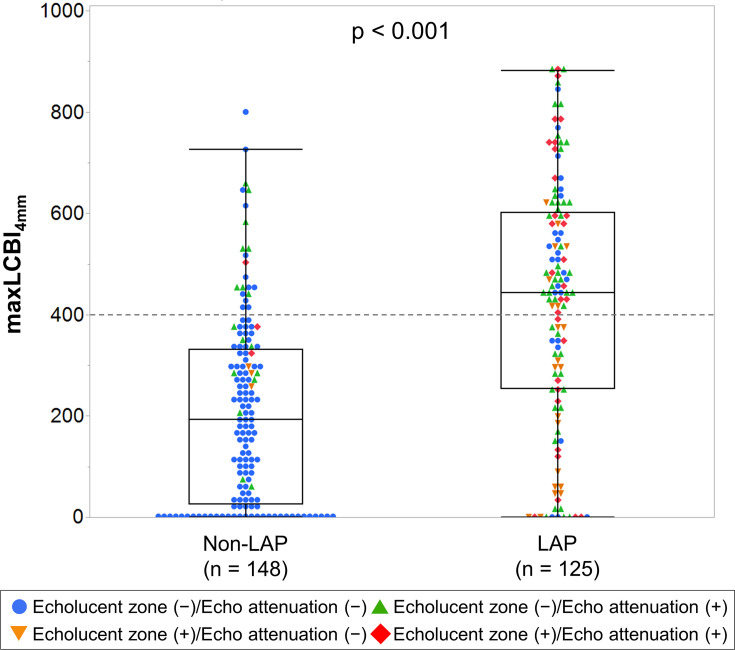
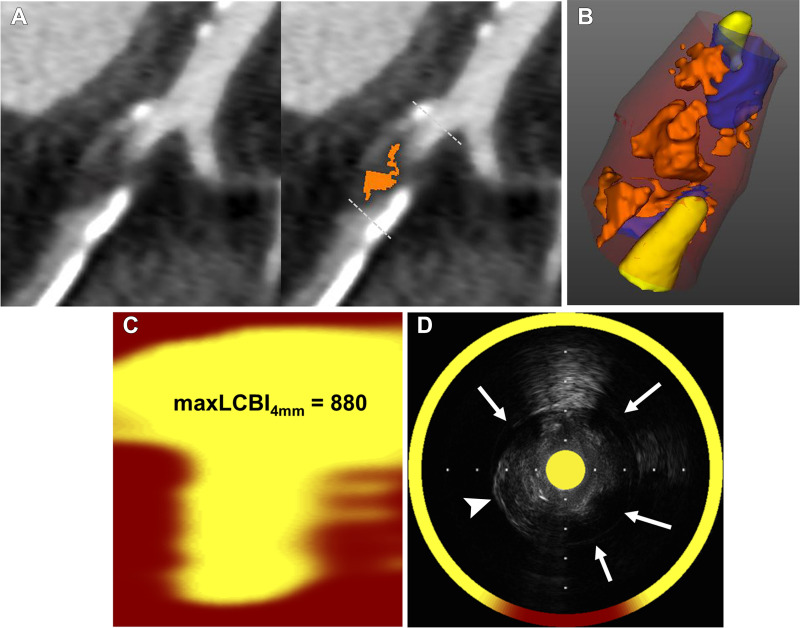
Materials and methods: This Health Insurance Portability and Accountability Act-compliant retrospective study included consecutive patients who underwent CCTA before NIRS-IVUS between October 2019 and October 2022 at two facilities. LAPs were visually identified as having a central focal area of less than 30 HU using the pixel lens technique. LAP burden was calculated as the volume of voxels with less than 30 HU divided by vessel volume. HRPs were defined as plaques with one of the following NIRS-IVUS-derived high-risk features: maximum 4-mm lipid core burden index greater than 400 (lipid-rich plaque), an echolucent zone (intraplaque hemorrhage), or echo attenuation (cholesterol clefts). Multivariable analysis was performed to evaluate NIRS-IVUS-derived parameters associated with LAP burden. The discriminative ability for NIRS-IVUS-verified HRPs was compared using receiver operating characteristic analysis.

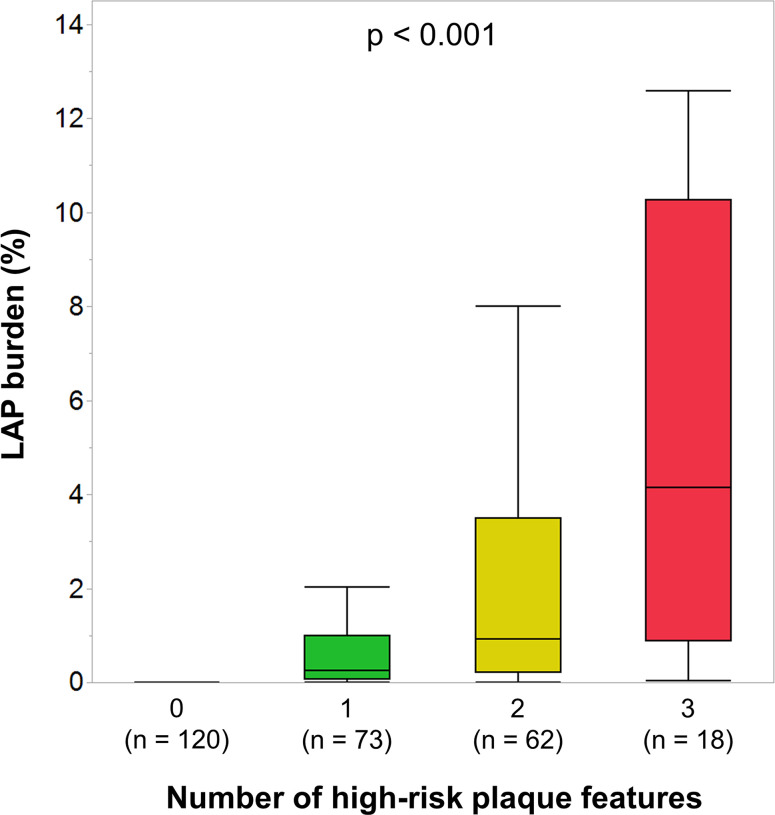
Results: In total, 273 plaques in 141 patients (median age, 72 years; IQR, 63-78 years; 106 males) were analyzed. All the NIRS-IVUS-derived high-risk features were independently linked to LAP burden (P < .01 for all). LAP burden increased with the number of high-risk features (P < .001) and had better discriminative ability for HRPs than plaque attenuation by visual assessment (area under the receiver operating characteristic curve, 0.93 vs 0.89; P = .02).

Conclusion: Quantification of LAP burden improved HRP assessment compared with visual assessment. LAP burden was associated with the accumulation of HRP morphology.Keywords: Coronary CT Angiography, Intraplaque Hemorrhage, Lipid-Rich Plaque, Low Attenuation Plaque, Near-Infrared Spectroscopy Intravascular Ultrasound Supplemental material is available for this article. See also the commentary by Ferencik in this issue.© RSNA, 2023.

Keywords: Coronary CT Angiography; Intraplaque Hemorrhage; Lipid-Rich Plaque; Low Attenuation Plaque; Near-Infrared Spectroscopy Intravascular Ultrasound.


Conflict of interest statement

Disclosures of conflicts of interest: H.T. No relevant relationships. H.M. No relevant relationships. S.C. No relevant relationships. S.H. No relevant relationships. H.O. No relevant relationships. K.I. No relevant relationships. D.I. No relevant relationships. K.K. No relevant relationships. A.S. No relevant relationships. T.H. No relevant relationships. Y.O. No relevant relationships. R.K. No relevant relationships. P.J.S. Grant to author's institution from Siemens Healthcare; NIH grants; software licenses from Cedars-Sinai; consulting fees from Synektik; JNC associate editor; president, Society of Nuclear Medicine & Molecular Imaging Cardiovascular Council. D.D. Royalties/licenses from Cedars-Sinai Medical Center; patents issued (US8885905B2). T.S. No relevant relationships.

Figures

None
Graphical abstract
Study flowchart of the included plaques. A low-attenuation plaque
(LAP) was defined as the presence of at least one voxel less than 30 HU in
the center of the plaque, and non-LAP was defined as the absence of a voxel
less than 30 HU. CCTA = coronary CT angiography, NIRS-IVUS = near-infrared
spectroscopy intravascular US.
Figure 1:
Study flowchart of the included plaques. A low-attenuation plaque (LAP) was defined as the presence of at least one voxel less than 30 HU in the center of the plaque, and non-LAP was defined as the absence of a voxel less than 30 HU. CCTA = coronary CT angiography, NIRS-IVUS = near-infrared spectroscopy intravascular US.
Distribution of maximum 4-mm lipid core burden index (maxLCBI4mm) in
low-attenuation plaque (LAPs) and non-LAPs with an echolucent zone or echo
attenuation or both. The boxes represent the IQR (25th–75th
percentile), and the horizontal line inside the boxes represents the median
value of each parameter. The whiskers represent the minimum and maximum
values.
Figure 2:
Distribution of maximum 4-mm lipid core burden index (maxLCBI4mm) in low-attenuation plaque (LAPs) and non-LAPs with an echolucent zone or echo attenuation or both. The boxes represent the IQR (25th–75th percentile), and the horizontal line inside the boxes represents the median value of each parameter. The whiskers represent the minimum and maximum values.
Graph shows low-attenuation plaque (LAP) burden at coronary CT
angiography according to the number of high-risk features derived from
near-infrared spectroscopy intravascular US (NIRS-IVUS). High-risk features
at NIRS-IVUS included an echolucent zone, echo attenuation, and maximum 4-mm
lipid core burden index greater than 400. LAP burden was calculated as
follows: (LAP volume/vessel volume) × 100%.
Figure 3:
Graph shows low-attenuation plaque (LAP) burden at coronary CT angiography according to the number of high-risk features derived from near-infrared spectroscopy intravascular US (NIRS-IVUS). High-risk features at NIRS-IVUS included an echolucent zone, echo attenuation, and maximum 4-mm lipid core burden index greater than 400. LAP burden was calculated as follows: (LAP volume/vessel volume) × 100%.
Images show an example of low-attenuation plaques (LAPs) with a
near-infrared spectroscopy intravascular US–derived high-risk
feature. (A) On curved planar reformatted coronary CT angiograms, high-grade
stenosis is shown in the proximal left circumflex coronary artery. An LAP is
indicated in the right image with color-coded overlays. (B) On magnified
three-dimensional view, a small LAP is present (orange region). (C)
Near-infrared spectroscopy chemogram shows low maximum 4-mm lipid core
burden index (maxLCBI4mm) value of 2. (D) Gray-scale intravascular US
cross-sectional view shows an echolucent zone (arrowheads).
Figure 4:
Images show an example of low-attenuation plaques (LAPs) with a near-infrared spectroscopy intravascular US–derived high-risk feature. (A) On curved planar reformatted coronary CT angiograms, high-grade stenosis is shown in the proximal left circumflex coronary artery. An LAP is indicated in the right image with color-coded overlays. (B) On magnified three-dimensional view, a small LAP is present (orange region). (C) Near-infrared spectroscopy chemogram shows low maximum 4-mm lipid core burden index (maxLCBI4mm) value of 2. (D) Gray-scale intravascular US cross-sectional view shows an echolucent zone (arrowheads).
Images show an example of low-attenuation plaques (LAPs) with multiple
near-infrared spectroscopy intravascular US–derived high-risk
features. (A) On curved planar reformatted coronary CT angiograms, the left
circumflex coronary artery is subtotally occluded with a large mixed plaque.
Image on the right with color-coded overlays shows the automated
segmentation of the LAP (orange region). (B) Enlarged three-dimensional view
shows large LAP clusters. (C) Near-infrared spectroscopy chemogram shows the
plaque as lipid-rich, with a high maximum lipid core burden index at 4-mm
segment (maxLCBI4mm) value of 880. (D) Gray-scale intravascular US
cross-sectional view demonstrates extensive echo attenuation (arrows) and an
echolucent zone (arrowhead).
Figure 5:
Images show an example of low-attenuation plaques (LAPs) with multiple near-infrared spectroscopy intravascular US–derived high-risk features. (A) On curved planar reformatted coronary CT angiograms, the left circumflex coronary artery is subtotally occluded with a large mixed plaque. Image on the right with color-coded overlays shows the automated segmentation of the LAP (orange region). (B) Enlarged three-dimensional view shows large LAP clusters. (C) Near-infrared spectroscopy chemogram shows the plaque as lipid-rich, with a high maximum lipid core burden index at 4-mm segment (maxLCBI4mm) value of 880. (D) Gray-scale intravascular US cross-sectional view demonstrates extensive echo attenuation (arrows) and an echolucent zone (arrowhead).
Areas under the receiver operating characteristic curve (AUCs) show
the diagnostic performance for identification of near-infrared spectroscopy
intravascular US (NIRS-IVUS)–verified high-risk plaques. High-risk
plaque was defined as a plaque with at least one of the following
NIRS-IVUS–derived high-risk features: maximum 4-mm lipid core burden
index greater than 400, an echolucent zone, and echo attenuation. Plaque
attenuation was quantified by measuring the minimum Hounsfield units at the
center of a plaque. Voxels with less than 30 HU at the center of the plaque
were considered to be low-attenuation plaques (LAPs), and their volume was
calculated. LAP burden was determined as the ratio of LAP volume to vessel
volume, multiplied by 100 (%).
Figure 6:
Areas under the receiver operating characteristic curve (AUCs) show the diagnostic performance for identification of near-infrared spectroscopy intravascular US (NIRS-IVUS)–verified high-risk plaques. High-risk plaque was defined as a plaque with at least one of the following NIRS-IVUS–derived high-risk features: maximum 4-mm lipid core burden index greater than 400, an echolucent zone, and echo attenuation. Plaque attenuation was quantified by measuring the minimum Hounsfield units at the center of a plaque. Voxels with less than 30 HU at the center of the plaque were considered to be low-attenuation plaques (LAPs), and their volume was calculated. LAP burden was determined as the ratio of LAP volume to vessel volume, multiplied by 100 (%).

References

    1. Maurovich-Horvat P , Ferencik M , Voros S , Merkely B , Hoffmann U . Comprehensive plaque assessment by coronary CT angiography . Nat Rev Cardiol 2014. ; 11 ( 7 ): 390 – 402 . - PubMed
    1. Shaw LJ , Blankstein R , Bax JJ , et al. . Society of Cardiovascular Computed Tomography / North American Society of Cardiovascular Imaging - expert consensus document on coronary CT imaging of atherosclerotic plaque . J Cardiovasc Comput Tomogr 2021. ; 15 ( 2 ): 93 – 109 . - PubMed
    1. Motoyama S , Sarai M , Harigaya H , et al. . Computed tomographic angiography characteristics of atherosclerotic plaques subsequently resulting in acute coronary syndrome . J Am Coll Cardiol 2009. ; 54 ( 1 ): 49 – 57 . - PubMed
    1. Maroules CD , Hamilton-Craig C , Branch K , et al. . Coronary artery disease reporting and data system (CAD-RADS™): Inter-observer agreement for assessment categories and modifiers . J Cardiovasc Comput Tomogr 2018. ; 12 ( 2 ): 125 – 130 . - PubMed
    1. Williams MC , Moss AJ , Dweck M , et al. . Coronary artery plaque characteristics associated with adverse outcomes in the SCOT-HEART Study . J Am Coll Cardiol 2019. ; 73 ( 3 ): 291 – 301 . - PMC - PubMed