. 2023 Sep 25;13(15):5207-5222.
doi: 10.7150/thno.89033. eCollection 2023.

Upregulated FOXM1 stimulates chondrocyte senescence in Acot12-/-Nudt7-/- double knockout mice

Affiliations

Upregulated FOXM1 stimulates chondrocyte senescence in Acot12-/-Nudt7-/- double knockout mice

Jinsoo Song et al. Theranostics. .

Abstract

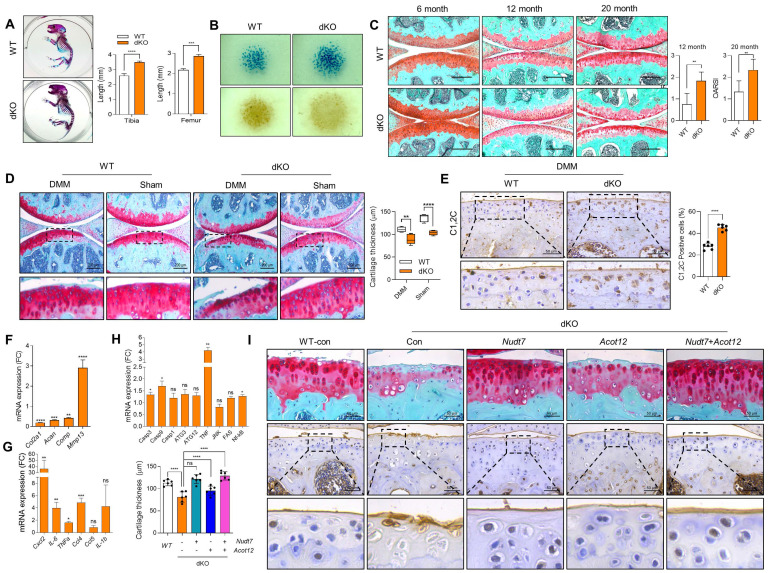
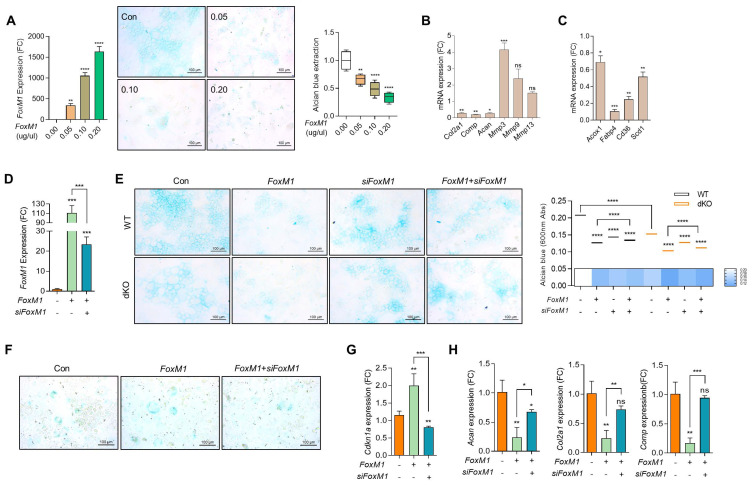
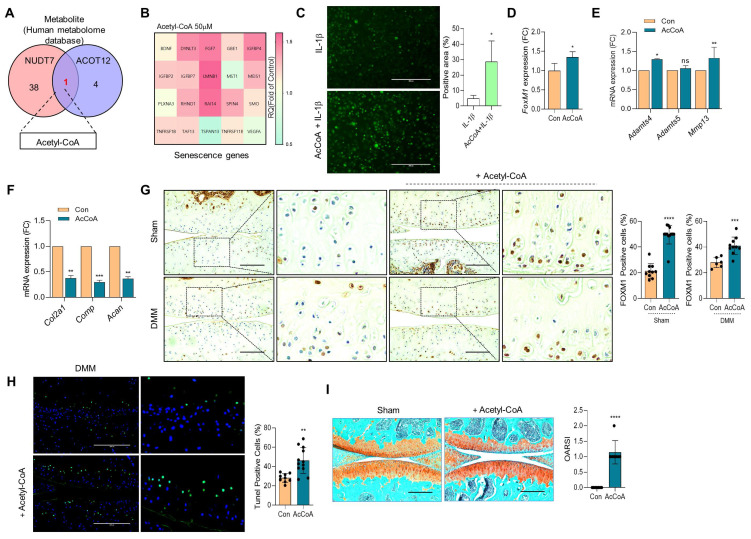
Rationale: One of the hallmarks of osteoarthritis (OA), the most common degenerative joint disease, is increased numbers of senescent chondrocytes. Targeting senescent chondrocytes or signaling mechanisms leading to senescence could be a promising new therapeutic approach for OA treatment. However, understanding the key targets and links between chondrocyte senescence and OA remains unclear. Methods: Senescent chondrocytes were identified from Nudt7-/-, Acot12-/-, double-knockout mice lacking Acot12 and Nudt7 (dKO) and applied to microarray. The presence of forkhead transcription factor M1 (FOXM1) was detected in aged, dKO, and destabilization of the medial meniscus (DMM) cartilages and articular chondrocytes, and the effect of FoxM1 overexpression and acetyl-CoA treatment on cartilage homeostasis was examined using immunohistochemistry, quantitative real-time PCR (qRT-PCR), cell apoptosis and proliferation assay, and safranin O staining. Delivery of Rho@PAA-MnO2 (MnO2 nanosheet) or heparin-ACBP/COS-GA-siFoxM1 (ACBP-siFoxM1) nanoparticles into DMM cartilage was performed. Results: Here, we propose the specific capture of acetyl-CoA with the delivery of (FoxM1 siRNA (siFoxM1) to prevent cartilage degradation by inhibiting the axis of chondrocyte senescence. dKO stimulate chondrocyte senescence via the upregulation of FoxM1 and contribute to severe cartilage breakdown. We found that the accumulation of acetyl-CoA in the dKO mice may be responsible for the upregulation of FoxM1 during OA pathogenesis. Moreover, scavenging reactive oxygen species (ROS) induced by chondrocyte senescence via the implantation of MnO2 nanosheets or delivery of siFoxM1 functionalized with acetyl-CoA binding protein (ACBP) to capture acetyl-CoA using an injectable bioactive nanoparticle (siFoxM1-ACBP-NP) significantly suppressed DMM-induced cartilage destruction. Conclusion: We found that the loss of Acot12 and Nudt7 stimulates chondrocyte senescence via the upregulation of FoxM1 and accumulation of acetyl-CoA, and the application of siFoxM1-ACBP-NP is a potential therapeutic strategy for OA treatment.

Keywords: FoxM1; Acot12-/-Nudt7-/-; Rho@PAA-MnO2; heparin-ACBP/COS-GA-siFoxM1; osteoarthritis.


Conflict of interest statement

Competing Interests: The authors have declared that no competing interest exists.

Figures

Figure 1
Figure 1
Musculoskeletal and cartilage homeostasis in dKO mice. (A) Alizarin red/Alcian blue staining of WT and dKO newborn mice (n = 4 per group). (B) PNA and Alcian blue staining of micromass cultures of WT and dKO limb mesenchymal cells. (C) Safranin O staining of cartilage of 6-, 12-, and 20-month-old WT and dKO mice. The degree of cartilage degradation is quantified according to the OARSI grade. Scale bar = 200 μm. (D) Safranin O staining of DMM cartilage of WT and dKO mice. Cartilage thickness was measured (n = 5 per group). Scale bar = 200 μm. (E) Immunohistochemistry of C1,2C in WT and dKO DMM cartilage at eight weeks post-surgery (n = 4 per group). (F-H) Expression level of catabolic and anabolic genes in maintaining cartilage homeostasis with WT and dKO DMM cartilage (n = 3 per group). (I) Safranin O staining and immunohistochemistry of C1,2C in WT, or dKO cartilage with or without restoration of lenti-HA-Nudt7, -Acot12, or both. cartilage thickness was measured. Scale bar = 50 μm. *P < 0.05; **P < 0.01; *** P < 0.001; **** P < 0.0001.
Figure 2
Figure 2
Chondrocyte senescence in dKO cartilage. (A) Heatmap analysis of microarray data from WT, Nudt7-/-, Acot12-/-, and dKO iMACs. (B) Common pathways analysis of microarray data. (C) SA-β-gal staining of passage 2 and passage 4 iMACs isolated from WT, Nudt7-/-, Acot12-/-, and dKO embryos. (D) Transcriptional level of SASP and senescence score signature genes in WT and dKO cartilage.
Figure 3
Figure 3
FoxM1 in aged, dKO, and DMM cartilages. (A) Ven diagram of significantly altered genes from microarray data of Nudt7-/-, Acot12-/-, and dKO iMACs compared to WT iMACs. (B) Ven diagram of significantly altered genes from microarray data of dKO iMACs compared to those from human OA patent sequencing data. (C) Transcriptional level of FoxM1 in passaged (P1, P2) WT and dKO iMACs (n = 3 per group). (D) Immunohistochemistry of FOXM1 in DMM cartilage of WT and dKO mice (n = 5). FOXM1-positive cell numbers are indicated by dot graph. (E) Immunohistochemistry of FOXM1 in 12-month-old WT, Nudt7-/-, Acot12-/-, and dKO cartilage (n = 4 per group). FOXM1-positive cell number were indicated by bar-dot graph. (F) Transcriptional level of FoxM1 in normal and OA patient chondrocytes (n = 8 in normal, n = 12 in OA). (G) Immunohistochemistry of FOXM1 in normal and OA patient cartilage (n = 5 per group). FOXM1-positive cell numbers were indicated by dot graph. *** P < 0.001; **** P < 0.0001.
Figure 4
Figure 4
FoxM1 stimulates chondrocyte senescence. (A) RT-PCR with dose-dependent introduction of pcDNA-FoxM1 (left panel), Alcian blue staining (middle panel), Quantification of Alcian blue staining (right panel) (n = 4 per group). FoxM1 were introduced into iMACs. (B) Transcriptional levels of cartilage matrix and cartilage degrading genes. (C) Transcriptional levels of genes in lipid metabolism in FoxM1-overexpressed iMACs (n = 3 per group). (D) Transcriptional level of FoxM1 (n = 3 per group). (E) Alcian blue staining in WT and dKO iMACs transfected with FoxM1, siFoxM1, or both (n = 4 per group). Quantification of Alcian blue staining extracted with 6M Guanidine-HCl was measured at a 650 nm absorbance. (F) SA-β-gal staining (n = 3 per group). G) Expression level of Cdkn1a (n = 4 per group). (H) Expression level of cartilage matrix genes (n = 3 per group).
Figure 5
Figure 5
FoxM1 overexpression exacerbates cartilage degradation. (A) Transcriptional level of Col2a1 and Acan with introduction of FoxM1 in the absence or presence of IL-β (n = 3 per group). (B) Apoptotic cell death with introduction of FoxM1 in the absence or presence of IL-β (n = 3 per group). (C) Safranin-O staining and immunohistochemistry of FOXM1, MMP13, C1,2C, and Neopeptide in DMM cartilage of WT and dKO mice infected with FoxM1- or siFoxM1-lentivirus (n = 6-9 per group). Positive cell numbers are indicated by bar-dot graph. *P < 0.05; **P < 0.01; *** P < 0.001.
Figure 6
Figure 6
Acetyl-CoA induces FoxM1 and increases chondrocyte senescence. (A) Metabolite analysis from human metabolome database. 50 μM Acetyl-CoA were exposed into iMACs. (B) Senescence genes signature, (C) Senescence-induced ROS level (n = 4), (D) Expression level of FoxM1, (E) Expression level of cartilage degrading genes, (F) Expression level of cartilage matrix genes (n = 3). (G) Immunohistochemistry of FOXM1 in DMM cartilage with or without introduction of Acetyl-CoA (n = 6-12 per group). FOXM1-postive cell numbers are indicated by the bar dot graph. (H) Tunel assay in DMM cartilage with or without introduction of Acetyl-CoA (n = 9-12). (I) Safranin-O staining of DMM cartilage with or without introduction of Acetyl-CoA (n = 7). The degree of cartilage degradation is quantified according to OARSI grade. Scale bar = 200 μm. *P < 0.05; **P < 0.01; *** P < 0.001, **** P < 0.0001.
Figure 7
Figure 7
Cellular senescence detection by Rho-PAA-MnO2 sensor. (A) Scheme of a ROS-responsive fluorescence off-on system with Rho-PAA-MnO2 sensor. (B) Particle size of Rho@PAA-MnO2 (0.5% and 1%) after treatment with 1mM H2O2 for 30 min obtained by dynamic light scattering spectrometry (DLS). (C) Photoluminescence spectra of Rho@PAA-MnO2 (0.5% and 1%) after treatment with 1mM H2O2. (D) IVIS images of six-month-old WT, Nudt7-/-, Acot12-/-, and dKO mice implanted with senescence sensor into cartilage. (E-I) Preparation and characterizations of COS-GA/siFoxM1 and COS-GA/Hep/ACBP complexes. (E) Synthesis and chemical structures of COS-GA. (F) 1H NMR and (G) UV-Vis spectra of COS-GA. (H) Preparation of COS-GA/siFoxM1 complexes. SEM (first) and AFM (second and third) images of COS-GA/siFoxM1 complexes. (I) Preparation of COS-GA/Hep/ACBP complexes. SEM (first) and AFM (second and third) images of COS-GA/Hep/ACBP complexes.
Figure 8
Figure 8
Delivery of Rho@PAA-MnO2 (MnO2 nanosheet) significantly reduces cartilage degradation. (A) IVIS images of sham and DMM cartilage implanted with senescence sensor. (B) Safranin-O staining in DMM cartilage implanted with MnO2 nanosheet for eight weeks compared to sham cartilage (n = 4 per group). The degree of cartilage degradation is quantified according to the OARSI grade. Scale bar = 200 μm. Immunohistochemistry of P16ink4a and FOXM1 in DMM cartilage (n = 4 per group). Positive cell numbers are indicated by the bar graph. *P < 0.05; **P < 0.01; *** P < 0.001, **** P < 0.0001.
Figure 9
Figure 9
Delivery of heparin-ACBP/COS-GA-siFoxM1 (ACBP-siFoxM1) nanoparticles significantly reduces cartilage degradation. (A) IVIS images of DMM cartilage introduced with ACBP-siFoxM1 nanoparticles compared to sham cartilage. (B) Safranin-O staining in DMM cartilage introduced with ACBP-siFoxM1 nanoparticles for eight weeks compared to sham cartilage (n = 4 per group). The degree of cartilage degradation is quantified according to the OARSI grade. Scale bar = 200 μm. Immunohistochemistry of FOXM1 in DMM cartilage (n = 4 per group). FOXM1-positive-cell numbers are indicated by the bar graph. *P < 0.05; **P < 0.01; *** P < 0.001, **** P < 0.0001.

References

    1. Martel-Pelletier J, Barr AJ, Cicuttini FM, Conaghan PG, Cooper C, Goldring MB. et al. Osteoarthritis. Nat Rev Dis Primers. 2016;2:16072. - PubMed
    1. L J Sandell, T Aigner. Articular cartilage and changes in arthritis. an introduction: cell biology of osteoarthritis. Arthritis Res. 2001;3:107–13. - PMC - PubMed
    1. Kolasinski SL, Neogi T, Hochberg MC, Oatis C, Guyatt G, Block J. et al. 2019 American college of rheumatology/arthritis foundation guideline for the management of osteoarthritis of the hand, hip, and knee. Arthritis Care Res. 2020;72:149–62. - PMC - PubMed
    1. Price JS, Waters JG, Darrah C, Pennington C, Edwards DR, Donell ST. et al. The role of chondrocyte senescence in osteoarthritis. Aging Cell. 2002;1:57–65. - PubMed
    1. Rim YA, Nam Y, Ju JH. The role of chondrocyte hypertrophy and senescence in osteoarthritis initiation and progression. Int J Mol Sci. 2020;21:2358. - PMC - PubMed

Publication types