. 2023 Oct 16:14:1248575.
doi: 10.3389/fendo.2023.1248575. eCollection 2023.

Metabolism of pancreatic neuroendocrine tumors: what can omics tell us?

Affiliations

Metabolism of pancreatic neuroendocrine tumors: what can omics tell us?

Arnaud Jannin et al. Front Endocrinol (Lausanne). .

Abstract

Introduction: Reprogramming of cellular metabolism is now a hallmark of tumorigenesis. In recent years, research on pancreatic neuroendocrine tumors (pNETs) has focused on genetic and epigenetic modifications and related signaling pathways, but few studies have been devoted to characterizing the metabolic profile of these tumors. In this review, we thoroughly investigate the metabolic pathways in pNETs by analyzing the transcriptomic and metabolomic data available in the literature.

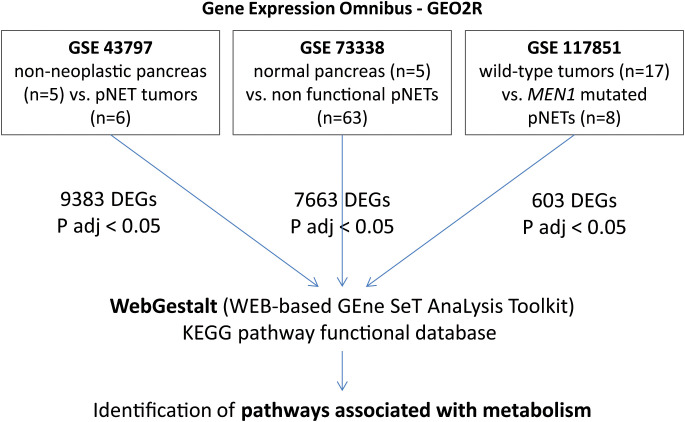
Methodology: We retrieved and downloaded gene expression profiles from all publicly available gene set enrichments (GSE43797, GSE73338, and GSE117851) to compare the differences in expressed genes based on both the stage and MEN1 mutational status. In addition, we conducted a systematic review of metabolomic data in NETs.

Results: By combining transcriptomic and metabolomic approaches, we have identified a distinctive metabolism in pNETs compared with controls without pNETs. Our analysis showed dysregulations in the one-carbon, glutathione, and polyamine metabolisms, fatty acid biosynthesis, and branched-chain amino acid catabolism, which supply the tricarboxylic acid cycle. These targets are implicated in pNET cell proliferation and metastasis and could also have a prognostic impact. When analyzing the profiles of patients with or without metastasis, or with or without MEN1 mutation, we observed only a few differences due to the scarcity of published clinical data in the existing research. Consequently, further studies are now necessary to validate our data and investigate these potential targets as biomarkers or therapeutic solutions, with a specific focus on pNETs.

Keywords: MEN1; integrative biology; metabolism; metabolomic; metastasis; pancreatic neuroendocrine tumors; transcriptomic.


Conflict of interest statement

The authors declare that the research was conducted in the absence of any commercial or financial relationships that could be construed as a potential conflict of interest.

Figures

Figure 1
Figure 1
GSEA and WebGestalt analysis methodology. In GSE43797, mRNA expression in pNETs (n = 6) and non-neoplastic pancreatic tissues (n = 5). In GSE73338, we selected 63 non-functional pNETs and 5 normal pancreas samples. In GSE117851, among 47 pNET tumor specimens, 8 presented with MEN1 mutation and 17 were wild-type. Only DEGs with an adjusted p-value < 0.05 were included. GSEA, gene set enrichment analysis; pNETs, pancreatic neuroendocrine tumors; DEGs, differentially expressed genes; ADJ, adjusted; MEN1, multiple endocrine neoplasia type 1.
Figure 2
Figure 2
Gene set enrichment analysis (GSEA) from patients with non-neoplastic pancreas vs. well-differentiated and non-functional primitive pancreatic neuroendocrine tumors (GSE43797). (A) Volcano plot of DEGs (log2 fold change). Adjusted p-value < 0.05. (B) GSEA of DEGs using the WebGestalt tool. (C) Major enrichment GO plots corresponding to metabolism-associated KEGG term. GSEA, gene set enrichment analysis; DEGs, differentially expressed genes; GO, Gene Ontology; KEGG, Kyoto Encyclopedia of Genes and Genomes.
Figure 3
Figure 3
Gene set enrichment analysis (GSEA) from patients without pancreatic lesions compared with patients with well-differentiated and non-functional primitive pancreatic neuroendocrine tumors (GSE73338). (A) Volcano plot of DEGs (log2 fold change). Adjusted p-value < 0.05. (B) GSEA of DEGs using the WebGestalt tool. (C) Major enrichment GO plots corresponding to metabolism-associated KEGG term. GSEA, gene set enrichment analysis; DEGs, differentially expressed genes; GO, Gene Ontology; KEGG, Kyoto Encyclopedia of Genes and Genomes.
Figure 4
Figure 4
Gene set enrichment analysis (GSEA) from patients without metastasis. Well-differentiated, non-functional pNETs compared with metastatic non-functional pNETs (GSE73338). (A) Volcano plot of DEGs (log2 fold change). Adjusted p-value < 0.05. (B) GSEA of DEGs using the WebGestalt tool. DEGs, differentially expressed genes.
Figure 5
Figure 5
GSEA comparing pNET wild-type patients with NEM1-mutated pNET patients. Gene set enrichment analysis (GSEA) from patients with wild-type, well-differentiated, and non-functional primitive pNETs compared with NEM-mutated patients (GSE117851). (A) Volcano plot of DEGs (log2 fold change). Adjusted p-value < 0.05. (B) GSEA of DEGs using the WebGestalt tool. (C) Major enrichment GO plots corresponding to metabolism-associated KEGG term. GSEA, gene set enrichment analysis; DEGs, differentially expressed genes; GO, Gene Ontology; KEGG, Kyoto Encyclopedia of Genes and Genomes.
Figure 6
Figure 6
Schematic overview of pNET metabolism after integrative biology analysis. Color codes are defined as follows: green, enzymes or transporters implicated in pNET metabolism; blue, metabolites; yellow, metabolic pathway; red boxes, signaling pathways; black boxes, functional cellular mechanisms. 3PG, 3-phosphoglycerate; AOX1, aldehyde oxidase 1; AMT, aminomethyltransferase; ACLY, ATP citrate lyase; AACS, acetoacetyl-CoA-synthetase; ACADS, acyl-CoA dehydrogenase short chain; ACADSB, acyl-CoA dehydrogenase short/branched chain; ACAD8, acyl-CoA dehydrogenase family member 8; ATF4, activating transcription factor 4; BCAT1, branched chain amino acid transaminase 1; BCKDHs, branched chain keto acid dehydrogenase; CBS, cystathionine beta-synthase; CHAC1, ChaC glutathione specific gamma-glutamylcyclotransferase 1; CTH, cystathionine gamma-lyase; CPT1C, carnitine palmitoyltransferase 1C; ELOVLs, elongation of very long-chain fatty acid proteins; FADS2, fatty acid desaturase 2; GAMT, guanidinoacetate N-methyltransferase; GATM, glycine amidinotransferase; GLUT1, glucose transporter 1; GSS, glutathione synthetase; GSTA1,2, 5, glutathione S-transferase alpha 1,2,5; HACD1, 3-hydroxyacyl-CoA dehydratase 1; IDH3, isocitrate dehydrogenase 3; MCCC2, methylcrotonyl-CoA carboxylase subunit 2; MDH2, malate dehydrogenase 2; MTRR, 5-methyltetrahydrofolate-homocysteine methyltransferase reductase; mTOR, mechanistic target of rapamycin; MUFAs, monounsaturated fatty acids; NADPH, nicotinamide adenine dinucleotide phosphate; OGDHL, oxoglutarate dehydrogenase L; PHGDH, phosphoglycerate dehydrogenase; PUFAs, polyunsaturated fatty acids; ROS, reactive oxygen species; SAM, S-adenosyl methione; dcSAM, decarboxylated SAM; SAH, S-adenosylhomocysteine; SFA, saturated fatty acid; SHMT1, serine hydroxymethyltransferase 1.

References

    1. Warburg O. On the origin of cancer cells. Science (1956) 123(3191):309–14. doi: 10.1126/science.123.3191.309 - DOI - PubMed
    1. Hanahan D, Weinberg RA. Hallmarks of cancer: the next generation. Cell (2011) 144(5):646–74. doi: 10.1016/j.cell.2011.02.013 - DOI - PubMed
    1. Hanahan D. Hallmarks of cancer: new dimensions. Cancer Discov (2022) 12(1):31–46. doi: 10.1158/2159-8290.CD-21-1059 - DOI - PubMed
    1. Wettersten HI, Aboud OA, Lara PN, Weiss RH. Metabolic reprogramming in clear cell renal cell carcinoma. Nat Rev Nephrol (2017) 13(7):410–9. doi: 10.1038/nrneph.2017.59 - DOI - PubMed
    1. Bergers G, Fendt SM. The metabolism of cancer cells during metastasis. Nat Rev Cancer (2021) 21(3):162–80. doi: 10.1038/s41568-020-00320-2 - DOI - PMC - PubMed

Publication types

LinkOut - more resources