. 2024 Jan 3;112(1):124-140.e6.
doi: 10.1016/j.neuron.2023.10.001. Epub 2023 Oct 30.

Localized APP expression results in progressive network dysfunction by disorganizing spike timing

Affiliations

Localized APP expression results in progressive network dysfunction by disorganizing spike timing

Silvia Viana da Silva et al. Neuron. .

Abstract

Progressive cognitive decline in Alzheimer's disease could either be caused by a spreading molecular pathology or by an initially focal pathology that causes aberrant neuronal activity in a larger network. To distinguish between these possibilities, we generated a mouse model with expression of mutant human amyloid precursor protein (APP) in only hippocampal CA3 cells. We found that performance in a hippocampus-dependent memory task was impaired in young adult and aged mutant mice. In both age groups, we then recorded from the CA1 region, which receives inputs from APP-expressing CA3 cells. We observed that theta oscillation frequency in CA1 was reduced along with disrupted relative timing of principal cells. Highly localized pathology limited to the presynaptic CA3 cells is thus sufficient to cause aberrant firing patterns in postsynaptic neuronal networks, which indicates that disease progression is not only from spreading pathology but also mediated by progressively advancing physiological dysfunction.

Keywords: Alzheimer’s disease; amyloid precursor protein; hippocampus; phase precession; spike timing; theta oscillations.


Conflict of interest statement

Declaration of interests The authors declare no competing interests.

Figures
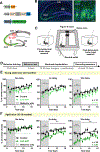
Figure 1.
Figure 1.. Hippocampus-dependent memory was impaired in CA3-APP mice.
A. CA3-APP mice carried three transgenes: (i) Cre-recombinase under the regulation of the Grik4 promoter for CA3 specificity, (ii) a tetracycline-controlled transactivator protein (tTA) transgene under the control of Cre-LoxP recombination and (iii) the hAPP mutant gene under the control of a tetracycline-responsive promoter element (TRE). LTP of Schaffer-collateral inputs to CA1 is impaired in CA3-APP mice starting at 4 months of age. B. Example immunostaining of a section from an aged CA3-APP mouse in which recordings were taken in the same hemisphere. Anti-hAPP (6E10 antibody), green; DAPI, blue. Scale bars are 0.5 mm (left) and 20 μm (right). C. Recording paradigm included 30 laps in the figure-8 maze, preceded and followed by a 10–15 min baseline session in the home cage. D. Experimental timeline. E. Behavioral performance over experimental days for young adult CA3-APP mice (n = 16) and littermate controls (n = 17). During the initial 5 days of behavior testing with delays, there was a reduction in correct choices by CA3-APP mice compared to age-matched controls (two-way RM ANOVA, p = 0.020 and 0.0007 for 2-s and 10-s delay, Sidak’s post-hoc test). This difference was not observed on subsequent recording days (two-way RM ANOVA, p = 0.058 and 0.079 for 2-s and 10-s delay, Sidak’s post-hoc test; see Figure S1F and G). Performance improved over time in each delay condition (see linear regression analysis in Table S2) for both experimental groups. F. Behavioral performance over experimental days for aged CA3-APP mice (n = 20) and littermate controls (n = 20). In the delayed versions of the task, CA3-APP mice made fewer correct choices than age-matched controls, both during the initial 5 days of testing (two-way RM ANOVA, p = 0.001 and p < 0.0001 for 2-s and 10-s delay, Sidak’s post-hoc test) and during the recording period (two-way RM ANOVA, p = 0.0008 and p < 0.0001 for 2-s and 10-s delay, Sidak’s post-hoc test; see Figure S1H and I). The performance of all experimental mice improved over time in all delay conditions (see linear regression analyses in Table S2). * p < 0.05, ** p < 0.01, *** p < 0.001.
Figure 2.
Figure 2.. Firing rates of CA1 principal cells were reduced in CA3-APP mice.
A. Schematics of recordings from putative principal cells (see Figure S2C for classification). Young adult mice, upper panel; aged mice, lower panel. B. Cumulative distribution of average firing rate of all putative CA1 principal cells during the entire recording session (home cage and behavior). CA1 principal cells of CA3-APP mice had reduced firing rates compared to age-matched control mice (young adult: p = 0.0048; aged: p = 0.0006, MW test). The inset shows the same data per mouse (young adult: p = 0.45; aged: p = 0.041, two-sample t-test). C. Percentage of cells active during the figure-8 task did not differ between CA3-APP mice and age-matched controls. D. Cumulative distribution of average firing rate of putative interneurons during the entire recording session. Average firing rates of CA1 interneurons did not differ between CA3-APP mice and age-matched controls (young adult: p = 0.084, two-sample t-test; aged: p = 0.36, MW test). The inset graph shows the same data plotted per mouse (young adult: p = 0.71; aged: p = 0.94, two-sample t-tests). E. The speed score of interneurons, calculated using periods of mobility in the maze, was reduced in both young adult and aged CA3-APP mice compared to age-matched controls (young adult: p < 0.0001; aged: p = 0.0024, two-sample t-tests). Interneurons in young adult, but not in aged CA3-APP mice retained some speed modulation (p < 0.0001 and p = 0.67, Wilcoxon signed rank tests). Horizontal lines depict the mean of all cells in a group, and open circles the mean per mouse. All statistics are reported in Tables S3 and S4.
Figure 3
Figure 3. CA1 place code remained accurate in CA3-APP mice.
A. Left top: Example of mouse path (black) and parsing of figure-8 maze into sub-sections. Direction of movement is depicted by arrows. Right top: Example of a place cell recorded while the mouse ran in the maze. Spike density in two-dimensional space is averaged over all laps and shown as a color-coded map. Bottom: Place cell firing is shown separately for each lap in linearized, color-coded maps (76 bins of 2.5 cm). B. Average linearized rate maps for all CA1 place cells recorded in the four experimental groups. Left-turn and right-turn trials are shown separately. Cells are ordered by the location of the bin with the highest firing rate. In the vertical bar to the right of each panel, cells of each individual mouse are assigned a color to show the distribution across mice. C. Left: % CA1 principal cells with place fields. Dots represent the same data per mouse. Right: Example linearized rate maps of place cells from a young adult (top) and from an aged CA3-APP mouse (bottom). D. Peak firing rates of CA1 place cells were reduced in young adult and aged CA3-APP mice compared to age-matched controls (young adult: p = 0.0065; aged: p = 0.001, MW test). In aged mice, significance was also reached when data was analyzed per mouse (indicated by #, p = 0.0032, n = 7 for control and 8 for CA3-APP mice). E. Information content of place cells from CA3-APP mice did not differ from age-matched control mice. F. The number of place fields per place cell was slightly lower in CA3-APP compared to age-matched control mice (young adult: p = 0.028; aged: p = 0.0083, MW test). For cells from aged CA3-APP mice compared to age-matched controls, the significance was also reached when data was analyzed per mouse (represented by #, p = 0.0057, n = 7 for control and 8 for CA3-APP mice). G. Place field size of CA1 place cells from aged CA3-APP mice was smaller than from cells of age-matched controls (p < 0.0001, MW test). In young adult CA3-APP mice the difference was not significant (p = 0.82, MW test). H. Stability of place cells firing was analyzed by a lap-by-lap correlation across location bins. A small reduction in stability was found in aged CA3-APP mice compared to age-matched control mice (p = 0.015, MW test), but no difference was observed in young adult mice (p = 0.57, MW test). For D-H, bar graphs represent the data per cell, and black dots represent the average per mouse. Error bars correspond to SEM for the cell-wise analysis. All statistics are reported in Table S6.
Figure 4.
Figure 4.. Theta and gamma oscillation frequencies were reduced in young adult and aged CA3-APP mice.
A. Average CA1 LFP spectrograms of young adult CA3-APP and control mice. The plot at the bottom of each panel shows the running speed of mice across different sub-sections of a lap in the figure-8 maze. Young adult CA3-APP mice (n = 15 mice) showed no difference in running speed compared to age-matched controls (n = 12 mice) in any of the maze sub-sections (Figure S6C). B. Quantification of frequency in different LFP bands. Quantification is shown for the center arm (including stem and choice point). Analyses for other maze sections are provided in Figure S5 and Table S7 and generally follow the same pattern. The theta and high gamma frequencies (p = 0.037 and 0.0062, MW test adjusted for multiple comparisons by Holm-Šídák method) of young adult CA3-APP mice were reduced compared to age-matched controls. C. Quantification of CA1 LFP power in different frequency bands. We found no differences between young adult CA3-APP mice and their age-matched controls. D. Average CA1 LFP spectrograms of aged CA3-APP and control mice. Aged CA3-APP mice showed a small reduction in running speed compared to age-matched controls (n = 10 for control and n = 14 for CA3-APP mice) in only the choice and reward sections of the maze (Figure S6D). Data are displayed as in A. E. Similar to young adult mice, aged CA3-APP mice showed a reduction in theta and high-gamma oscillation frequencies compared to age-matched controls (p = 0.00014 and p = 0.042, MW test adjusted for multiple comparisons by Holm-Šídák method). Data are displayed as in B. Detailed controls for running speed are presented in Figure S6, Tables S8 and S9. F. Power in the beta band was decreased in aged CA3-APP mice compared to controls (p = 0.043, MW test adjusted for multiple comparisons by Holm-Šídák method). Data are displayed as in C. This difference is only found in the choice zone (see Figure S5G for by-section analysis).
Figure 5.
Figure 5.. Spike oscillation frequency of CA1 principal cells and interneurons was reduced in CA3-APP mice.
A. For each neuron we calculated the spike-time autocorrelation and then used FFT analyses to obtain the predominant spike oscillation frequency. The distribution of the peak oscillation frequencies is plotted against the amplitude of their theta modulation (i.e., theta modulation index). Only cells with a detectable peak within the theta band are displayed, and the dashed line represents the median of their frequency distribution. Mean LFP frequency of the sessions in which cells were recorded, solid black line. Spike oscillation frequencies of CA1 principal cells were lower in young adult CA3-APP mice than in age-matched controls (n = 488 and 481 cells in CA3-APP and control mice, p < 0.0001, MW test). B. Average theta modulation amplitude (theta modulation index) of all active CA1 principal cells. There was no difference between young adult CA3-APP mice compared to age-matched controls (n = 554 and 561 cells, p = 0.17, MW test). C. In young adult CA3-APP mice, there were no interneurons with high spike oscillation frequencies, which resulted in a different distribution than in young adult controls (n = 34 and 39 cells, p = 0.0024, MW test). Data are displayed as in A. D. Theta modulation amplitude of CA1 interneurons was reduced in young adult CA3-APP compared to age-matched control mice (n = 60 and 90 cells, p = 0.0039, MW test). E. When compared to age-matched controls, CA1 principal cells from aged CA3-APP mice showed a major reduction in the spike oscillation frequency with a large fraction of cells oscillating between 7 and 8 Hz (n = 484 and 452 cells in CA3-APP and control mice, p < 0.0001, MW test). Data are displayed as in A. F. Theta modulation amplitude of CA1 principal cells of aged CA3-APP mice did not differ from age-matched controls (n = 527 and 499 cells, p = 0.46, MW test). G. When compared to controls, CA1 interneurons from aged CA3-APP mice showed reduced spike oscillation frequencies, with >20% of interneurons now oscillating below the LFP frequency (n = 47 and 28 cells in CA3-APP and control mice, p = 0.029, MW test). Data are displayed as in A. H. CA1 Interneurons from aged CA3-APP mice showed an increase in theta modulation amplitude compared to age-matched controls (n = 50 and 41 cells, p = 0.038, MW test). All statistics are reported in Table S11.
Figure 6.
Figure 6.. Phase precession and theta sequences were impaired in aged but not in young adult CA3-APP mice.
A. Phase precession slopes of example CA1 place cells. Each spike train in the phase-distance plot is depicted in a different color. Place maps of the corresponding cells are shown to the right. Top, spike locations (red dots) plotted on the mouse’s path (gray line). Bottom: spike rate map, color-coded with red as the peak rate. B. Distribution of phase precession slopes. Each row shows the phase precession slopes of each spike train (gray ticks, non-significant; black ticks, significant) of one place cell in the figure-8 maze. The median (green tick) was calculated by including significant and non-significant slopes, and cells are ordered by their median slope. Phase precession and phase offset in young adult CA3-APP mice did not differ from age-matched controls (n = 351 and 386 cells, p = 0.097 and 0.62, MW tests). C. Same as in B, but for aged CA3-APP mice. There was a reduction in phase precession slope in aged CA3-APP mice compared to age-matched controls and the phase offset was closer to zero in CA3-APP mice compared to controls (n = 351 and 342 cells, p = 0.028 and 0.0019, MW tests). D. Schematic for the comparison between the spatial distance of CA1 place field peaks and the temporal distance within a theta cycle. Both measurements can be obtained from pairs of overlapping place fields. E. Example metrics obtained from a pair of simultaneously recorded cells with overlapping place fields. Theta time scale shift is measured as the time bin with the peak cross-correlation in the −100 ms to +100 ms interval. F. Correlation between place field distance and shift in theta time scale firing was found in young adult CA3-APP and control mice (n = 63 and 83 pairs of overlapping place fields, p = 0.042 and p < 0.0001, Spearman correlations) and in aged control mice (n = 63 pairs, p < 0.0001), but not in aged CA3-APP mice (n = 73 pairs, p = 0.069). All statistics are reported in Table S12.
Figure 7.
Figure 7.. Recordings in CA3/DG showed lesser or comparable effects on LFP frequency compared to recordings in CA1.
A. LFP spectrograms and running speed plots for recording sites in the CA3/DG area of young adult mice are depicted as in Figure 4A. Young adult CA3-APP mice (n = 12) showed a minor difference in running speed compared to young adult control mice (n = 11 mice) in only the choice sub-section of the maze (Figure S6C). B. Quantification of frequency in different LFP bands is shown for the center arm (including stem and choice point). Analyses for other maze sections are provided in Figure S11 and Table S13 and generally follow the same pattern. Theta and high gamma frequencies (p = 0.31 and 0.091, MW test adjusted for multiple comparisons by Holm-Šídák method) did not differ between young adult CA3-APP mice and age-matched controls. C. Quantification of CA3/DG power in different LFP frequency bands. LFP power did not differ between young adult CA3-APP mice and age-matched controls (all p values > 0.05, MW test adjusted for multiple comparisons by Holm-Šídák method). D. LFP spectrograms and running speed plots for recording sites in the CA3/DG area of aged mice. Aged CA3-APP mice (n = 8) showed a minor difference in running speed compared to aged control mice (n = 9 mice) in only the choice and reward sub-sections of the maze (Figure S6D). Data are displayed as in A. E. Theta oscillation frequency in the CA3/DG area was lower in aged CA3-APP mice compared to age-matched control mice (p = 0.0029, MW test adjusted for multiple comparisons by Holm-Šídák method). Data are displayed as in B. Detailed controls for running speed are presented in Figure S6 and Table S9. F. CA3/DG LFP power did not differ between young adult CA3-APP mice and their control littermates. Data are displayed as in C. All statistics are reported in Table S13.
Figure 8.
Figure 8.. In CA3/DG, spike oscillation frequencies of principal cells in the theta range were reduced to a similar extent as for CA1 principal cells, while frequencies of interneurons in aged CA3-APP mice showed a more pronounced effect.
A. Spike oscillation frequencies of CA3/DG principal cells are plotted as in Figure 5A and were lower in young adult CA3-APP mice compared to age-matched controls (n = 500 and 226 cells for CA3-APP mice and controls, p < 0.0001, MW test). B. Average theta modulation amplitude (theta modulation index) of all active CA3/DG principal cells did not differ between cells from young adult CA3-APP mice and age-matched controls (n = 566 and 297 cells, p = 0.50, MW test). C. In young adult CA3 APP mice, there was a minor reduction in the spike oscillation frequency of CA3/DG interneurons compared to age-matched controls (n = 87 and 36 cells, p = 0.016, MW test). Data are displayed as in A. D. Average theta modulation index of all CA3/DG interneurons. Theta modulation amplitude of interneurons did not differ between young adult CA3-APP mice and age-matched controls (n = 111 and 59 cells, p = 0.48, MW test). E. When compared to age-matched controls, principal cells from aged CA3-APP mice showed a major reduction in the spike oscillation frequency with a large fraction of cells oscillating between 7 and 8 Hz (n = 289 and 380 cells in CA3-APP mice and controls, p < 0.0001, MW test). Data are displayed as in A. F. Theta modulation amplitude of CA3/DG principal cells of CA3-APP mice was reduced compared to cells from age-matched controls (n = 316 and 425 cells, p < 0.0001, MW test). G. Compared to age-matched controls, CA3/DG interneurons from aged CA3-APP mice showed a pronounced reduction in spike oscillation frequencies, with almost all interneurons now oscillating below 8 Hz (n = 106 and 52 cells in CA3-APP mice and controls, p < 0.0001, MW test). Data are displayed as in A. H. Interneurons from aged CA3-APP mice showed an increase in theta modulation amplitude compared to age-matched controls mice (n = 106 and 52 cells, p < 0.0001, MW test). Data and statistics are reported in Table S17.

References

    1. Coughlan G, Laczó J, Hort J, Minihane A-M, and Hornberger M. (2018). Spatial navigation deficits - overlooked cognitive marker for preclinical Alzheimer disease? Nat Rev Neurol 14, 496–506. 10.1038/s41582-018-0031-x. - DOI - PubMed
    1. Mapstone M, Steffenella TM, and Duffy CJ (2003). A visuospatial variant of mild cognitive impairment: getting lost between aging and AD. Neurology 60, 802–808. 10.1212/01.wnl.0000049471.76799.de. - DOI - PubMed
    1. Buzsáki G, and Moser EI (2013). Memory, navigation and theta rhythm in the hippocampal-entorhinal system. Nature Neuroscience 16, 130–138. 10.1038/nn.3304. - DOI - PMC - PubMed
    1. Palop JJ, and Mucke L. (2016). Network abnormalities and interneuron dysfunction in Alzheimer disease. Nat. Rev. Neurosci 17, 777–792. 10.1038/nrn.2016.141. - DOI - PMC - PubMed
    1. Mucke L., Masliah E., Yu GQ., Mallory M., Rockenstein EM., Tatsuno G., Hu K., Kholodenko D., Johnson-Wood K., and McConlogue L. (2000). High-level neuronal expression of abeta 1–42 in wild-type human amyloid protein precursor transgenic mice: synaptotoxicity without plaque formation. Journal of Neuroscience 20, 4050–4058. 10.1523/JNEUROSCI.20-11-04050.2000. - DOI - PMC - PubMed

Substances