

Characteristics and Admission Preferences of Pediatric Emergency Patients and Their Waiting Time Prediction Using Electronic Medical Record Data: Retrospective Comparative Analysis
- PMID: 37910168
- PMCID: PMC10652198
- DOI: 10.2196/49605
Characteristics and Admission Preferences of Pediatric Emergency Patients and Their Waiting Time Prediction Using Electronic Medical Record Data: Retrospective Comparative Analysis
Abstract
Background: The growing number of patients visiting pediatric emergency departments could have a detrimental impact on the care provided to children who are triaged as needing urgent attention. Therefore, it has become essential to continuously monitor and analyze the admissions and waiting times of pediatric emergency patients. Despite the significant challenge posed by the shortage of pediatric medical resources in China's health care system, there have been few large-scale studies conducted to analyze visits to the pediatric emergency room.
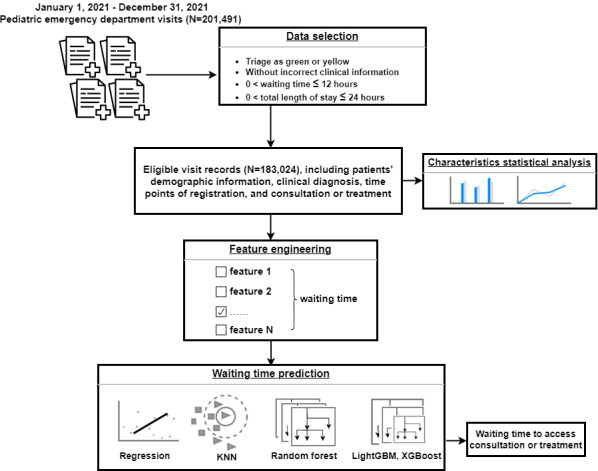
Objective: This study seeks to examine the characteristics and admission patterns of patients in the pediatric emergency department using electronic medical record (EMR) data. Additionally, it aims to develop and assess machine learning models for predicting waiting times for pediatric emergency department visits.
Methods: This retrospective analysis involved patients who were admitted to the emergency department of Children's Hospital Capital Institute of Pediatrics from January 1, 2021, to December 31, 2021. Clinical data from these admissions were extracted from the electronic medical records, encompassing various variables of interest such as patient demographics, clinical diagnoses, and time stamps of clinical visits. These indicators were collected and compared. Furthermore, we developed and evaluated several computational models for predicting waiting times.
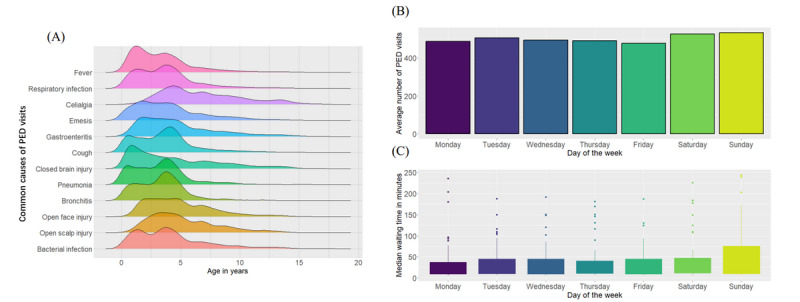
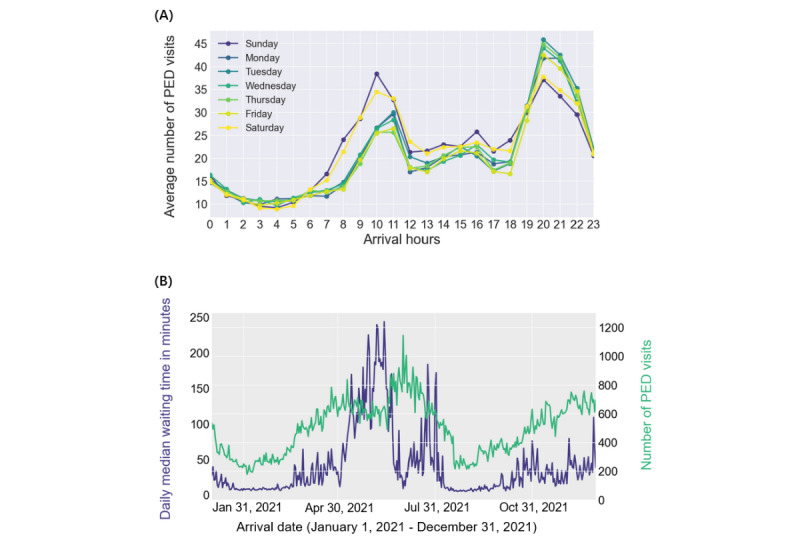
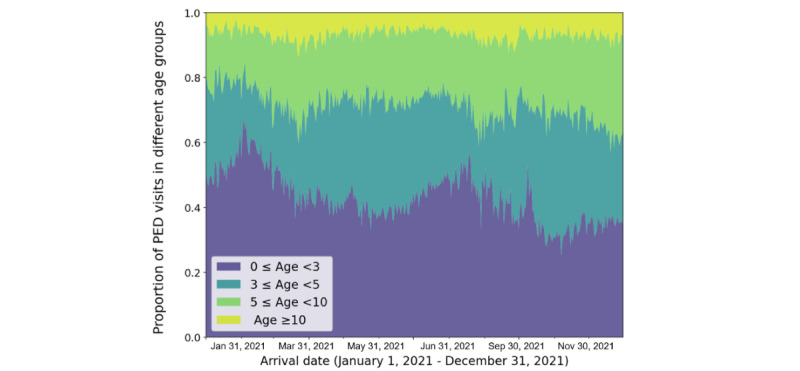
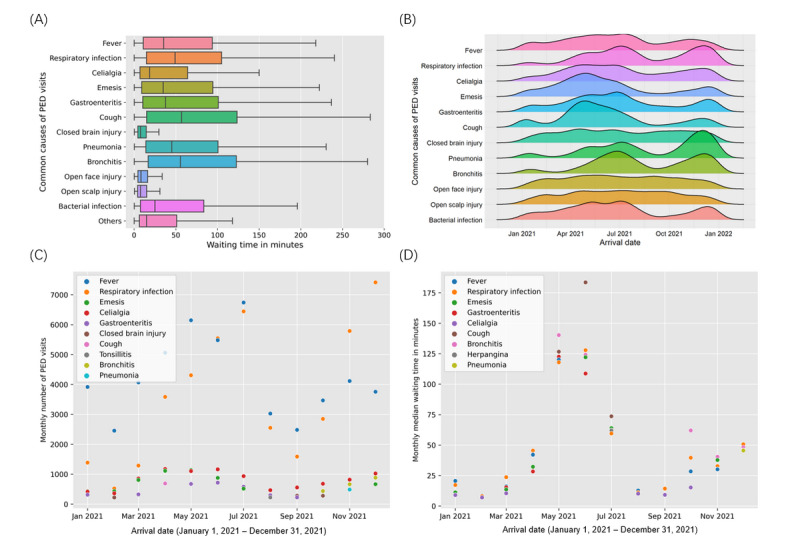
Results: In total, 183,024 eligible admissions from 127,368 pediatric patients were included. During the 12-month study period, pediatric emergency department visits were most frequent among children aged less than 5 years, accounting for 71.26% (130,423/183,024) of the total visits. Additionally, there was a higher proportion of male patients (104,147/183,024, 56.90%) compared with female patients (78,877/183,024, 43.10%). Fever (50,715/183,024, 27.71%), respiratory infection (43,269/183,024, 23.64%), celialgia (9560/183,024, 5.22%), and emesis (6898/183,024, 3.77%) were the leading causes of pediatric emergency room visits. The average daily number of admissions was 501.44, and 18.76% (34,339/183,204) of pediatric emergency department visits resulted in discharge without a prescription or further tests. The median waiting time from registration to seeing a doctor was 27.53 minutes. Prolonged waiting times were observed from April to July, coinciding with an increased number of arrivals, primarily for respiratory diseases. In terms of waiting time prediction, machine learning models, specifically random forest, LightGBM, and XGBoost, outperformed regression methods. On average, these models reduced the root-mean-square error by approximately 17.73% (8.951/50.481) and increased the R2 by approximately 29.33% (0.154/0.525). The SHAP method analysis highlighted that the features "wait.green" and "department" had the most significant influence on waiting times.
Conclusions: This study offers a contemporary exploration of pediatric emergency room visits, revealing significant variations in admission rates across different periods and uncovering certain admission patterns. The machine learning models, particularly ensemble methods, delivered more dependable waiting time predictions. Patient volume awaiting consultation or treatment and the triage status emerged as crucial factors contributing to prolonged waiting times. Therefore, strategies such as patient diversion to alleviate congestion in emergency departments and optimizing triage systems to reduce average waiting times remain effective approaches to enhance the quality of pediatric health care services in China.
Keywords: admission preferences; characteristics; electronic medical record; machine learning; pediatric emergency department; waiting time.
©Lin Lin Guo, Lin Ying Guo, Jiao Li, Yao Wen Gu, Jia Yang Wang, Ying Cui, Qing Qian, Ting Chen, Rui Jiang, Si Zheng. Originally published in the Journal of Medical Internet Research (https://www.jmir.org), 01.11.2023.
Conflict of interest statement
Conflicts of Interest: None declared.
Figures

References
-
- Li X, Krumholz HM, Yip W, Cheng KK, De Maeseneer J, Meng Q, Mossialos E, Li C, Lu J, Su M, Zhang Q, Xu DR, Li L, Normand ST, Peto R, Li J, Wang Z, Yan H, Gao R, Chunharas S, Gao X, Guerra R, Ji H, Ke Y, Pan Z, Wu X, Xiao S, Xie X, Zhang Y, Zhu J, Zhu S, Hu S. Quality of primary health care in China: challenges and recommendations. Lancet. 2020 Jun 06;395(10239):1802–1812. doi: 10.1016/S0140-6736(20)30122-7. https://europepmc.org/abstract/MED/32505251 S0140-6736(20)30122-7 - DOI - PMC - PubMed
-
- Ma X, Chen X, Wang J, Lyman GH, Qu Z, Ma W, Song J, Zhou C, Zhao LP. Evolving healthcare quality in top tertiary general hospitals in China during the China Healthcare Reform (2010-2012) from the perspective of inpatient mortality. PLoS One. 2015 Dec 1;10(12):e0140568. doi: 10.1371/journal.pone.0140568. https://dx.plos.org/10.1371/journal.pone.0140568 PONE-D-14-54429 - DOI - PMC - PubMed
-
- Stoyanov Kiril M, Biener Moritz, Hund Hauke, Mueller-Hennessen Matthias, Vafaie Mehrshad, Katus Hugo A, Giannitsis Evangelos. Effects of crowding in the emergency department on the diagnosis and management of suspected acute coronary syndrome using rapid algorithms: an observational study. BMJ Open. 2020 Oct 08;10(10):e041757. doi: 10.1136/bmjopen-2020-041757. https://bmjopen.bmj.com/lookup/pmidlookup?view=long&pmid=33033102 bmjopen-2020-041757 - DOI - PMC - PubMed
Publication types
MeSH terms
LinkOut - more resources
Full Text Sources
Miscellaneous
