

Tenapanor for peritoneal dialysis patients with hyperphosphatemia: a phase 3 trial
- PMID: 37910313
- PMCID: PMC10808471
- DOI: 10.1007/s10157-023-02406-1
Tenapanor for peritoneal dialysis patients with hyperphosphatemia: a phase 3 trial
Abstract
Background: Tenapanor is a novel selective inhibitor of intestinal sodium/hydrogen exchanger 3 transporter. This is the first trial to assess the efficacy and safety of tenapanor in Japanese patients with hyperphosphatemia who are undergoing peritoneal dialysis.
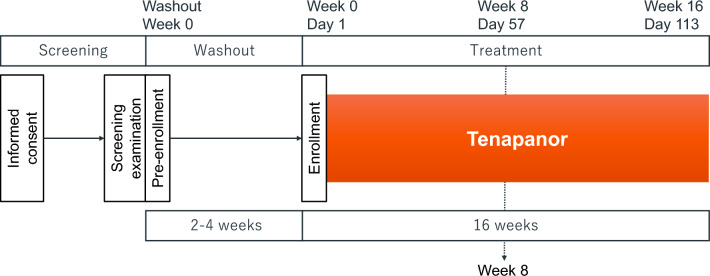
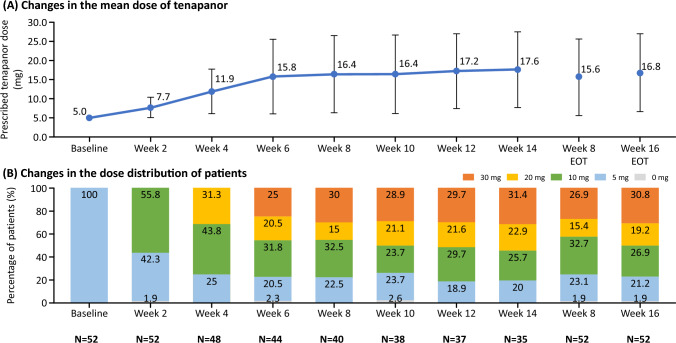
Methods: This phase 3, open-label, multicenter, single-arm clinical trial targeted patients whose serum phosphorus was within 3.5-7.0 mg/dL with phosphate binders at screening. After phosphate binder washout, tenapanor was orally administered twice-daily, stepwise from 5 to 30 mg/dose for 16 weeks. The primary endpoint, mean change in serum phosphorus level, was evaluated at week 8. The 16-week treatment period was completed with tenapanor alone, and only one phosphate binder type was allowed for combined use after the primary endpoint.
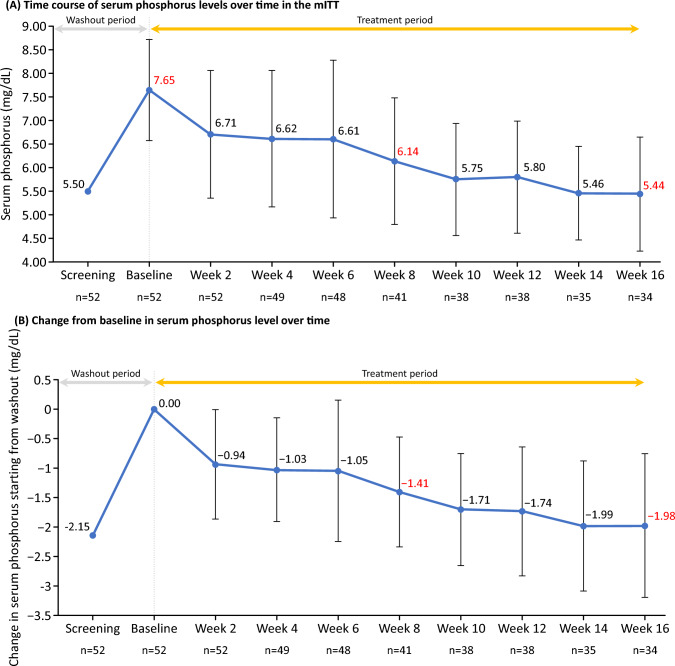
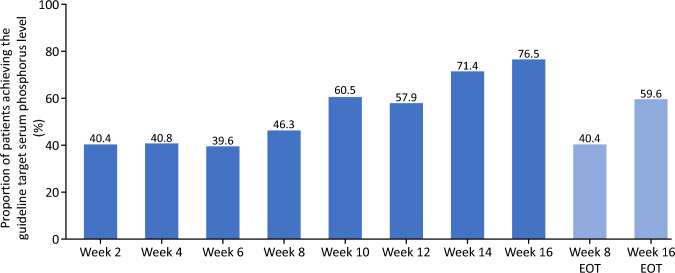
Results: Of the 54 patients enrolled, 34 completed the study. At week 8, the primary endpoint, mean change in serum phosphorus level (last observation carried forward), was - 1.18 mg/dL (95% confidence interval: - 1.54, - 0.81 mg/dL) with tenapanor. From a baseline value of 7.65 mg/dL, serum phosphorus decreased to 6.14 and 5.44 mg/dL at weeks 8 and 16, respectively, and 46.3% and 76.5% of patients achieved serum phosphorus within 3.5-6.0 mg/dL at week 8 and week 16, respectively. The most common adverse event, diarrhea, occurred in 74.1% of patients; the severity of diarrhea was mild or moderate. Thus, the discontinuation percentage due to diarrhea was low at 5.6%.
Conclusions: Administration of tenapanor resulted in a sufficient reduction in serum phosphorus level at week 8 and was considered safe and tolerable.
Trial registration: NCT04766385.
Keywords: CKD-MBD; Chronic kidney disease; Hyperphosphatemia; NHE3 transporter; Peritoneal dialysis; Tenapanor.
© 2023. The Author(s).
Conflict of interest statement
M.N. received lecture fees from Kyowa Kirin. S.K., M.K., M.O., and K.N. are employees of Kyowa Kirin Co., Ltd. T.A. received consulting fees from Kyowa Kirin, Kissei Pharmaceutical, Ono Pharmaceutical, Torii Pharmaceutical, Astellas, Bayer Japan, Sanwa Kagaku, and received lecture fees from Kyowa Kirin, Kissei Pharmaceutical, Ono Pharmaceutical, Torii Pharmaceutical, Astellas, Bayer Japan, and Sanwa Kagaku. M.F. received consulting fees from Sanwa Kagaku and Ono Pharmaceutical, and received lecture fees from Kyowa Kirin, Bayer Japan, and Kissei Pharmaceutical.
Figures


References
Publication types
MeSH terms
Substances
Associated data
LinkOut - more resources
Full Text Sources
Medical
